A network-based threshold model for the spreading of fads in society and markets
Abstract
We investigate the behavior of a threshold model for the spreading of fads and similar phenomena in society. The model is giving the fad dynamics and is intended to be confined to an underlying network structure. We investigate the whole parameter space of the fad dynamics on three types of network models. The dynamics we discover is rich and highly dependent on the underlying network structure. For some range of the parameter space, for all types of substrate networks, there are a great variety of sizes and life-lengths of the fads—what one see in real-world social and economical systems.
I Introduction and definitions
I.1 Background
Society is an epitome of a complex system—at all levels it is driven by non-equilibrium processes by heterogeneous sets of agents (or actors, in sociologist speech). One of the more remarkable phenomena in our everyday world is the presence of fads. How a certain mp3-player get a substantial part of market, while other very similar products with advertising budgets of a similar size, fade into obscurity? The same question applies to everything from merchandise to sports, culture and possibly even science. According to traditional economic modeling bik:fads such phenomena are due to “information cascades” in social networks. These can occur since the information conveyed by the actions of a person’s friends is more credible than advertisement bik:fads ; arthur:contagion , thus spreading from one person to another can be an influential mechanism in a society with mass-advertisements bik:fads . A popular class of models for the spreading phenomena of this kind is so called threshold models rolfe:thrs ; watts:fad ; our:youth . These, in general, serve to model social and economic systems where the agents have a resistance to change, but do change provided the motivation to do so is big enough. Threshold models are attractive for physicists: They are well-suited for the analytical and numerical techniques used by statistical physicists. Furthermore this kind of models are by their nature defined on networks, so for the understanding of them one need the theory of network structure doromen:book ; mejn:rev ; ba:rev (a currently popular topic among interdisciplinary physicists). In this report we study an extension of a threshold model proposed by Watts watts:fad introduced as a model of the dynamics of youth subcultures in Ref. our:youth . We perform a more detailed study of its behavior on several underlying types of networks. We argue that this model is applicable to a wide range of social spreading phenomena.
I.2 Model
Society and markets are non-equilibrium systems—if you see a twenty year old picture of a downtown street scene, you would recognize that it is not contemporary; if someone told you a ten year old mobile phone was brand new, you would not be fooled. This direction of time in society and markets is manifested through new things (commodity, music, hobbies, beliefs, etc.) replacing old. In many cases a person gets her, or his, motivation to change an old item to a new one by friends, colleagues or other people in her, or his, social surrounding. If many neighbors in a person’s social network are doing, or owning, something new, then that person is likely to follow the neighbors’ behavior. Another factor in this type of spreading is that new things are more attractive than old, if this would not be the case the above mentioned direction of time (manifested by new inventions replacing old) would simply not exist. But there is also a resistance to change that slows down the spreading of such habits.—for the sake of convenience or old habits one may want to stick to the old rather than changing to the new. In summary, the three main principles of the spread of fads are:
-
1.
If the fraction of neighbors in the social network of a person currently adopting a certain fad is big enough, then that person will adopt that fad too.
-
2.
The attractiveness of a fad decreases with its age.
-
3.
There is a certain resistance to adopting a fad.
(From now on we refer to all habits, merchandise, etc., as “fads,” regardless if they are large or small.) Too keep the model simple, we need some further (little less realistic) assumptions—for future studies of this problem these assumptions can be relaxed.
-
4.
The underlying social network is changing much slower than the dynamics of the fads.—This means that we can keep the underlying network fixed and run our fad-simulations on top of it.
-
5.
An individual adopts one fad at a time.—In many cases we can assume that a fad in one area, say recreational sports or cell phones, is independent of fads in other areas, so that the model can be applied separately for each case.
To combine points 1 and 2 we assign, for each individual , a score for every fad . The score is intended to represent the attractiveness of the fad to the individual. If the score exceeds the threshold , then the individual adopts that fad. The score function we use is:
| (1) |
where is the average degree, is the number of ’s neighbors adopting fad , is ’s degree and is the introduction time of fad and is ’s fad at time . The factor rescales the score with respect to the degree of the vertex. This enables us to use the same threshold for every vertex while still fulfilling point 1. The factor should be interpreted as the attractiveness of a being proportional to the age difference between and the vertex’ current fad and inversely proportional to the age of .
The dynamic model can thus be defined as:
-
1.
Start with all vertices having the same fad. (The starting configuration is, in the limit of long run-times, negligible.) Let this initial fad have age zero at .
-
2.
Go through the vertex set sequentially and, for each vertex , calculate the score function .
-
3.
Go through the vertex set sequentially once again. If change ’s current fad to . If more than one fad exceeds the threshold then the one with highest score is adopted.
-
4.
If the initial fad has vanished, save information about the fad configuration for statistics.
-
5.
With a probability a new identity is assigned to a random vertex. So, on average, fads are introduced per time step.
-
6.
Increase the time counter (i.e. the time is measured in number of iterations) and go to point 2 unless the simulation is finished.
The only model parameter, apart from the network parameters and the total time of the simulation, is the threshold . We let the simulation run for time steps and network realizations (the precise number chosen to make errorbars sufficiently small—the system is self-averaging so larger networks needs smaller averages).
I.3 Networks
We use three types of underlying model networks in our simulations. The reason for this variety is twofold—first, the structure of the type of social networks fads spread over is not exactly known our:seceder ; then, by comparing model networks with well-known structural properties, one can conclude how the different network structures influence the dynamical properties of the network. The models we use are the Erdős-Rényi (ER) random graphs er:on , the networked seceder model our:seceder , and a scale-free network model (SF) model gronlund:sf .
The Erdős-Rényi model is the simplest, most random, network model. One starts from isolated vertices and add edges, one by one, such that no multiple edges or self-edges are formed. These networks are characterized by a very narrow distribution of the degrees (Poissonian to be exact), a vanishing clustering wattsstrogatz (density of triangles), and no pronounced community structure mejn:commu (i.e. the feature that the network can be clearly partitioned into subnetworks that are densely connected within but sparsely interconnected). The ER model lacks much of the structure (high clustering, pronounced community structure, etc) that social networks are believed to have mejn:rev . On the other hand, its lack of structure makes it a good reference model to compare results from other models to. To be well above the threshold for the emergence of a giant component (which occurs when ) janson we set . Before applying the dynamics we delete (the vanishingly small fraction of) vertices and edges outside the giant component.
Our second network model is the networked seceder model. It is a model designed to create networks with a strong community structure by mimicking some features of social networking between individuals. For its precise definition we refer to Ref. our:seceder . The parameters of this model are the network sizes and and a parameter controlling the strength of community structure—if the network is of ER model character, if the network has maximal community structure. Here we use and throughout the paper. Seceder model networks have (just like acquaintance networks are believed to have) high clustering, pronounced community structure, and a positive correlation between degrees at either side of an edge mejn:assmix . The degree distribution is exponentially decreasing (we note that some real-world networks do have an exponential degree distribution our:seceder ; amaral:classes ).
Both the ER and the seceder model have rather sharply peaked degree distributions. As mentioned, it is not really clear what kinds of degree distribution social networks have—probably different kinds of social networks show different distributions. Since degree frequently is power-law distributed we include a model generating networks with a power-law distribution of degree. The method can in short be described as a preferential attachment model ba:model where the network grows both by the addition of stubs (a vertex and an edge with one end attached to the vertex). The model has one parameter, , that sets the stub to edge addition ratio. A detailed presentation of the model can be found in Ref. gronlund:sf . One starts with a connected pair of vertices, and, at each time step, with probability add a stub to the network. Then, with probability , an additional edge is added. Here we use to obtain the same density of edges, , as for the other networks. In all steps edges are added preferentially (i.e., the vertex to attach to is selected with a probability proportional to the degree of the vertex). The degree distribution at a given and sufficiently large network is a power-law with an exponent
| (2) |
The generated SF networks have a positive degree-degree correlation compared with a randomized version with the same degree distribution gronlund:sf , but the effects of correlations are not further investigated here.
II Simulation results
II.1 The time evolution of fads
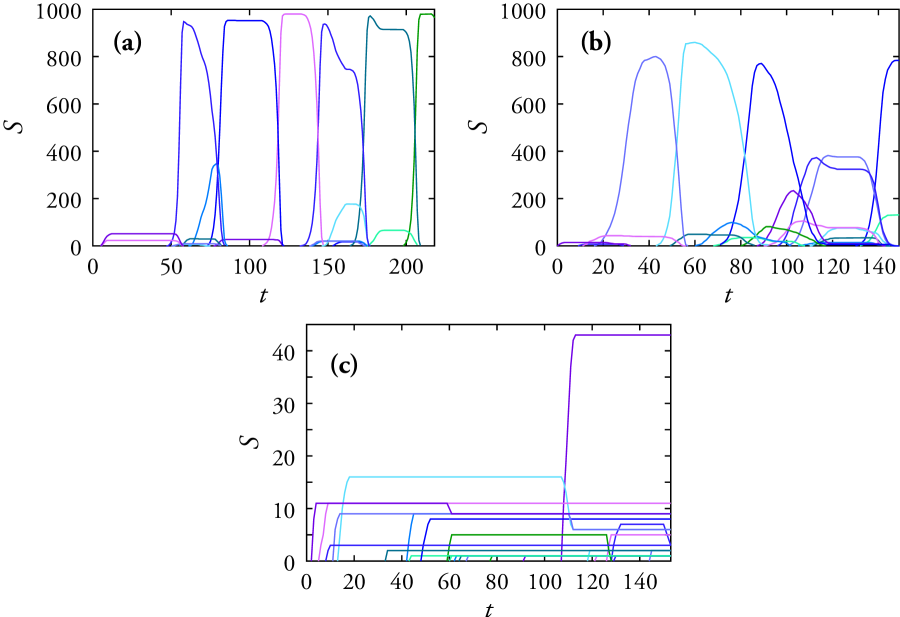
To get a first picture of the evolution of fads we plot the time evolution of the size (number of adopters) in Fig. 1. The ER and seceder model networks show a rather similar behavior—for both these systems the effect of the initial network seems to have disappeared within the interval . For the SF networks the situation is radically different—despite the similar threshold value (), the fads only spread to very limited surrounding. The reason for this is the presence of hubs in the SF networks (i.e. vertices with a degree far bigger than the average). The hubs have a larger influence on the others, but are also less sensitive to new fads in their surrounding. In the time evolution depicted in Fig. 1(c) no fads manage to replace the initial fad of a hub.
| type | |||||
|---|---|---|---|---|---|
| ER | 0.0 | 1097(2) | 12.53(9) | 0.524(4) | |
| 0.5 | 637(2) | 19.54(6) | 0.276(8) | ||
| 1.0 | 8.8(3) | 0.129(7) | |||
| sec. | 0.0 | 977(4) | 14.4(2) | 0.593(4) | |
| 0.5 | 492(2) | 28.3(2) | 0.42(1) | ||
| 1.0 | 29(1) | 351(6) | 0.32(2) | ||
| SF | 0.0 | 1189(1) | 10.55(5) | 0.416(5) | |
| 0.5 | 163(5) | 43(1) | 0.274(6) | ||
| 1.0 | 3.1(1) | 0.142(7) |
II.2 Distribution of fad sizes and durations
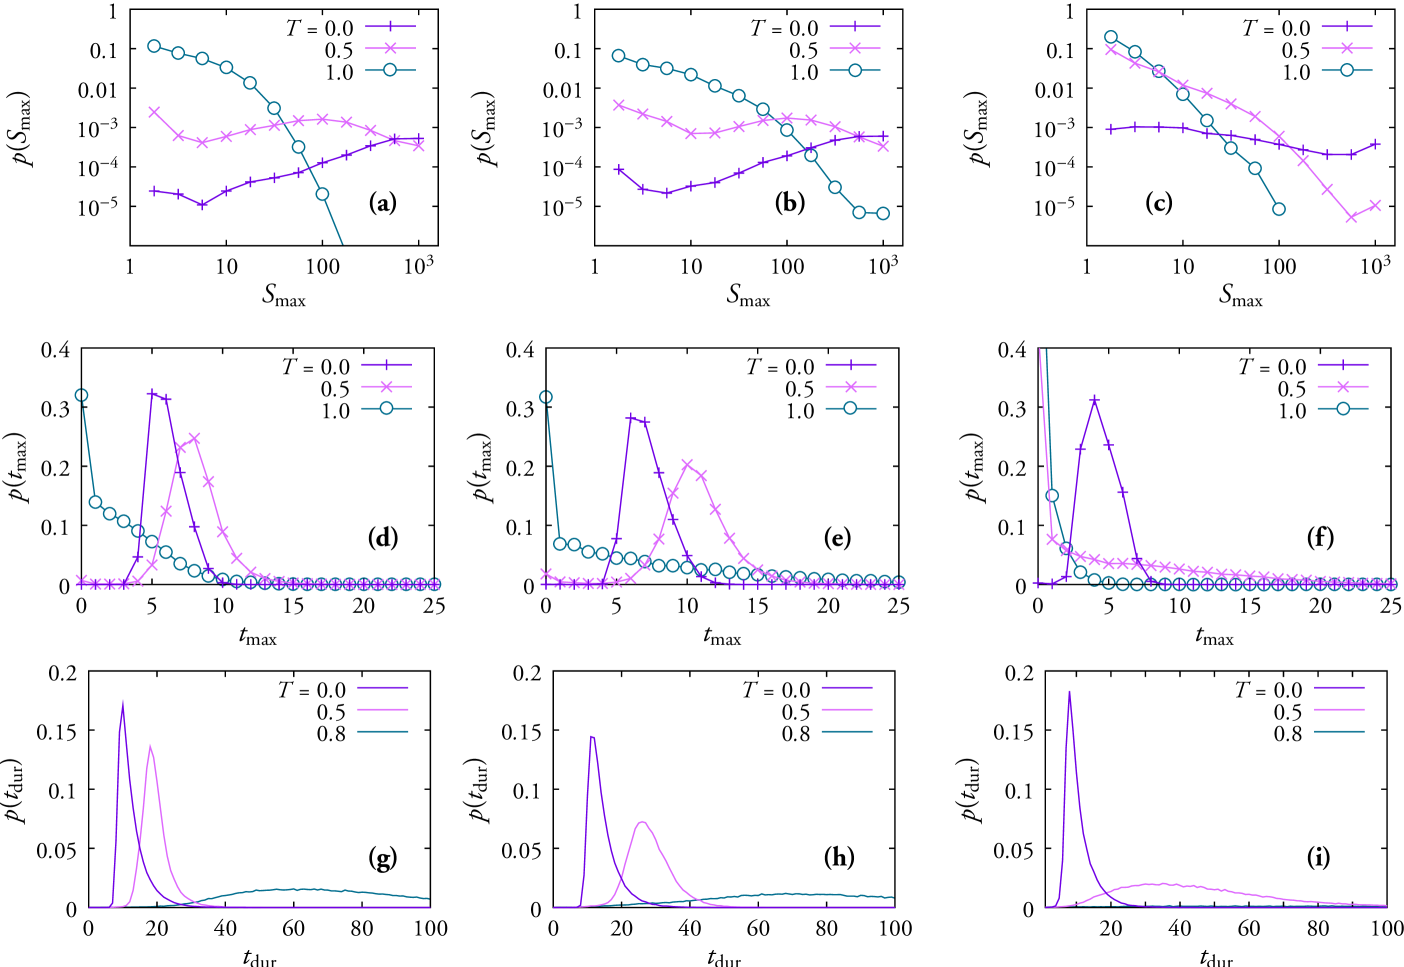
From Fig. 1(a) and (b) we see that really can grow to very big fraction of the system size. But this does not mean that there, in general, always can be fads of all sizes. Let the threshold be fixed and finite and consider a network ensemble with fixed average degree and a monotonically growing average distance between the vertices (such as the three models considered—and, indeed, anything else would be rather extreme). Since a fad can spread out from its origin one edge at a time step, and since new fads can appear everywhere in the network, there will almost surely be new fads to stop an old fad before they reach a (big enough) fixed size in the limit. I.e., the probability that goes to zero fast as . On the other hand, the large size limit does not make much sense for social systems. The reason for this is that social networks are of the small-world type milg:1 ; watts:small2 with extremely short average path lengths. Anything spreading from friends to friends will only need the six degrees of separation watts:six to reach an extension where the finite size of humanity needs to be accounted for. This means our model will not have phase where fads can grow without limit (like Watts’ model has watts:fad ). If “revival” fads (retro fashion and the like) are treated as new fads, this is not a problem—in the real world there are simply no fads with unlimited staying power. Even without fads that can grow boundlessly, the model can (of course) show a broad spectrum of dynamic behavior. To investigate this we start by plotting the probability distribution function of the maximal number of adopters of a fad , for our three network models and a number of threshold values (see Fig. 2(a), (b) and (c)). We see that the functional form of takes drastically different shapes of the different parameter values. For the curves are almost non-decreasing for all model networks. As mentioned above, the monotonically increasing -curves are finite-size effects (we will see this more clearly later). In Fig. 1(d), (e) and (f) we plot the probability density function of —the time it takes for a fad to reach its maximum value. For low threshold values has a sharp peak. This observation—that fads reach their peak after a characteristic time—is a possible test of the model (unfortunately we do not know of such a data set). In Fig. 1(g), (h) and (i) we show the probability density function of the life-times of fads. We note that the general shape of the curves is rather similar to the -curves—the average and the variance increase with . However, the double peaks of the -curves, for low threshold values, are now gone. This means that the fads with an early peak does not go extinct sooner than the fads of the second peak, they just do not enter a stage of growth (i.e. they probably only consist of one or a few vertices). The relation between the - and -curves can also tell us something about the typical life span of a fad. On average, fads are introduced per time step, the average integrated time per fad is :
| (3) |
If is close to the shape of a fad (in a -plot) will be near rectangular. In Tab. 1 we list values of (for the curves of Fig. 2) along with values of , and the correlation between the two latter quantities. What we find is that the SF model network have -values quite close to (- times larger), thus for these networks it may be relevant to divide the life-time of a fad into a growth stage, a quasi-stationary stage and stage of decline. The other networks have -values far above , we can thus conclude that fads in these network have a much slower growth or decline than fads in the SF model networks.
II.3 What determines the size of the fad?
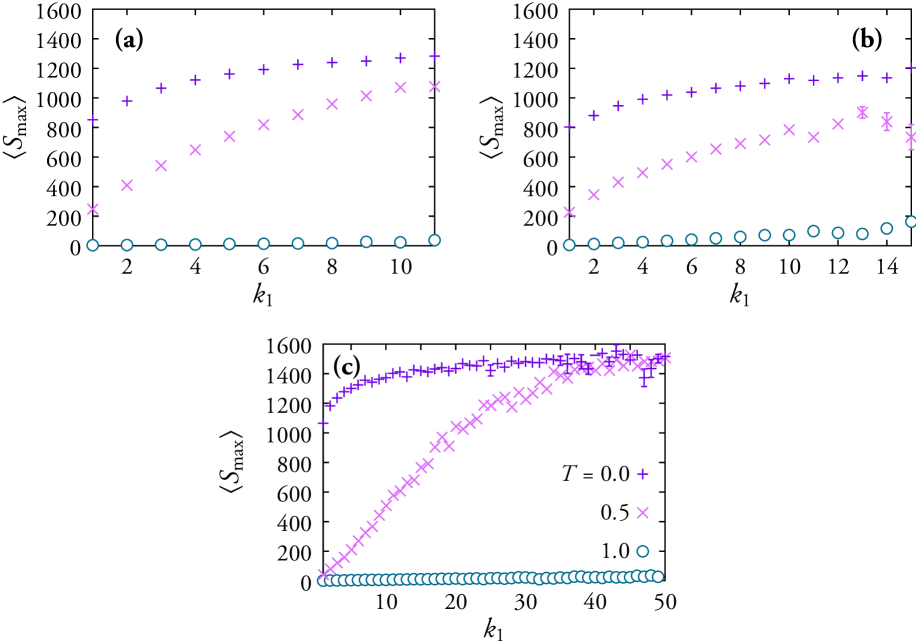
The early time-evolution of a new fad depends on the age and configuration of fads in the surrounding of the first adopter. Another factor is the network characteristics of the first adopter. For example, if the first adopter has a high degree, there are more people the fad can spread to, and thus the chances for it to spread will increase. To test this, we plot the average maximal size conditioned on the degree of the first adopter in Fig. 3. As expected for all network types and threshold values is (within the errorbars) strictly increasing with the degree of the first adopter . The broad degree distribution of the SF-model networks is also strengthening this effect. The increase seems to be most dramatic for low-degree vertices and intermediate -values—for the vertices of SF model networks increase over 15 times when decreases from to .
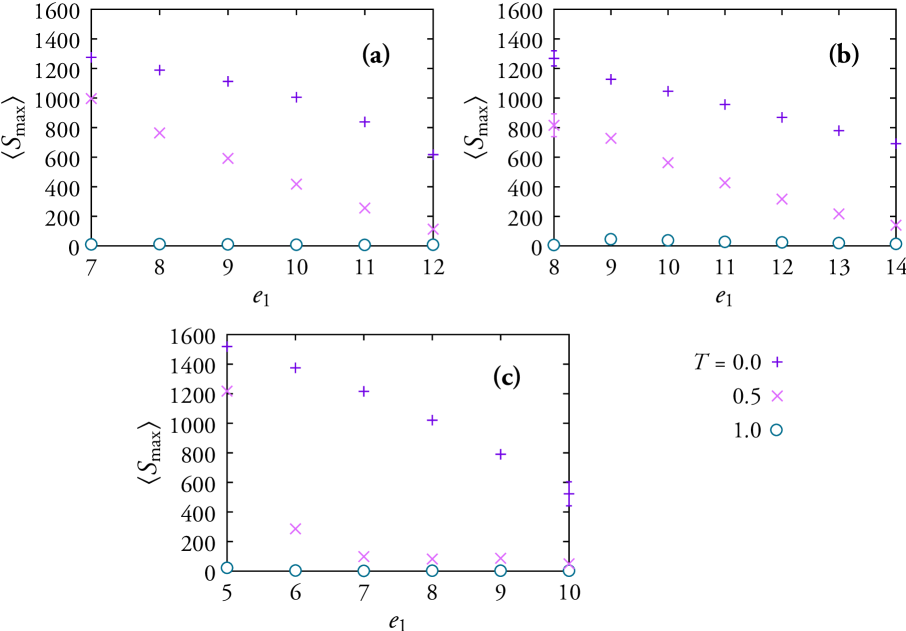
Another network property than can influence the size of the fad is the centrality of the first adopter. If a fad starts at a peripheral vertex, it would be old already at the time it reaches the more central regions. As seen in Fig. 4 this is indeed true for almost all network models and threshold values (the one exception is the curve in Fig. 4(b) where the point lies below the point). The effect is (just as for the degrees of the first adopter) strongest for the SF networks with . Networks with a power-law degree distribution are known to have a very compact core within which the average path lengths scale as (to be compared with the scaling in the graph as a whole) chung_lu:pnas ; cohen:ultra . It is thus not a surprise that the fads starting in the core ( in Fig. 4(c)) are more likely to spread to a large population than the peripheral vertices.
II.4 Finite-size scaling of the fad sizes
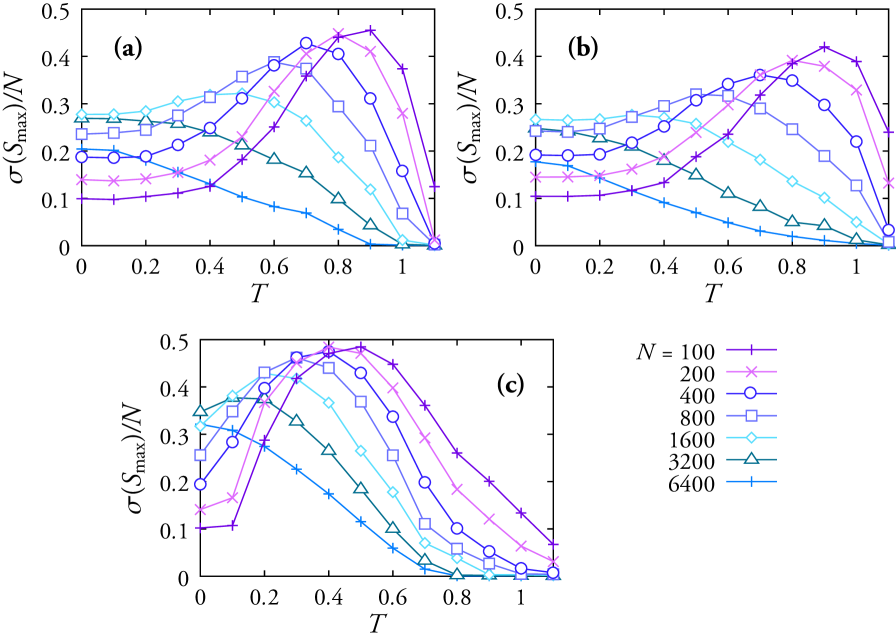
As discussed above we do not expect a phase where the fads can grow boundlessly. To investigate this further we plot the standard deviation of the maximal fad size divided by the system size (Fig. 5). In a situation where variance of the maximal sizes of the fads does not diverge, this quantity will tend to zero as the system size increases. As expected, this is exactly what we observe for all networks and threshold values. For networks with a small diameter, and thresholds that allow high growth rates of the fads, the finite system size will limit the growth of a significant fraction of the initiated fads. Therefore, for small systems sizes and threshold values, the variance appears to diverge as grows. For a sufficiently large network though (in which one observes the maximum sizes of the fads to be significantly smaller than the size of the network); the growth of a fads will, in general, not be limited by the boundary. Thus the variance will in this case not be bounded by the finite size of the system, but rather be bounded by the appearance of new (and thus more attractive) fads at the boundary of the fad. In this situation the maximal size of a fad highly depends its possible growth rate while being young, and thus on the network structure. This implies that scaling up the network without altering its topological characteristics, will not produce larger fluctuations. Specifically, if we consider the fluctuations at the threshold , we see that the relative size of the fluctuations grows with the system size until a certain is reached, and from there on it does not increase with the system size. For the biggest systems simulated, , the largest fluctuations at are found in the SF networks because of the potentially much faster growth rate of a fad here than in the other networks.
The peaked shape of the vs. curves can be explained by two competing mechanisms governing the variance of the fads; if is small newer fads will spread to vertices currently occupied by older fads until they get old and unattractive or replaced by new fads, and it is reasonable to believe will be sharply peaked around its average in this case; if is large, most fads will die out as soon they are born, some fads may spread to a large population but not many enough to make the variance large. In the real world we expect the fads to have a rather broad, but decreasing, distribution of maximal sizes watts:fad ; our:youth , a situation resembling intermediate -values.
III Summary and conclusions
The spreading of fads is a peculiar and poorly understood phenomenon in social and economic systems. In this paper we present a thorough investigation of a dynamical model for the spreading of fads put on three types of underlying complex network models: Erdős-Rényi random graphs, the networked seceder model and a model generating networks with power-law distributed degrees. The reason to use several underlying network models is that the network structure of social networks in general (and the kind of social network fads spread over in particular) is in several aspects unknown. The reason we include the Erdős-Rényi model is that it is the simplest, most well-studied and most random network model. The networked seceder model captures many features—assortative mixing, high clustering and community structure—that social networks are believed to have. Studies of some types of social networks (sexual networks liljeros:sex and networks of electronic communication aiello ; pok ; bornholdt:email ) report fat-tailed distributions of degree, something the Erdős-Rényi and seceder model networks lack. For this reason we also include the model producing networks with a power-law degree distribution.
The fad dynamics is based on five assumptions about the individual’s responses to his/her social surrounding. In brevity, a person is only adopting one fad at a time, and (s)he is willing to adopt a new fad only if its attractiveness exceeds a certain threshold value. The attractiveness of a fad increases with the number of network neighbors that are currently following that particular fad, and decreases with the age of the fad. For small threshold values, the life-length of a fad is rather sharply distributed whereas the maximal size can take a broad range of values. For high thresholds, the probability distribution of the life-time of a fad decreases slowly (i.e. some fads live a very long time, but most fads die as soon as they appear), and the distribution of maximal sizes is decaying rather fast. In the intermediate regime there are fads of all kinds of sizes and life lengths. While this general picture is true for all three underlying network models other features are different between the models: The shape of the time-evolution (i.e. the functional shape of the size of the fad vs. time ) differs—the SF model has fads with distinct stages of growth and decline, whereas the ER and seceder models have more complex time evolutions (being much smaller than their maximal value most of the time). Furthermore, we investigate how the size of the fad depends on the network characteristics of the first adopter. We find that a fad is more likely to be large if the first adopter has a high degree or a low eccentricity.
Our model captures some known features of fad-sensitive social and economic systems, like a wide-distribution of fad sizes and duration times watts:fad ; our:youth ; and other features that seem very plausible, like that the largest fads typically start at socially well-connected and central persons. This field would however benefit substantially from quantitative data, both regarding how individuals respond to their social surrounding (in terms of their fads) and the time evolution of the fads themselves. We note that, in the respect, the study of fad-dynamics lags behind related fields like the study of voluntary organizations liljeros:phd .
References
- (1) W. Aiello, F. Chung, and L. Lu. A random graph model for massive graphs. In Proceedings of the 32nd Annual ACM Symposium on Theory of Computing, pages 171–180, New York, 2000. Association of Computing Machinery.
- (2) R. Albert and A.-L. Barabási. Statistical mechanics of complex networks. Rev. Mod. Phys, 74:47–98, 2002.
- (3) L. A. N. Amaral, A. Scala, M. Barthélémy, and H. E. Stanley. Classes of small-world networks. Proc. Natl. Acad. Sci. USA, 97:11149–11152, October 2000.
- (4) W. B. Arthur and D. A. Lane. Information contagion. Structural Change and Economic Dynamics, 4:81–104, 1993.
- (5) A.-L. Barabási and R. Albert. Emergence of scaling in random networks. Science, 286:509–512, 1999.
- (6) S. Bikhchandani, D. Hirshleifer, and I. Welch. A theory of fads, fashion, custom, and cultural change as information cascades. Journal of Political Economy, 100:992–1026, 1992.
- (7) F. Chung and L. Lu. The average distances in random graphs with given expected degrees. Proc. Natl. Acad. Sci. USA, 99:15879–15882, 2002.
- (8) R. Cohen and S. Havlin. Scale-free networks are ultrasmall. Phys. Rev. Lett., 90:058701, 2003.
- (9) S. N. Dorogovtsev and J. F. F. Mendes. Evolution of Networks: From Biological Nets to the Internet and WWW. Oxford University Press, Oxford, 2003.
- (10) H. Ebel, L.-I. Mielsch, and S. Bornholdt. Scale-free topology of e-mail networks. Phys. Rev. E, 66:035103, 2002.
- (11) P. Erdős and A. Rényi. On random graphs I. Publ. Math. Debrecen, 6:290–297, 1959.
- (12) A. Grönlund and P. Holme. Networking the seceder model: Group formation in social and economic systems. Phys. Rev. E, 70:036108, 2004.
- (13) A. Grönlund, K. Sneppen, and P. Minnhagen. Correlations in networks associated to preferential growth. To appear in Physica Scripta, e-print cond-mat/0401537.
- (14) P. Holme, C. R. Edling, and F. Liljeros. Structure and time evolution of an Internet dating community. Social Networks, 26:155–174, 2004.
- (15) P. Holme and A. Grönlund. Modelling the dynamics of youth subcultures. To appear in Journal of Artificial Societies and Social Simulation, e-print physics/0504181.
- (16) S. Janson, T. Łuczac, and A. Ruciński. Random Graphs. Whiley, New York, 1999.
- (17) F. Liljeros. The Complexity of Social Organizing. PhD thesis, Stockholm University, Stockholm, Sweden, 2001.
- (18) F. Liljeros, C. R. Edling, L. A. N. Amaral, H. E. Stanley, and Y. Åberg. The web of human sexual contacts. Nature, 411:907, 2001.
- (19) S. Milgram. The small world problem. Psycol. Today, 2:60–67, 1967.
- (20) M. E. J. Newman. Assortative mixing in networks. Phys. Rev. Lett., 89:208701, 2002.
- (21) M. E. J. Newman. The structure and function of complex networks. SIAM Rev., 45:167–256, 2003.
- (22) M. E. J. Newman and M. Girvan. Finding and evaluating community structure in networks. Phys. Rev. E, 69:026113, 2004.
- (23) M. Rolfe. Social networks and threshold models of collective behavior. Preprint, University of Chicago, 2004.
- (24) D. J. Watts. Networks, dynamics, and the small world phenomenon. Am. J. Sociol., 105:493–592, 1999.
- (25) D. J. Watts. A simple model of global cascades on random networks. Proc. Natl. Acad. Sci. USA, 99:5766–5771, 2002.
- (26) D. J. Watts. Six Degrees: The Science of a Connected Age. W. W. Norton & Co., New York, 2003.
- (27) D. J. Watts and S. H. Strogatz. Collective dynamics of ‘small-world’ networks. Nature, 393:440–442, 1998.