On the behavior of micro-spheres in a hydrogen pellet target
Abstract
A pellet target produces micro-spheres of different materials, which are used as an internal target for nuclear and particle physics studies. We will describe the pellet hydrogen behavior by means of fluid dynamics and thermodynamics. In particular one aim is to theoretically understand the cooling effect in order to find an effective method to optimize the working conditions of a pellet target. During the droplet formation the evaporative cooling is best described by a multi-droplet diffusion-controlled model, while in vacuum, the evaporation follows the (revised) Hertz–Knudsen formula. Experimental observations compared with calculations clearly indicated the presence of supercooling, the effect of which is discussed as well.
keywords:
Internal target; Hydrogen target; Droplet; Pellet; Evaporative cooling; Supercooling; Nucleation.PACS:
68.10.Jy , 44.25.+f , 64.70.Dv , 25.75.Dw , 07.20.Mc, , , , and
1 Introduction
The usage of internal targets in storage-ring accelerators has opened up a new era for the investigations of nucleon-nucleon collisions with high precision in hadron physics. The figure of merit for physics experiments is usually the (integrated) luminosity, i.e. the target thickness times the particle beam intensity. For light targets such as hydrogen or deuterium it is quite difficult to achieve the necessary high luminosity with a conventional gas target. The alternative of using frozen micro-spheres, so-called pellets, has been suggested and a prototype pellet-generator was developed by Trostell [1]. A pellet target avoids unnecessary background gas load to the accelerator ring and allows an effective target thickness of a few times atoms/cm2 [2, 3]. Since the target tubes connected to the accelerator ring are rather narrow, detectors can be placed close to the interaction point in a nearly sr configuration. These particular characteristics of a pellet target have caused worldwide attention, and in the near future pellet target facilities are foreseen in Jülich, Germany, and in Lanzhou, China. Furthermore, this kind of target is considered as one of the main options for the future PANDA experiment [4] at FAIR in Darmstadt, Germany.
Until now there is only one pellet target facility permanently installed and actively operated inside a storage-ring accelerator. It is connected to the WASA (Wide Angle Shower Apparatus) detector at CELSIUS at The Svedberg Laboratory, Uppsala, Sweden. This target has successfully provided hydrogen pellets for experimental data taking since 1999, with deuterium pellets being produced as well since 2004.
The principle of operating a pellet target has been described elsewhere [1, 5], and here we only briefly review those parts which are of importance for this work. Compared to the earlier work, we have undertaken more systematic studies to theoretically understand and optimize the target performance. We will describe the behavior of a pellet target on the basis of a thermodynamic analysis. We will further restrict ourselves to hydrogen pellets, but the mechanism is similar for deuterium pellets. Data values concerning hydrogen are taken from Ref. [6], as throughout this work. Concerning the micro-spheres, the naming convention used in this paper is droplet whenever we talk about the liquid phase and pellet for the solid phase, while the word micro-sphere covers both cases as well as the intermediate one.
2 Experimental setup
The pellet-generation system consists of four parts:
-
1.
a coldhead with heat exchangers, in which pressurized hydrogen gas is cooled and liquified,
-
2.
a droplet formation chamber (DFC), where a glass nozzle together with an acoustical excitation system produces and breaks-up the jet of liquid hydrogen into uniformly spaced and sized droplets,
-
3.
a vacuum injection system through which the droplets transform to totally frozen micro-spheres (and hereafter are called pellets), and
-
4.
a skimmer to collimate the pellet beam.
The hydrogen is cooled by a commercially available two-stage coldhead. At stage 1, a first heat exchanger is mounted to cool the gas to about K. At stage 2, a second heat exchanger regulates the temperature to K. Inside this latter heat exchanger the gas will be liquified and brought to the nozzle directly attached at the exit, as depicted in Fig. 1. The carrier gas, helium, which is brought to the DFC in a separate channel is also cooled by this heat exchanger though it will always stay in gas phase.
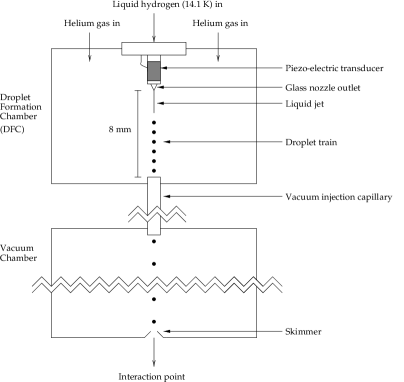
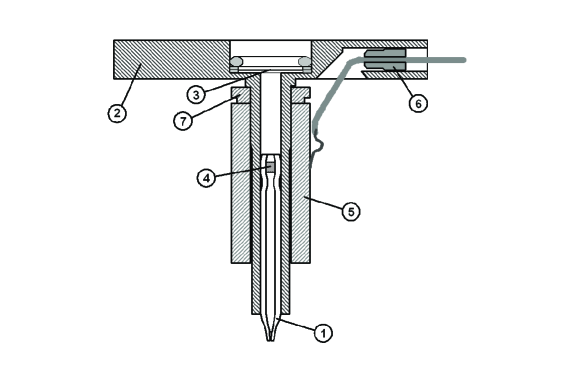
The breakup of the liquid hydrogen jet is a result of the acoustical excitation with axial symmetry induced by the ceramic piezo-electrical transducer connected to the nozzle (see Fig. 2). The DFC is a stainless steel chamber with four windows allowing optical observations in both transverse directions, which enables us to control the droplet formation.
The vacuum injection consists of a mm long capillary, connected to a differentially pumped vacuum chamber. Another cm downstream the exit of the vacuum injection capillary, a collimating skimmer is placed to skim off the pellets with too large angular divergence. The collimated pellets will proceed an additional m before they reach the interaction point with the ion beam. As a last step they are captured by active charcoal inside the cryogenic beam dump. The mechanical details of this facility can be found in Ref. [1].
3 Operating conditions and measurements
The operating conditions of the pellet target have been developed steadily over the years. The inner diameter of the nozzle exit has decreased from initially roughly m to presently m, which in turn has resulted in a pellet diameter decrease from m to a value of about m. The rate of hydrogen pellets reaching the interaction point has increased from s-1 to almost s-1. The optimal working frequency of the transducer is conditionally determined and may vary over a wide range, typically from kHz to kHz. Nevertheless, for an individual experimental run the working frequency can only change within a quite narrow frequency window. It can only be determined experimentally by the observations of a “nice” droplet train, a good micro-sphere survival ratio through the vacuum injection capillary, and a strong concentration of pellets at the center of the skimmer. In this article, the logged data from the last hydrogen run in December 2003 were used as example. The conditions for this run were: a measured distance of mm between two successive droplets in the droplet formation chamber, a transducer frequency of kHz, a nozzle diameter m, a pressure in the droplet formation chamber of mbar, and a driving pressure of mbar for the injected hydrogen gas.
Normally, either cooled hydrogen gas or helium gas at a temperature of about K could be used as the background gas inside the DFC. To get a good pellet concentration at the skimmer one wants to have as low pressure as possible in the DFC, otherwise the angular pellet divergence from the vacuum injection becomes too large. If the absolute pressure in the droplet chamber is too low there is a risk that the liquid jet will degenerate into a spray which immediately freezes and blocks the jet. This risk has been significantly reduced by the use of helium as background gas. The higher viscosity of helium gives a more steady gas flow through the vacuum injection capillary. As a result of this it is possible to have a higher absolute pressure in the DFC and still get a good concentration at the skimmer. The lower critical temperature of helium also eliminates the risk that the gas will liquefy in the second heat exchanger.
The ambient gas in the DFC is thus a mixture of two kinds of gases; helium and the evaporated hydrogen gas. The flow of helium is regulated by the total DFC pressure. In addition, it was found that when the helium supply was shut off, the background gas which only consisted of hydrogen had an equilibrium pressure of mbar. Thus we assume that in the gas mixture the hydrogen vapor was also occupying a partial pressure of mbar, and the residue mbar is ascribed to helium gas for a constant total pressure of mbar in the DFC.
It has been theoretically and experimentally proven that the hydrogen droplets are fragile because of their rather low surface tension and thus are easily destroyed by the high-speed gas flow in the vacuum injection capillary while solid hydrogen-spheres would probably survive the vacuum injection better [7, 8]. To avoid freezing of the liquid jet itself but at the same time enable the droplets to freeze as soon as possible, the temperature of liquid hydrogen at the exit of the nozzle is precisely controlled to be a slightly higher than the normal freezing temperature, K, namely K, while the total pressure, thus also the partial pressure of hydrogen vapor, in the droplet formation chamber is set to a value much lower than the triple-point pressure of hydrogen (mbar).
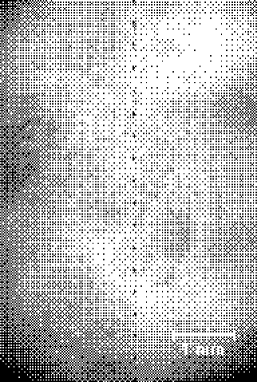
Pictures (see Fig. 3) of the droplets have been taken in the experiments by a digital camera with the assistance of a stroboscopic flash diode. The measured inter-droplet distance was 0.368 mm which consequently resulted in a droplet diameter of m from Eq. (3). This is also consistent with the measured value of the ratio , when the droplets are just detached from the jet.
The droplet velocity is deduced from , where is the driving frequency of the transducer. For our case we find m/s. The observed relative velocity decrease for droplets is measured to be about , comparing droplets just detached from the jet to those close to the inlet of the vacuum injection capillary.
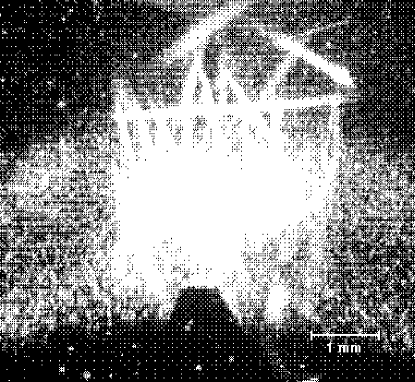
From experimental observations we know that the micro-spheres are in liquid phase at the inlet of the vacuum injection capillary and completely frozen at the skimmer. The latter conclusion comes from observing the micro-spheres that do not pass to really rebounce like billiard balls, i.e. solid objects, as indicated in Fig. 4. The first conclusion arises from tilting the droplet train to hit the capillary inlet. In this case we do not observe the “egg shells” as described in Ref. [9] which should have been the result if the micro-spheres been partially frozen. To conclude our observations, the micro-spheres must freeze somewhere in between the inlet of the vacuum injection capillary and the skimmer.
The calculations (see Fig. 6) show that the hydrogen droplets are cooled down so fast by evaporative cooling that a solid micro-sphere (pellet) or at least a solid shell at the droplet surface could be formed at the exit of the droplet formation chamber (inlet of vacuum injection capillary). Clearly a phenomenon called supercooling is inevitably encountered, as has been mentioned before but not examined in greater detail [1]. It is still not clear how much of the pellet beam divergence is ascribed to the supercooling, but as mentioned the pellet survival rate may be deeply affected by this phenomenon.
The gas flow in the vacuum injection capillary will be “choked” due to the large pressure difference in the DFC and the vacuum chamber. The droplet carried by the gas flow will endure a drag force given by Eq. (5) and as a result the droplet will be accelerated. We have experimentally measured the average pellet velocity of hydrogen from the pictures of the pellets just after the vacuum injection capillary. For this particular run, the average over 52 distances together with the transducer frequency resulted in a pellet velocity of m/s. For other runs, the typical values range from m/s to m/s dependent on the pressure in the DFC and the driving pressure of hydrogen gas to the nozzle. At the moment the distribution of the pellet velocity is unknown, but we will report on these experiments in a forthcoming paper.
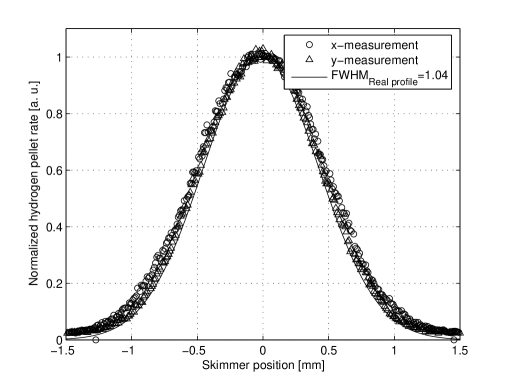
A crucial topic originating from the vacuum injection is the pellet beam divergence which causes about 80 percent of the produced hydrogen pellets to be skimmed off because of their too large angular spread, i.e. most of them never reach the interaction point. The origin of this type of divergence is not known in detail [10].
Pellet beam profiles measurements were carried out by step-wise moving the pellet beam over the skimmer aperture while counting the ones that pass. The results are shown in Fig. 5. A priori the shape of the uncollimated beam, i.e. before the skimmer, is unknown. However, by fitting several test-functions to the experimental results a Gaussian shape reproduces the measured values the best. Since the size of the pellet beam is similar to the skimmer diameter, the convolution between the two becomes important. We assumed the uncollimated beam to be a symmetric Gaussian, and by fitting its convoluted result to the experimental measurements the “real” pellet beam profile, with a FWHM of mm, was obtained.
From comparing the total number of pellets in the uncollimated beam to the transducer frequency, a survival ratio of 50% was deduced. This rather low number is also supported from the photos taken just below the vacuum injection capillary. They indeed show that the inter-pellet distance is sometimes twice the distance of others. Thus a pellet in such a case is “missing”.
4 Interpretation of the results
4.1 Droplet formation
It is well known that pressurized liquid ejected from a nozzle will form a jet. A cylinder of jet is dynamically unstable under the action of surface tension. When a vibration of a certain frequency is applied to the nozzle the corresponding wavelength will force the jet to disintegrate into a stream of uniform-sized droplets. From Lord Rayleigh’s analysis the disturbance to the shape of the droplets grows most rapidly at an approximate wavelength of , where is the diameter of the jet [11, 12]. In our case the working frequency has to be set at a much lower frequency than this optimal one to avoid the coalescence effect causing clustering in the high-frequency mode. We have observed experimentally, like others [13] also have, that satellite droplets are inevitably formed accompanying the main droplets, quite independent of the experimental configuration. However, we can tune the transducer frequency slightly so that the satellite droplets could merge into the main droplets as quickly as possible due to their different velocities. For details of the nozzle unit, see Fig. 2.
4.1.1 Droplet size determination
To determine the droplet size one needs to know the jet diameter. However, the small jet size for a 12-m nozzle in a cryogenic environment is difficult to be measured directly. We apply fluid dynamics to overcome this problem.
In fluid dynamics the Reynolds number, defined as , is used to distinguish between different types of flows. Here, is the density of liquid hydrogen, is the fluid velocity, and is the dynamic viscosity. When the flow is always laminar, and when it is always turbulent [10]. For a m inner-diameter nozzle we get for hydrogen, which means that in order to have a laminar flow the hydrogen fluid must have a velocity m/s. This is indeed the case, because of the discussion in Sec. 4.1.2, resulting in a Reynolds number of about 1000.
Most of the pressure drop between the driving pressure and the much lower pressure in the droplet formation chamber will take place near the exit of the nozzle, where the narrowing of the pipe system becomes significant.
Using the equations of continuity and momentum conservation, we can easily find that for laminar flow the mean velocity of the liquid fluid inside the nozzle () and the velocity of jet () are related as [14]
| (1) |
The corresponding relationship between the diameter of the fluid inside the nozzle and the diameter of the jet is given by
| (2) |
To summarize: for the present nozzle with a 12-m inner diameter we expect a laminar flow inside the nozzle and the jet size to be m.
It has been further derived that in turbulent flow case the ratio between the diameter of the jet and inner diameter of nozzle () will be less than if we solve the momentum-conservation equation with the velocity distribution of turbulent flow. This could explain why the experimental measured values of this ratio by other authors are somewhat smaller (e.g. a value of approximately 0.80 was given by Ref. [15]).
The unstable jet will break up into droplets due to the acoustic excitation. After the satellite droplets merge into the main droplet, the volume conservation gives [15]
| (3) |
where is the droplet diameter, and is the wavelength jet turbulence, equivalent to the distance between the neighboring droplets. From our measured mm we got m.
4.1.2 Droplet velocity evolution
When the droplet is detached from the jet, an extra force will be exerted by the surface tension, , which pulls the fluid back towards the nozzle. This excess pressure integrated over the cross section of the jet is . The momentum conservation gives [16]
| (4) |
where is the droplet velocity, and is the surface tension of hydrogen liquid.
Now that the droplet velocity was m/s, we can trace back to the jet velocity and obtain m/s. Recalling the relationship between the jet velocity and the fluid velocity inside the nozzle, Eq. (1), numerically, the fluid velocity at the exit of the nozzle was m/s, thus less than m/s to fulfil the requirements of laminar flow (see Sec. 4.1.1).
When the droplet travels in the surrounding of gas mixture, the gas actually acts as a viscous fluid and exert a frictional drag force on it. For an isolated spherical droplet, based on Newton’s resistance law, the general expression for the drag force in a gas surrounding can be written as [17]
| (5) |
Here is the drag factor, which has different forms for different regions of the Reynolds number of the droplet, . Further, is the gas density, is the gas viscosity, is Cunningham non-continuum correction (which is almost 1.0 in our case because we are working in the continuum region, see Sec. 4.1.3), is the cross sectional area of the droplet, i.e. , and is the relative velocity between the droplet and the surrounding gas. Since the gas in the droplet formation chamber can only be pumped away via a mm narrow vacuum injection capillary, this limits gas flow such that the resulted bulk gas velocity in the droplet formation chamber is insignificantly small. Therefore the background gas in the DFC could be assumed as stagnant and the relative velocity to equal the droplet velocity . It should be kept in mind that the surrounding gas is actually a mixture of hydrogen vapor and helium gas, and the density is the linear combination of specific volumes, while the viscosity is deduced according to the summing rule of Wilke [18].
For a hydrogen droplet with a velocity of m/s, the Reynolds number is =34.4. Relevant values for the background H2-He gas at K were calculated to kg/m3 and Pa s. The hydrogen data for this calculation were taken from Ref. [6]. The drag factor equation suitable for a Reynolds number region of is described as [17]
| (6) |
This will result in a drag force of about 3000 higher than the gravitational force exerted on a droplet. Thus the gravity can be omitted and the dynamic equation for the droplet can then be written as [17]
| (7) |
When the droplet passes through the DFC its diameter changes very little, so as a first order of estimation we can assume that the droplet diameter is constant. The numerical calculations of Eq. (7) show that the relative velocity loss () will be 16% when the droplet has travelled an available mm distance inside the DFC (assuming the jet length in Fig. 1 to be mm). Here is the initial droplet velocity (m/s). The observed relative velocity loss for droplets is only about from the photos, which is just one-third of the above value for an isolated droplet. The difference may be explained by the effect of inter-droplet interactions within the droplet train, which means that a succeeding droplet in the wake of a proceeding droplet will endure less drag force [19]. Further effects of the inter-droplet interaction will be discussed in the next section.
4.1.3 Thermodynamic behavior of the droplet
The mass loss due to evaporation and the connected temperature development of the droplet can only be achieved by solving the appropriate thermodynamic equations of the droplet in the DFC. Many theoretical models exist to describe the heat and mass transfer processes from micro-droplets [20, 21] to the surrounding for single isolated droplets. However, these models are of limited benefit in the case of a droplet train where the inter-droplet separation distance is so small that droplet-droplet interactions become significant. The intensity of interactions can be defined in terms of an interaction parameter which is the ratio between the rate of a transfer process from a droplet in an array compared to that from a single isolated droplet. Because the heat and mass transfer behave very similar, we can reasonably assume that the interaction parameters for heat and mass transfer rates are equal, and defined as [22]
| (8) |
which is the ratio between the mass loss of a droplet in a linear array (train) relative to that from a single isolated droplet. The parameter depends only on the dimension-less spacing between the droplets which is defined as , where is the droplet radius. From other experiments it has been reported that the inter-droplet interactions are significant () for but negligible for [22, 23]. In our case , so we have assumed to be about .
Mass loss equation
Once a droplet is formed, we assume it to (i) represent all other droplets; (ii) be totally spherical; (iii) enter a uniform environment with respect to pressure and temperature; and (iv) be surrounded by its own evaporating gas in a quasi-steady equilibrium state at the liquid surface so that the gas pressure follows the saturation line [6]
| (9) |
where is given in Pa if the dimension of the surface temperature is K. The heat and mass transfer process depends on the degree of rarefaction for the system, which is represented by the dimensionless Knudsen number defined as [24]. Here, is the mean free path, i.e. the average distance between molecule collisions, and is the droplet diameter. The ambient gas is a mixture of helium and hydrogen, so in the simple kinetic gas theory (with the approximation of rigid spheres) the mean free path is [25]
| (10) |
where is Boltzmann’s constant, and Å and Å are the sphere diameters of helium and hydrogen molecules, respectively [26]. It is expected that m and . It is claimed in Ref. [24] that at the “diffusion-controlled continuum or near-continuum limit” the evaporation is best predicted by a diffusion-controlled model if the concentration of the inert gas is neither too large nor tending to zero when compared to the evaporated gas. In our case the partial pressures of helium and hydrogen are of the same order and hence a diffusion-controlled model should be adequate.
We can thus use Fick’s first law of diffusion, , to describe the movement of one chemical species through a binary mixture of and . Here, is the mass flux rate, the proportionality factor is the diffusion coefficient, and is the concentration gradient of . For a spherically symmetric geometry this diffusion equation can be expressed as [19, 21, 27]
| (11) |
where is the mass change, is the droplet surface area , is the droplet radius (), and and are the evaporated gas concentrations at and , respectively.
For a droplet train moving in the ideal gas mixture, Eq. (11) can further be expressed as
| (12) |
where is the specific gas constant for and, in turn, and corresponds to hydrogen and helium, respectively. Here, the assumption of a quasi-steady equilibrium give , given in Eq. (9). The diffusion coefficient of gas mixture can be deduced from the kinetic theory as shown in Ref. [25]. We have also inserted the earlier discussed -factor to take inter-droplet effects into account.
Since the droplet is non-stationary the mass transfer must be multiplied by a factor, the Sherwood number, due to the forced convection. Under the assumption of a negligible internal circulation inside the droplet, as has been experimentally investigated in a similar setup and concluded to be reasonable [28], the Sherwood number for mass transfer is given by [29]
| (13) |
where the Schmidt number, , is estimated for the gas mixture.
Heat balance equation
Inside a droplet the temperature profile is given by [19]
| (14) |
for and where , , and are the density, the heat capacity and the thermal conductivity of the droplet, respectively. is the droplet temperature at the radial position , at time . Eq. (14) applies with the boundary conditions
| (15) | |||||
| (16) |
where the subscripts and , respectively, denote surface and center.
Droplet temperature results
With these mass and heat transfer equations, the behavior of the hydrogen droplet can be obtained using an updated program version with the numerical iteration method as used earlier in Ref. [30]. With an initial droplet diameter of m, a velocity of m/s, and a temperature of K, we see in Fig. 6 the droplet temperature evolution in the DFC for different cases. Our ambient pressure was mbar with a partial hydrogen pressure of mbar. The background gas temperature was assumed to be K, however, the variation of this value was shown to be negligible. To simplify the calculation, the density change which takes place at the transition between the liquid and solid phase (about ), was neglected and instead an average value was used.
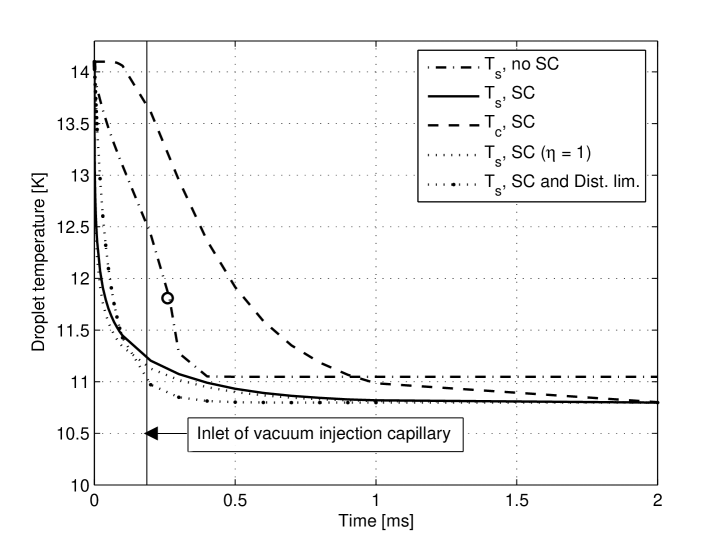
When no supercooling occurs, liquid hydrogen transforms to solid at K and this happens for the surface of the droplet already after s. Assuming a smooth inward-directed freezing process, the whole micro-sphere would turn solid at ms corresponding to a flight path of mm about mm into the vacuum injection capillary. This does not correspond to our experimental observations, because before a solid pellet is formed the micro-sphere should be partially frozen and thus fragments of frozen hydrogen should be visible if the nozzle and thereby the droplet train is tilted to hit the capillary inlet. Those fragments have never been observed and therefore we conclude that an additional mechanism must be present. One distinct possibility is the presence of supercooling resulting in the corresponding temperature lines in Fig. 6. To simulate supercooling for the hydrogen droplet, we have assumed that all thermodynamic parameters of liquid hydrogen can be extrapolated to the temperatures lower than the normal melting temperature. If not stated otherwise, the droplet train effect is and the number of layers, to account for the radial temperature distribution from Eq. (14), is 50. We see that changing to 1.0 (no effect) make almost no difference. More surprisingly is, maybe, the small difference between the droplet with constant temperature distribution (distillation limit model) and the finite-conductivity model as described above.
Nucleation rate of hydrogen
Generally, the reason for supercooling is that the crystallization has no place to take root and the molecular motion prevents the substance from freezing. The temperature at which a droplet of volume will start to freeze, is determined by the relation [38, 39]
| (21) |
where is the number of nuclei and is the temperature change. The time dependence from the latter makes it possible to find a corresponding static formula,
| (22) |
where is the lifetime of the supercooled droplet before freezing. Eq. (22) has been experimentally investigated for parahydrogen (p-H2) and, to some extent, also normal hydrogen (n-H2) [32, 34]. They measured and to obtain the nucleation rate , in an helium environment of bar. Our case a comparable low ambient pressure, mbar, and we will therefore neglect this effect such that the theory of classical nucleation rate can be used. Furthermore, we note that the nucleation temperature of interest is not too far away from the melting temperature, so by using the notation of Ref. [33], we get
| (23) |
with
| (24) |
and
| (25) |
for the case of parahydrogen. Here is Boltzmann’s constant, is Planck’s constant, is the number of molecules per unit volume in the liquid phase, is the activation energy for self-diffusion in the the liquid, is the maximum free energy required to form a small solid sphere in the liquid, is the liquid-solid surface free energy which was determined to be J/m2 (according to the best fit of experimental data [32]), is the number of molecules per unit volume in the solid phase, and and are, respectively, the free energies per molecule in the liquid and solid phases.
To turn back to normal hydrogen we use the results of Ref. [34] where it is pointed out that the nucleation rate for n-H2 was measured to be times higher than that of p-H2, possibly due to the “onset of rotational ordering in the solid phase”. From this and Eqs. (23), (24), and (25) the approximate nucleation rates for n-H2 can be obtained, see Tab. 1.
| K | cm-3s-1 | K | cm-3s-1 |
|---|---|---|---|
When nucleation occurs the latent heat of fusion is liberated, and the droplet warms up to the so-called recalescence arrest temperature [34, 35]. Eventually the heat stored in the droplet is exhausted, and it rapidly freezes to solid (pellet).
For a m-diameter droplet the volume is cm3. According to Eq. (22) and values from Tab. 1, the needed droplet temperature is K for the nucleation to start inside the DFC at about ms. As seen in Fig. 6 this temperature will never be reached, not even if the DFC was extended to several decimeters. In fact, the lowest droplet temperature of K corresponds to a nucleation rate which is 11 orders of magnitude to low for a nucleation trigger. Given that the nucleation rate may have a large uncertainty, this huge order anyway points to that freezing in the DFC is impossible because the droplet is not “supercooled enough” to experience a phase transition to solid. Besides, if we consider the supercooling-case for the droplet center and surface temperature, respectively, i.e. the dashed and solid lines in Fig. 6, at the correspondent time for the inlet of the vacuum injection capillary, we actually have K and K. That is greater than K and thus an even lower nucleation rate.
In the calculations we have changed all related working parameters, such as the vapor pressure, the background gas pressure, and the background gas temperature. It is found that only when the pressures of vapor and background gas have been decreased to as low as mbar and mbar, respectively, the droplet can finally reach K in the DFC. This will however be very hard to achieve experimentally since the hydrogen vapor pressure results from the evaporation mechanism itself and the pumping power in the DFC is limited by the narrow vacuum injection capillary.
To trigger the nucleation and thereby the freezing other means are needed. A controlled introduction of impurities might be the solution, e.g. as mentioned in Ref. [32] by heating a fine tungsten filament such that impurities at the surface are boiled off to imply a heterogenous crystallization. Or, maybe supersonic excitation can be used to decrease the degree of supercooling even further [36], and thereby increase the nucleation rate.
4.2 Pellet evaporation
Consider the possibility that the micro-spheres are still in liquid phase after they have passed the vacuum injection capillary. Using liquid parameters in the equations to come, it turns out that the droplet will reach a temperature well below K within ms, almost independent of chosen diameter or initial temperature. From the discussions on nucleation rate we thus conclude that if the droplet does not transform to a pellet inside the vacuum injection capillary, it will do that within some centimeters afterwards. Therefore all equations in vacuum are subscripted for pellets.
In vacuum the pellet will evaporate in the molecular flow regime (), and the evaporation rate is given by the (classical) Hertz–Knudsen formula. However, a revised version also takes the bulk velocity of the vapor in vacuum into account [37], such that
| (26) |
where the solid-vapor saturation pressure follows [6]
| (27) |
The main heat source in the vacuum chamber, i.e. after the injection capillary, is the thermal radiation from the walls of the vacuum pipe. The pellets are exposed to the wall surface with a temperature of about K. On the basis of the Stefan–Boltzmann law combined with Kirchhoff’s law, the thermal radiation can be written as
| (28) |
where is the emissivity of the pellet (assumed to be 0.5), is the Stefan–Bolzmann constant (Wm-2K-4), is the pipe-wall temperature (K), and is the surface temperature of the pellet.
At the pellet surface, the energy balance gives
| (29) |
where is the thermal conductivity of the pellet and is the latent heat of sublimation. The energy balance equation inside the pellet is the same with that in the droplet formation chamber, i.e. Eq. (14) with the boundary conditions Eqs. (15) and (16), but for which all involved parameters should be interchanged to those of solid hydrogen.
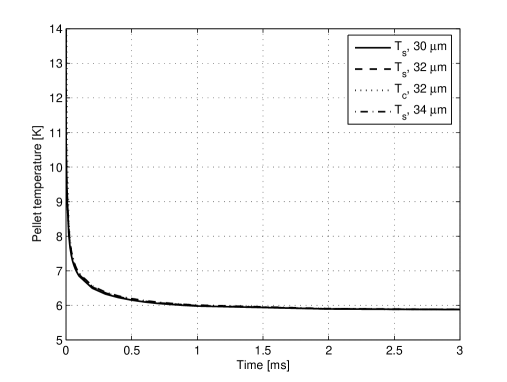
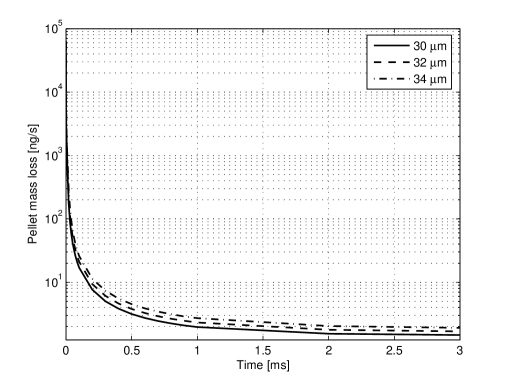
Once the pellet is formed, we can assume that the initial temperature of the pellet will be equal to the triple point temperature K when they are just consolidated from supercooled droplets. Of course other values are in principle possible, but due to the rapid temperature decrease the chosen temperature is really not of importance. The mass loss and temperature evolution can be calculated by solving the mass transfer and heat balance, i.e. Eqs. (14), (26), and (29). The results are shown below in Figs. 7 and 8. It turns out that pellets will cool down to about K within cm of travel in the vacuum chamber. As seen the lines overlap for the different cases. The relative mass loss during this process is about 14%. After that, i.e. on the way down to the skimmer and further to the interaction point, the pellet mass loss rate will be maintained at a rather low constant value. This is very important for a pellet target operation inside the vacuum of a storage ring which should not be spoiled.
| Initial diameter | ms | ms | ms |
|---|---|---|---|
| m | ng/s | ng/s | ng/s |
5 Summary
We have described how uniform spaced and sized droplets are formed in the droplet formation chamber by an acoustical excitation method. From experimental observations we know that the micro-spheres are in liquid phase at the inlet of the vacuum injection capillary and completely frozen at the skimmer. Thus they must freeze in between. In the absence of supercooling the calculations show that they would be only partially frozen at the capillary inlet, in contradiction to the observations. However, with supercooling present the experimental observations can be explained. Our calculations show that the nucleation rate is 11 orders of magnitude too low to trigger a pellet freezing at all. It is desirable to achieve frozen pellets within the DFC, and therefore the introduction of impurities or the usage of supersonic excitation should be considered. The expected advantage of pellets formed at an earlier stage is an improvement of the survival ratio, and thus better working conditions for a pellet target.
The total relative mass loss from the formation of droplets to pellets in the reaction chamber is estimated to be 30%, corresponding to a % decrease in diameter. The pellet size itself is actually further decreased due to the density change for hydrogen from liquid to solid. As for an original droplet with a diameter of m, the final pellet size is expected to be about m.
With the current setup, the droplets freeze to pellets either in the vacuum injection capillary or a few centimeters afterwards. In either case, the pellet equilibrium temperature of about K is reached within cm after the capillary. Our calculations show that the mass loss has converged to an almost constant value at this point. The mass loss results in an unwanted gas load. Most of the gas load will come from the mass lost during those cm as well as from the skimmed off pellets eventually breaking up and evaporating in the vacuum chamber above. However, this gas load can be pumped away by appropriate vacuum pumps before and after the skimmer. Thus the gas load to consider for the vacuum system of the storage ring in which the target is installed, really originates from the converged value of the mass loss. For our pellet target this mass loss is between and ng/s per pellet.
References
- [1] B. Trostell, Nucl. Instr. and Meth. in Phys. Res. A 362 (1995) 41.
- [2] C. Ekström, Nucl. Instr. and Meth. in Phys. Res. A 362 (1995) 1.
- [3] C. Ekström and the CELSIUS/WASA collaboration, Physica Scripta T 99 (2002) 169.
- [4] PANDA collaboration, Letter of Intent for: PANDA, 2004.
- [5] C. Ekström et al., Nucl. Instr. and Meth. in Phys. Res. A 371 (1996) 572.
- [6] P. C. Souers, Hydrogen Properties for Fusion Energy (University of California Press, Ltd., 1986).
- [7] A. R. Hanson, E. G. Domich and H. S. Adams, Phys. Fluids 6 (1963) 1070.
- [8] E. Y. Harper, G. W. Grube and I.-D. Chang, J. Fluid Mech. 52 (1972) 565.
- [9] C. A. Foster et al., Rev. Sci. Instrum. 48 (1977) 625.
- [10] H. O. Meyer et al., Nucl. Instr. and Meth. A295 (1990) 53.
- [11] Lord Rayleigh, Proc. London Math. Soc. 10 (1879) 4.
- [12] J.M. Schneider and C.D. Hendricks, Rev. Sci. Instr. 35 (1964) 1349.
- [13] W. T. Pimbley and H. C. Lee, IBM J. Res. Dev. 21 (1977) 21.
- [14] D. B. Harmon, Jr., J. Franklin Institute 259, (1955) 519.
- [15] N. R. Lindblad and J. M. Schneider, J. Sci. Instrum. 42 (1965) 635.
- [16] J. Edders, Rev. Mod. Phys. 69 (1997) 865.
- [17] J. Yang, R. Jaenicke, V. Dreiling and T. Peter, J. Aerosol Sci. 31 (2000) 773.
- [18] C. R. Wilke, J. Chem. Phys. 18 (1950) 517.
- [19] V. Devarakonda and A. K. Ray, Aero. Sci. 34 (2003) 837.
- [20] R. S. Miller, K. Harstad and J. Bellan, Int. J. of Multiphase flow 24 (1998) 1025.
- [21] H. T. Shin, Y. P. Lee and J. Jurng, Applied Thermal Engineering 20 (2000) 439.
- [22] H. Moritz and G. Schweiger, Chem. Eng. Technol. 23(2000) 4.
- [23] V. Devarakonda, PH. D. Thesis, University of Kentucky, Lexington KY, USA, 1998.
- [24] J. B. Young, Int. J. of Heat and Mass Transfer 36 (1993) 2941.
- [25] R. B. Bird, W. E. Steward and E. N. Lightfoot, Transport Phenomena, John Wiley Sons Inc., USA, 2nd edition (2002).
- [26] R. B. Lide et al., Handbook of Chemistry and Physics, CRC Press LLC, 83rd (web-) edition (2003).
- [27] A. V. Kozyrev and A. G. Sitnikov, Physics–Uspekhi 44 (2001) 725.
- [28] D. R. Worsnop, Q. Shi, J. T. Jayne et al., Aero. Sci. 32 (2001) 877.
- [29] M. Renksizbulut, R. Nafziger and X. Li, Chem. Eng. Sci. 46 (1991) 2351.
- [30] B. Trostell, Proc. 1st Europ. Particle Accelerator Conf., Rome, 1988 In S. Tarrazi, editor, (World Scientific, Singapore, 1989) 1424.
- [31] V. D. Arp, R. D. McCarty and D. G. Friend, NIST Technical Note 1334 (revised), USA, (1998).
- [32] G. M. Seidel et al. , Phys. Rev. Lett. 56 (1986) 2380.
- [33] H. J. Maris, G. M. Seidel, and T. E. Huber, J. of Low Temp. Phys. 51 (1983) 471.
- [34] H. J. Maris, G. M. Seidel, and F. I. B. Williams, Phys. Rev. B 36 (1987) 6799.
- [35] P. Mathur, D. Apelian and A. Lawley, Acta Metallurgica 37 (1989) 429.
- [36] T. Inada, X. Zhang, A. Yabe and Y. Kozawa, Int. J. of Heat and Mass Transfer 44 (2001) 4523.
- [37] T. Ytrehus and S. stmo, Int. J. Multiphase Flow 22 (1996) 133.
- [38] J. P. Hirth, Metall. Transactions A 9 (1978) 401.
- [39] D. Bergmann et al., Int. J. Therm. Sci. 39 (2000) 53.