Characterization of Etched Glass Surfaces by Wave Scattering
Abstract
The roughness of glass surfaces after different stages of etching is investigated by reflection measurements with a spectrophotometer, light scattering, and atomic-force microscopy (in small scale), and Talysurf (in large scale). The results suggest, there are three regimes during etching, according to their optical reflectivity and roughness. The first and second regimes are studied by the Kirchhoff theory and the third one is studied by the geometric theory. Also, we compare the roughness obtained by the optical scattering to the AFM results.
Keywords: Etching, Scattering, Roughness
1 Introduction
The technology of micro fabrication of glass is gaining in importance because more and more glass substrates are currently being used to fabricate micro electro mechanical system (MEMS) devices [1]. Glass has many advantages as a material for MEMS applications, such as good mechanical and optical properties, high electrical insulators, and it can be easily bonded to silicon substrates at temperatures lower than for fusion bonding [2]. Also micro and nano-structuring of glass surfaces is important for the production of many components and systems such as gratings, diffractive optical elements, planar wave guide devices, micro-fluidic channels and substrates for (bio) chemical lab-one-chip applications [3, 4], although wet etching is well developed for some of these applications [5, 6]. There are different ways to enhance the efficiency of some optical devices such as semiconductors lasers, solar cells etc. One of possible ways is light is allowed to have more reaction with material in which is propagated. Consequently the surface boundaries, need to be roughened. In planar wave guides on the other hand the surface boundaries have to be as smooth as possible to have good light confinement [7, 8]. To get reliable surface roughness, it has to be employed non-expensive and nondestructive method to measure their roughness. In recent years, AFM has become available tool for studying microstructure changes in material science. This technique enables us to measure and describe the shape material surface with minimal sample preparation [9, 10, 11]. Although this is a precise technique, it is an expensive and difficult method. Also we may only investigate very small surfaces by this technique. Study of wave scattering from self-affine (fractal) surfaces has become very active; see for example references [12-19]. Because scattering of light from random rough surfaces is a subject of great interest, both from a theoretical point of view and for applications, a large number of papers have been devoted to the subject. The measurement of light scattering at rough surfaces and its relationship with the statistical parameters and functions describe the surface roughness and correlation length. This technique enables us to measure roughness of large area.
(a) 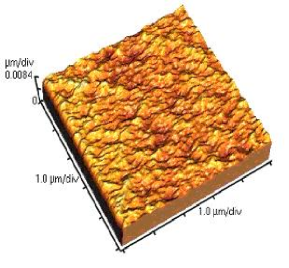
 (b)
(b)
(c) 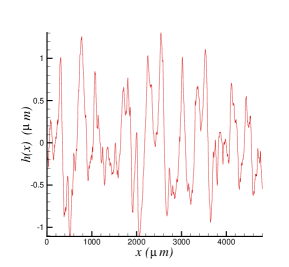
 (d)
(d)
2 Experiments
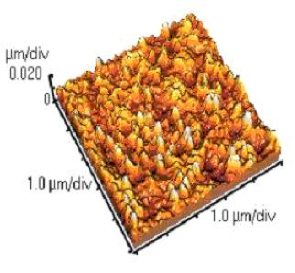
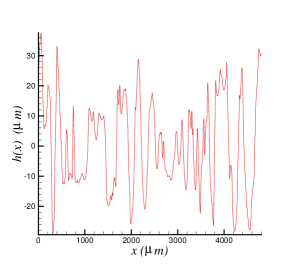
We started with glass microscope slides as a sample. Only one side of samples was etched by HF solution for various etching times, to minutes, after cleaning by proper detergents. HF concentration was for all experiments. The scattered light intensity of samples was measured as a function of angle, using a setup consisting of a He-Ne laser (), a photo-multiplier tube (PMT) detector and a computer controlled micro-stepper rotation stage. The resolution of the micro-stepper was minutes per step. The surface topography of the etched glass samples in small scale ( was obtained using an atomic force microscope (AFM) (Park Scientific Instruments). The images in small scale were collected in a constant force mode and digitized into pixels. A commercial standard pyramidal tip was used. A variety of scans, each with size , were recorded at random locations on the surface. The large scale () morphology line scans of the samples were recorded using a surface profile-meter (Taylor Hobson). Fig. 1 shows typical AFM image and surface profile data with resolutions of about and , respectively. In order to directly characterize different samples, we also used the Jascow spectrophotometer. In Fig. 2 an illustration of the effect of the etching time on the specular reflectivity measurement is presented. The reflectivity is normalized to the smooth glass , and represented as a function of wavelength and etching time. As the etching time increases, approaches to zero.
3 Theory
3.1 General notations
It is known that to derive the quantitative information of the surface morphology one may consider a sample of size and define the mean height of the etching surfaces and its roughness by [20]:
| (1) |
Here is etching time, that is a factor which can apply to control the glass surface roughness, and the denotes an averaging over different samples. In this work, we study the statistical parameters of the surfaces. One of the possible initial conditions is assuming to have a flat interface and the correlation function of the rough surface is denoted by :
| (2) |
and the correlation length , is a distance at which the correlation function falls by .
4 Kirchhoff’s expressions for reflection
Kirchhoff theory, also known as tangent plane or physical optics theory is the most widely used in the study of wave scattering from rough surfaces [21]. Kirchhoff theory has been applied to the study of One and two dimensional exact approaches have been successfully applied to dielectric, metallic or perfectly conducting surfaces [22, 23] dielectric films on a glass substrate [24] and dielectric films [25, 26]. Such exact calculations have been compared with experimental results and approximate models [24, 27]. Also some authors studied wave scattering from random layers with rough interfaces [28, 29].
The Kirchhoff theory is based on three major assumptions: a) The surface is observed from far field. b) The surface is regarded as flat, and the optical behavior is locally identical to any given point on the surface. Therefore the Fresnel laws can be locally applied. c) The amplitude of the reflection coefficient, is independent of the position on the rough surface. The field scattered by the rough surface, , considering far field approximation is obtained by integration over the mean reference plane : (the geometry is displayed in Figure 3)
| (3) | |||
| (4) |
where
| (5) | |||||
| (6) | |||||
| (7) | |||||
| (8) | |||||
| (9) | |||||
| (10) |
In the derivation of the Eq. (2), it is assumed that the incident wave is a plane wave with a wave vector as . The height distribution function (PDF) and correlation function of surfaces, which we used are Gaussian. It is shown that for such surfaces the total scattered intensity can be written as [21]:
| (11) |
Where and are the scattered from a smooth surface and the
diffuse intensity respectively and can be written as: .
Therefore, we may divide them into three domains depends on the
value of as below:
(a) Slightly rough surfaces:
When the wave length is long enough compared to or , the diffuse reflectance may be neglected. Therefore in specular direction the average intensity is [21]:
| (12) |
where is an angular factor given by:
b) Intermediate roughness surface
Surfaces for which are regarded as moderately rough. For this case, it can be provided an upper and lower bound to the diffuse field intensity as [21]:
| (13) |
where is the mean area of the scattering surface.
c) Very rough surfaces
To obtain a solution in this limit i.e. when , we used the total scattered field rather than the diffuse field[21]. For a Gaussian correlation function, the diffuse field leads to:
| (14) |
For very rough surfaces the coherent field will be negligible and Eq. (7) may be taken to give the diffuse or total field from the scattering surfaces.
5 Results and Discussion
Referring to Fig. 2, it can be seen that as the etching time increases the specular reflection of the samples are decreased. This depends on the surface roughness of the samples. It has been shown that the parameter, Eq. (6), of the samples less than minutes etching time are very less than unity, whereas for the samples with around minutes etching time, is almost equal to one, and for those with and minutes etching time is very larger than unity which are compatible with predicted domains by the Kirchhoff theory. But the results of etched samples larger than about minutes, cannot be explained by this theory. In this regime, geometric properties of light are more dominant than its wave properties. The scattered intensity as a function of scattered angle of some samples has been appeared on Fig. 4. It can be seen that, as it is expected, the etching time of glass, affects on the intensity of scattered light. To calculate the surface roughness, , and correlation length, , of the samples in the three regimes we used the data from AFM and Talysurf. As it is known the resolution of the information from AFM is between few nanometers to several micrometers, so for the samples with larger surface roughness we had to use the data from Talysurf. In Fig. 1, the illustration of the effect of etching time on the surface morphology from AFM and Talysurf are presented. These figures exhibit an increasing of surface roughness due to an increasing of etching time. To compare the results from AFM and Talysurf with those calculated using the light scattering for the three mentioned regimes, we list following results:
a) In the regime 1, for the samples with etching time less than minutes, Eq. (7) was used to calculate . Fig. 5 shows the comparison of the surface roughness determined by AFM experiments and the one obtained by the Kirchhoff theory. According to this figure, the surface roughness is almost a linear function of etching time of glass samples in a log-log coordinate for both data obtained from AFM and direct measurement of scattered intensity. The agreement between both groups of data for samples with etching time less than minutes is very good. At larger roughness, there are fairly disagreements between the theory and experiment, because scattering plays a role in larger roughness and affects the measured intensity in specular reflectance. If the surface roughness gets larger, the requirements of the first domain of the Kirchhoff theory do not hold any more, then the roughness from the reflection analysis and from AFM no longer agree because of the increasing role of scattering.
b) In the regime , for the intermediate and very rough surfaces , we are dealing with the samples with etching time around minutes, and - minutes, respectively. Figuer 6 demonstrate for different etching times of glass that calculated by Talysurf data. To compare the given data with the results from the Kirchhoff theory, both intermediate regime and very rough surface regime are compatible. Fig. 7 shows the comparison between scattering spectrum obtained from the Kirchhoff theory of a very rough surface and that which is obtained from the experiment corresponding an etching time of minutes.
c) In the regime , it was found that for the samples with etching time larger than minutes the surface roughness and the correlation length are quite larger than the wave length for which the limitations of the Kirchhoff theory hold and it cannot be used. So, it can be considered that the rough surface is covered by some local smooth surfaces (i.e. meshes) with the size , that these sizes are larger than the wave length. So, we used a theory based on geometric optics considerations. To describe the angular distribution of intensity of reflected light, we considered the angular distribution of the slope of rough surface, . To calculate , the data from Talysurf with resolution of in horizontal steps were used. Fig. 8 presents comparison of normalized scattering field intensities obtained from the Kirchhoff theory and the one‘obtained from an experiment with 70 minutes immersion. The agreement between geometric theory and experimental measurements is rather good.
The comparison between geometric reflection theory and experiment is shown on Fig. 11.
Summarizingly, we studied the glass etching process by the optical scattering and their statistical properties. By increasing the etching time for a series of the samples, we have studied optical scattering, identified by reflection measurements with a spectrophotometer and a setup discussed in experimental section. We found that these properties are explained by three regimes during etching. In the other view, statistical properties of their surfaces which are found by the AFM and Talysurf, confirm with these regimes. The roughness, which is obtained by the optical scattering, has a good agreement with the experimental results.
6 acknowledgment
we would like to thank M. Shirazi for her useful comments and discussions.
References
- [1] Won Ick Jang, Chang Auck Choi, Myung Lae Lee, Chi Hoon Jun and Youn Tae Kim, J. Micromech. Microeng. 12 (2002) 297 306.
- [2] M. Bu , T. Melvin a, G. J. Ensell, J. S. Wilkinson, A. G.R. Evans, Sensors and Actuators A 115:pp. 476-482 (2004).
- [3] M. Esashi, Microsyst. Technol. 1 (1994) 2
- [4] C. Pierrat, T. Siegrist, J. deMarco, L. Harriott, S. Vaidya, J. Vac. Sci. Technol. B 14 (1996) 63.
- [5] D.M. Knotter, J. Am. Chem. Soc. 122 (2000) 4345
- [6] G.A.C.M. Spierings, J. Mater. Sci. 28 (1993) 6261
- [7] R. Schuitema, et al, Light scattering at rough interfaces of thin film solar cells to improve the efficiency and stability, IEEE/ProRISC99, pp 399 - 404 (1999)
- [8] L. B. Glebov, et al, Photo induced chemical etching of silicate and borosilicate glasses, Glasstech. Ber. Glass Sci. Technol. 75 C2 pp 298-301 (2002)
- [9] K. D. Jandt, Master. Sci. Engng. R21 (1998) 221.
- [10] N. Silikas, k.E.R. England, D.C Wattes, K.D Jandt, J. Dentistry 27 (1999) 137.
- [11] K. Jandt, Biomaterials Science Probing the future, Transactions ADM, Experimental Measurement of Critical Biomaterials Properties, vol. 11,1998, p. 91.
- [12] D.L. Jaggard, X. Sun, J. Appl. Phys. 68 (11) (1990) 5456.
- [13] M.K. Shepard, R.A. Brackett, R.E. Arvidson, J. Geophys. Res. 100 (E6) (1995) 11709.
- [14] P.E. McSharry, P.J. Cullen, D. Moroney, J. Appl. Phys. 78(12) (1995) 6940.
- [15] N. Lin, H.P. Lee, S.P. Lim, K.S. Lee, J. Mod. Opt. 42(1995) 225.
- [16] J. Chen, T.K.Y. Lo, H. Leung, J. Litva, IEEE Trans. Geosci. 34 (4) (1996) 966.
- [17] C.J.R. Sheppard, Opt. Commun. 122 (1996) 178. [15] J.A. Sanchez Gil, J.V. Garc a Ramos, Waves Random Media 7 (1997) 285.
- [18] J. A. Sanchez Gil, J.V. Garc a Ramos, J. Chem. Phys. 108(1) (1998) 317.
- [19] Y.P. Zhao, C.F. Cheng, G.C. Wang, T.M. Lu, Surf. Sci. 409 (1998) L703.
- [20] M. Marsilli, A. Maritan, F. Toigoend, and J.R. Banavar, Rev. Mod. Phys. 68, 963 (1996)
- [21] J.A. Ogilvy, Theory of Wave Scattering from Random Rough Surfaces, Institute of Physics Publishing, Bristol and Philadelphia, 1991.
- [22] Kakuen Tang and Richard O. Buckius, Int. J. Heat Mass Transfer 14, 13 (1998).
- [23] Nieto-Vesperinas, M. and Sunchez-Gil, J. A., Journal of the Optical Society of America A 9, 424-436 (1992).
- [24] Z. H. Gu, J. Q. Lu, A. Martinez, E. R. Mendez and A.A. Maradudin, Optical Letters, 19, 604-606, (1994)
- [25] Ingve Simonsen, Tamara A. Leskova, and Alexei A. Maradudin, Physical reviwe B, Volum 63, 245411 (2001)
- [26] O. Calvo-Perez, J. J. Gre et and A. Sentenac,J. Opt. A: Pure Appl. Opt. 1 (1999) 560565. Printed in the UK.
- [27] Jerome Caron, Jacques Lafait and Christine Andraud, Optics Communications 207 (2002) 1728
- [28] Antoine Soubret and Gerard Berginc, arXiv: physics/0312133 v1 22 Dec (2003)
- [29] Antoine Soubret and Gerard Berginc, arXiv: physics/0312136 v1 22 Dec (2003)