Tel: +82-51-620-6354; Fax: +82-51-611-6357
Financial Networks in the Korean Stock Exchange Market
Abstract
We investigate the financial network in the Korean stock exchange
(KSE) market, using both numerical simulations and scaling
arguments. We estimate the cross-correlation on the stock price
exchanges of all companies listed on the the Korean stock exchange
market, where all companies are fully connected via weighted
links, by introducing a weighted random graph. The degree
distribution and the edge density are discussed numerically from
the market graph, and the statistical analysis for the degree
distribution of vertices is particularly
found to approximately follow the power law.
PACS: 87.18.Sn, 05.10.-a, 05.40.-a, 05.05.+q
Keywords: Cross-correlation, Degree distribution, Edge density
Recently, many interests have been concentrated on small-world and scale-free network models [1] in the physical, biological, social and technological networks. The small-world network, proposed by Watts and Strogatz [2], has provided the connected properties represented by single component graphs. The real-world models are indeed characterized by the small world and clustering property, e.g., social networks [3], the internet [4], document retrieval in www[5], scientific cooperation relations [6], social networks of acquaintances [7] and of collaborations [8]. The static and dynamic behaviors extensively have studied on small-world networks, and the prominent topics for small-world networks really have a direct application in statistical mechanics and polymer physics [9]. Until now, the financial market networks are extensively used in various types of financial applications [10].
Furthermore, the self-organized behavior of individuals, companies, capitalists, or nations has concentrated on forming macroscopic patterns such as commodity prices, stock prices, and exchange rates. There have existed many statistical quantities that play a crucial role in describing the properties and patterns of several options in financial markets. One of the most important quantities among them is the auto-correlation between companies. Until now, there have been many researches to estimate numerically the correlation in price changes, using the random matrix theory influenced on the collective behavior in financial markets .
Our purpose of this paper is to investigate the financial network in the KSE. We find the cross-correlation on the stock price exchanges of all companies listed on the Korean stock exchange market of 2003, and the degree distribution and the edge density are discussed from the market graph.
Let be the return of stock price defined by
| (1) |
where is the stock price of company at time , and is a time lag. Since the cross-correlation between individual stocks are represented in terms of a matrix , its correlation coefficient is calculated as
| (2) |
where the brackets denotes the time average over the transacted period. From Eq. (1), the corresponding correlation coefficient have one value between . If the coefficient , Two companies and are correlated (anti-correlated) if the coefficient , while they are uncorrelated if . It is well known the largest eigenvalue is non-degenerate and real, since the matrix is real and symmetric.
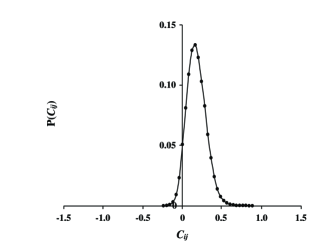
The market graph constitutes into the set of companies traded in the the KSE. We analyze daily tick data for the period Jan/-Dec/. First of all, as shown in Fig. , we found the distribution of correlation coefficients in Korean stock exchange market, where vary in the range from and .
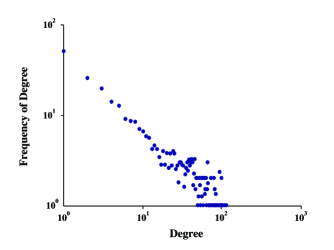
In order to discuss the degree distribution and the edge density in the market graph, we introduce as follows: The set of companies represent the set of vertices of the graph. For any pair of companies (vertices) and , An connected edge for any pair of companies (vertices) and is added to the market graph if the corresponding correlation coefficient is greater than or equal to a specified threshold value . The degree probability that a vertex of the market graph has a edge follows a power law as
| (3) |
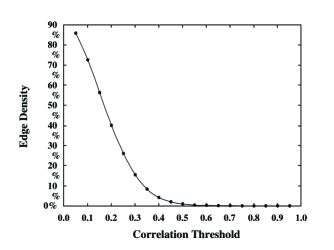
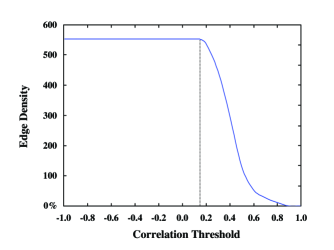
For the degree distribution, we found the results of computational simulation of our model with different threshold value. As the correlation threshold value is increased larger than , the degree distribution resembles a power law. It is shown by using least-squares method that the degree distributions of financial market network for , , and grow, respectively, as a power law with scaling exponents , (Fig. 2), and . We also found that the degree distribution in the range with and do not follow a power law, different to that of the recent work . In Fig. , The edge density as a function of different values of the correlation threshold in financial market networks is plotted in the range with . Fig. shows the largest connected edge density as a function of the correlation threshold value in financial market networks.
In conclusion, we have studied the market graph in the Korean stock exchange market and discussed the cross-correlation, the degree distribution, and the edge density on the stock price exchanges of all companies listed on the KSE of 2003. Especially, We found that the degree distributions for follow a power law. It is in future expected that the detail description of the market graph will be used to study the extension of financial analysis in the Korean and foreign financial markets.
Acknowledgements.
This work was supported by Korea Research Foundation Grant(KRF-2004-002-B00026).References
- (1) Albert and A.-L. Barabasi, Rev. Mod. Phys. 74, 47 (2002); S. N. Dorogovtsev and J. F. F. Mendes, Adv. Phys. 51, 1079 (2002); P. J. Kim and H. Jeong, J. Korean Phys. Soc. 44, 621 (2004); D.-H. Kim and H. Jeong, J. Korean Phys. Soc. 44, 624 (2004); D.-S. Lee, K.-I. Goh, B. Kahng and D. Kim, J. Korean Phys. Soc. 44, 633 (2004).
- (2) D. J. Watts and S. H. Strogatz, Nature 393, 440 (1998).
- (3) S. Milgram, Psychology Today 1, 61 (1967).
- (4) M. Faloutsos, P. Faloutsos and C. Faloutsos, Comput. Commmun. Rev. 29,251 (1999).
- (5) R. Albert, H. Jeong and A.-L. Barabasi, Nature 401, 130 (1999).
- (6) S. Redner, Eur. Phys. J. B. 4, 131(1998).
- (7) M. Kochen, The Small World (Ablex, Norwood, 1989).
- (8) M. E. J. Newman, Proc. Nat. Acad. Sci. 98, 404 (2001).
- (9) J. D. Noh and H. Rieger, Phys. Rev. Lett. 92, 118701 (2004); A. Scala, L. A. N. A. Amaral, A. Scala, M. Barthelemy, cond-mat/0004380; A. Scala, L. A. N. A. Amaral, A. Scala, M. Barthelemy and H. E. Stanley, cond-mat/0001458.
- (10) V. Boginski, S. Buutenko and P. M. Paralos, In Innovations in Financial and Economic networks, Edited by A. Nagurney (Cornwall, MPG Books , 2003) p.29-45.
- (11) L. Laloux, P. Cizeau, J.-P. Bouchaud and M. Potters, Phys. Rev. Lett. 83, 1467 (1999).
- (12) V. Plerou, P. Gopikrishnan, B. Rosenow, L. A. N. Amaral and H. E. Stanley, Phys. Rev. Lett. 83, 1471 (1999)
- (13) J. D. Noh, Phys. Rev. Lett. 61, 5981 (2000)
- (14) V. Boginski, S. Buutenko and P. M. Paralos, ” On Structural Properties of The Market graph,” In Innovations in Financial and Economic networks, Edited by A. Nagurney (Cornwall, MPG Books , 2003) p.29-45.