A Study of the Scintillation Induced by Alpha Particles and Gamma Rays in Liquid Xenon in an Electric Field
Abstract
Scintillation produced in liquid xenon by alpha particles and gamma rays has been studied as a function of applied electric field. For back scattered gamma rays with energy of about 200 keV, the number of scintillation photons was found to decrease by 642% with increasing field strength. Consequently, the pulse shape discrimination power between alpha particles and gamma rays is found to reduce with increasing field, but remaining non-zero at higher fields.
keywords:
liquid xenon , scintillation , pulse shape discriminationPACS:
29.40.Mc, , , , , , , , , , , , , ,
1 Introduction
There is much recent interest in xenon as a target for Weakly Interacting Massive Particle (WIMP) detectors. It has a high atomic mass of 131 amu, good for maximising the energy deposition from a WIMP collision. This is due to a close match between the nuclear mass and the most favoured WIMP mass according to SUSY models. Xenon is a scintillator, giving 52 photons/MeV for recoiling electrons in our energy range of interest [1, 2]. The emitted photons are VUV, from an emission band centred at 176.7 nm [3], which can be detected with photomultiplier tubes.
The observed scintillation pulse shape has a fast rise ( few ns) followed by an exponential-like decay. The decay time is indicative of the incident particle, allowing discrimination between gamma rays,alpha particles and nuclear recoils [4, 5]. This property is exploited by ZEPLIN I [6], the Boulby Dark Matter Collaboration’s liquid xenon dark matter detector. The scintillation pulse shape is used to differentiate between background gamma rays and recoiling nuclei produced by scattering WIMPs.
The next generation of xenon dark matter detectors are two-phase systems; ZEPLINs II [7] and III [8]. Such detectors measure both scintillation and ionisation produced by interacting particles separately. They comprise a liquid xenon target and gaseous xenon layer. An applied electric field removes electrons from the primary interaction site and extracts them into the gas phase. Whilst crossing the gas layer, the electrons have sufficient kinetic energy to excite the xenon gas atoms producing electroluminescence. VUV signals are produced by both the primary scintillation and the subsequent secondary electroluminesence. In a uniform electric field, the electroluminesence signal is directly proportional to the number of electrons removed from the interaction site. The ratio of primary to secondary signal sizes is used as a discrimination tool for the two-phase system.
This work presents a study of the scintillation signal, produced by alpha particles from an source and gamma rays from a source, as a function of applied electric field.
The VUV scintillation signal from liquid xenon is produced by the de-excitation to ground of the two lowest excited molecular states; and . These states can be produced initially through excitation, or via recombination [4]. The lifetimes of these states are found to be 4.3 0.6 ns and 22.0 2.0 ns for alpha particles [9] and 2.2 0.3 ns and 27 1 ns for recoiling electrons [4]. In addition, there is a long recombination time of 15 ns for recoiling electrons [4]. These effects are convoluted into a pulse shape that can be approximated as a single exponential decay. This is particulary true with low numbers of photons where the Poisson width blurs any distinction between the respective components. In this work, the overall decay profile for recoiling electrons has a measured mean time constant of 48.4 0.2 ns compared to 15.0 0.2 ns for alpha particles.
Under an electric field, the gamma ray induced (or recoiling electron) pulse shape and area changes. This is due to the removal of electrons from the interaction site, suppressing the recombination component of the scintillation [10]. Understanding the behaviour of gamma ray signals under an electric field is vital to two-phase xenon detectors in order to calibrate the energy scale, and estimate background contributions etc. To predict the primary and secondary signal sizes the number of electrons removed from a gamma ray interaction as a function of energy deposit and electric field strength is needed. For charge measurements, a linear relationship is observed between the inverse of the charge extraction and the inverse of the electric field [11, 12]. Using this functional form, the proportion of scintillation lost (or charge gained) can be found for an infinite electric field. In the work presented here, recombination is found to be responsible for 64 2 % of the total scintillation signal for gamma rays. Normalising by this quantity allows direct comparison between previous charge measurements. The proportion of the recombination component removed by the electric field, , is defined as 1 at an infinite electric field. The behaviour of the quantity () versus electric field () is dependent on the deposited gamma ray energy (). Charge measurement data of Voronova [13], with gamma ray energies of 15.3, 17.3, 21.4 and 662 keV, show this dependence. It is possible to parametrise their data as follows [14]:
| (1) |
where is the energy of the incident gamma ray in keV and is the electric field strength in kV/cm.
The gamma ray recombination component is suppressed by an applied electric field, causing the overall decay time of the scintillation pulse to reduce. The alpha particles pulse shapes show no discernable change with increasing the electric field strength up to 3.7 kV/cm. The gamma ray decay profile changes from a time constant of 48.4 0.2 ns with no electric field to 23.7 0.2 ns at 3.7 kV/cm. This change can be used in a diagnostic capacity in two phase detectors since gamma rays interacting in low electric field regions will present longer decay profiles. Such regions can be problematic in a two phase detector as interacting gamma rays may not suffer sufficient charge extraction to produce electroluminesence, or smaller electroluminesence signals may result. Whilst the gamma ray scintillation decay time is reduced by an electric field, under low fields it is still possible to discriminate between gamma rays and nuclear recoils using Pulse Shape Discrimination.
2 Experimental Setup
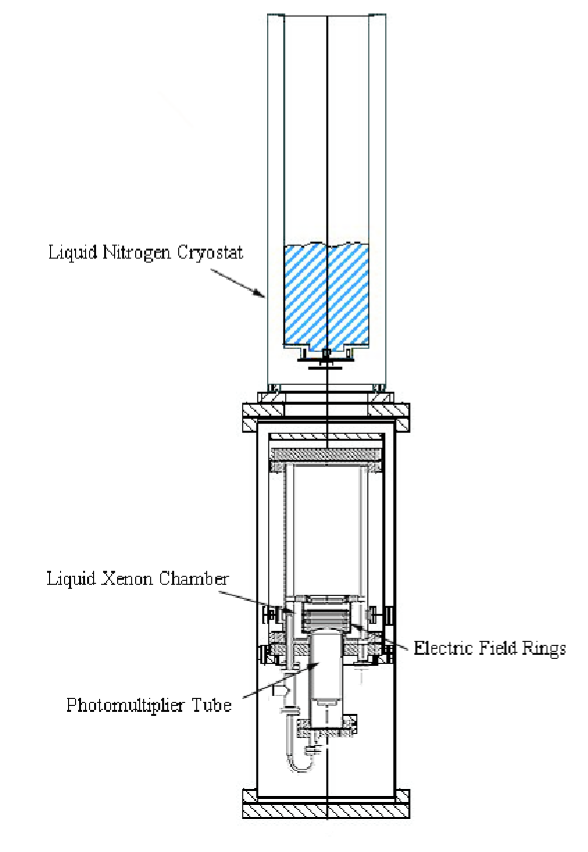
A prototype two phase liquid xenon dark matter detector was used for these studies, Figure 1. Inside the chamber is a photomultiplier tube immersed in liquid xenon, field shaping rings, two grids, an aluminium mirror (electrode) and a fixed internal source. The total xenon mass is 4.5 kg. The sensitive liquid xenon volume is defined by the field rings and for this experiment fills the structure to the mirror (top electrode). The field rings have an internal radius of 3 cm. Figure 2 is a diagram of the sensitive volume of the xenon chamber, showing the electric field rings, top electrode (mirror), high voltage grids and photocathode of photomultiplier tube. The source is fixed to the upper high voltage grid and sits upward facing inside a lead holder. Voltages are applied to the upper high voltage grid (-ve) and mirror (+ve), providing the drift field. The lower grid is kept at a low negative potential (- 0.2 kV) primarily to shield the photocathode from the high voltage grid. The photomultiplier tube is quartz windowed (ETL 9829B) with a photocathode quantum efficiency of 23 % at 175 nm [15].

2.1 Xenon Purity
In order to drift electrons for centimetres without loss through xenon requires high purity (parts per trillion): in particular, free of electronegative contaminants such as O2, N2O, CO2 and H2O. The scintillation is also affected by the presence of impurities (shortening the total attenuation length) but to a lesser extent (parts per billion).
Purification apparatus and procedures have been developed to remove contaminants [16]. All components of the inner chamber were constructed from stainless steel, copper, quartz or high purity ceramic, and designed for ultra-high vacuum use with residual pumped pressures below 10-8 mbar. The xenon was delivered to an Oxisorb cartridge [17] which removes O2 and H2O chemically. Xenon was distilled into the detector from a temperature controlled external bottle through a 0.5 m dust filter. This distillation procedure separates xenon from other trace impurities left solidified behind, particularly CO2, CH4 and H2O.
The xenon is kept cold via liquid nitrogen delivered to a cryostat directly above the main chamber. The chamber temperature is monitored at various locations, and with the use of heaters and a restrictive coupling the liquid temperature is actively maintained at -97∘C.
The purity of the xenon is assessed via the measurement of the free electron lifetime. To do this, potential differences are applied between the high voltage grid and top electrode causing free electrons released by background gamma and cosmic ray interactions and alphas from the internal source to drift towards the mirror. The electron drift is quantified with a calibrated charge sensitive amplifier (Amptek A250) connected to the top electrode (mirror). The outputed voltage is recorded as a function of time, triggered by the primary scintillation signal. The longest drift times are found to be in excess of 60 s across a 21.75 mm drift path [16], indicating a very high purity, without any measurable loss of charge even at fields below 10 V/cm.
2.2 Applied Electric Field
The electric field is produced by applying negative voltages to the upper high voltage grid and positive voltages to the top electrode. The total potential difference between the upper high voltage grid and top electrode ranged from 0 to 8 kV. The corresponding electric field distribution was modelled using the finite element analysis code, ANSYS [18].
3 Calibration
The calibration was made with no applied electric field. Initially the scintillation spectrum from the internal source was measured. The source is coated, producing alpha particles with a broad energy distribution peaking at 3.9 MeV. As the source is mounted in a lead source holder, the scintillation light produced by the alpha particles has no direct path to the phototube (maximum shadowing). Only light reflected by the mirror is seen. The peak of the alpha distribution contains 1900 photoelectrons as shown in Figure 3 (upper spectrum). The resulting spectrum produced by a GEANT 4 [19] simulation of the full detector and source is also shown (lower spectrum).
The source produces 60 keV gamma and X-rays, resulting in a peak at 180 photoelectrons. The low energy spectrum is shown in Figure 4 with the corresponding simulated spectrum. The 60 keV gamma rays are seen as 3 peaks; the uppermost ( 180 photoelectrons) giving direct light to the phototube from gamma rays passing sideways through the lead source holder, the lowermost ( 20 photoelectrons) from gamma rays emitted upwards being maximally shadowed by the source holder, and the intermediary structure resulting from partial shadowing and multiple interactions. Below these three peaks, lower energy gamma rays from (maximally shadowed) merge to form the rest of the low energy spectrum.
The upper 60 keV line results from events occuring less than 3 mm from the source, with most interactions occuring at a distance of 1 mm. These scintillation signals with no applied electric field, give a measured yield of 3 photoelectrons per keV. These interactions occur in the most efficient light collection region in the chamber, with the rest of the chamber being a factor 2.3 0.3 less efficient. The spectra were energy calibrated assuming 1.5 photoelectrons per keV.
Figure 5 is a spectrum from an external source after subtraction of the background spectrum from the internal source (Figure 3). Due to the amount of liquid xenon surrounding the sensitive region, the spectrum displays only one clear feature: a broad peak from gamma rays scattering at large angles in the external xenon volume and depositing 212 keV in the internal xenon volume. This feature was replicated in the simulation (lower plot).


4 Pulse Height Spectra Analysis
For each applied potential difference, pulse height spectra were recorded, both with and without the source. The background spectra (without the source) is predominantly from the internal souce, see Figure 3. The background spectra were subtracted from the source spectra to give the spectra. The position of the peak in each spectrum was determined. With the application of an electric field, the position of the peak moved to lower channels as a result of the scintillation signal area decreasing. Figure 6 shows the fraction of the scintillation signal removed () as a function of the applied electric field (). A straight line fit to the inverse of this quantity (), and the inverse of the electric field () was made, resulting in:
| (2) |


For an infinite electric field the percentage of signal removed by the electric field is equal to the inverse of the intercept, 64 2 %. Work by Kubota, with conversion electrons of energies 0.976 and 1.05 MeV, found a reduction fraction of 0.74 0.02 [12] at 12.7 kV/cm, significantly greater than found in this work. This suggests a variation in the mean electron creation energy We with recoiling electron energy.
The corresponding fraction of charge extracted as a function of the electric field is shown in Figure 7. Also shown are two trends from Equation 2. The lower dotted curve is for a gamma ray energy of 200 keV, and the upper curve is for an energy of 1 MeV. The line of best fit to the data lies at slightly higher energies than the 200 keV trend. The energies deposited by the large angle scatters peak at 212 keV, resulting in a faster increase in charge removal with increasing electric field strength. For energy deposits greater than 1 MeV, the trends are far less dependent on the energy deposit and all gamma rays behave in a similar manner; this is the maximal charge removal trend.
5 Scintillation Traces
Scintillation traces were recorded at each applied electric field strength. The photomultiplier voltage output was digitised by a Lecroy 7200 oscilloscope of 1 Gs/s at 500 MHz bandwidth, and recorded by computer with Labview DAQ software. A leading edge trigger provided the lower amplitude threshold of 0.1 V. The upper amplitude threshold was set to 0.9 V through DAQ software selection. As alpha and gamma ray signals have different pulse shapes the amplitude threshold settings select different energy ranges for alphas than for gamma rays. For gamma rays, the recorded event energies were between approximately 100 keV and 1 MeV with no applied electric field. Alpha events from the internal 241Am source have visible energies of between 50 keV and 400 keV. These alpha events are the lower energy tail of the alpha source energy distribution and the threshold settings used do not include the peak of the spectrum (see Figure 3). The recorded traces were analysed through software, returning maximum amplitudes (pulse amplitudes in V) and pulse areas (in nVs). A characteristic time parameter, known as the time-constant, was defined as the ratio of the pulse area to amplitude (units of ns). Figure 9 shows this quantity for the condition of no applied electric field (solid) and 0.05 kV/cm (dashed).
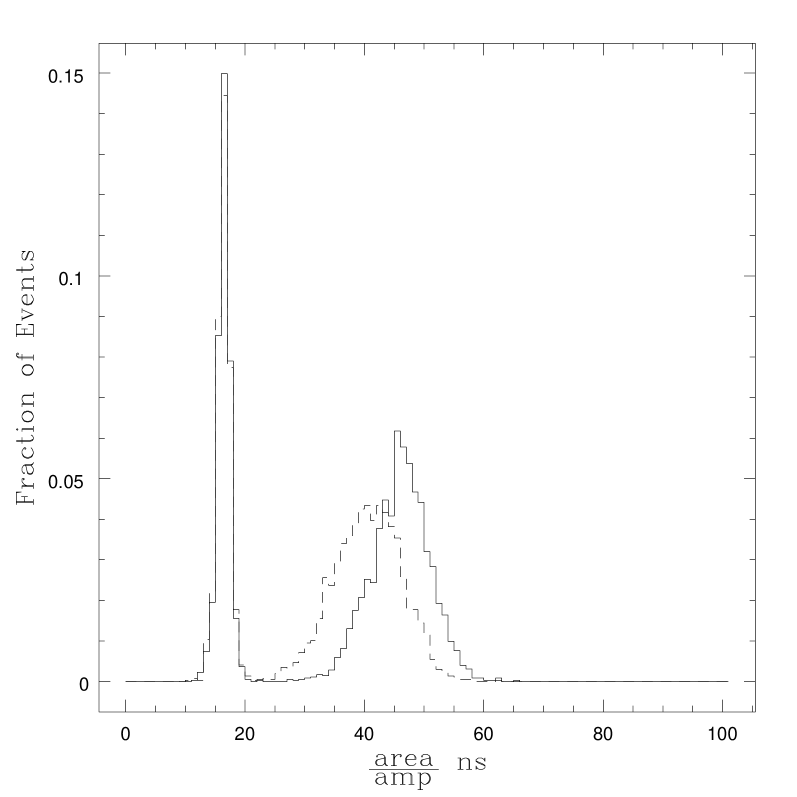

The data are clearly divided into alpha and gamma ray populations, based upon the measured area to amplitude ratios. Events with time-constants less than 22 ns were deemed alphas, events with ratios greater than this were identified as gamma rays. Figure 9 illustrates the effect of the electric field on the gamma ray scintillation pulse shape, reducing the time-constant. At each electric field value the mean time-constant was determined for alpha particles and gamma rays, see Figure 9.
A Monte Carlo simulation was used to investigate the behaviour of measured time-constant with number of photoelectrons detected. A parent exponential time-constant was chosen to mimic the behaviour of gamma rays under no electric field (47 ns), for alphas a shorter time-constant was chosen (15 ns). Exponential random deviates were generated, simulating the emission time of scintillation photons. All emitted photons are assumed to strike the photocathode of the photomultiplier tube, and an output voltage trace is produced. The photomultiplier simulation included the quantum efficiency of the tube, single photoelectron temporal profile, and jitter. The dynode resistor chain, and applied voltage were also implemented to give a realistic single photoelectron spectrum. The simulated voltage traces were analysed, returning pulse areas and amplitudes. The data were binned by pulse area and for each bin the mean and standard deviation of the pulse area to amplitude ratios was found. The simulated data were then compared to experimental data, as shown in Figure 10. The simulations can be made to match the experimental data well by adjusting the the parent exponential time-constant. In this figure the simulations are slightly offset from the experimental data. Simulations were also made to represent gamma rays under various electric fields by changing the parent time-constant.

The affect of the 22 ns time-constant cut applied to the real datasets was explored by applying the same cut on the simulated dataset. The probability of correctly identifying alphas (with time-constants less than 22 ns) and gamma rays (with time-constants greater than 22 ns) can be assessed. Figure 11 shows the identification probabilities determined by simulation as a function of number of photoelectrons, for the case of greatest applied electric field. The alpha particles are well identified with this cut for all photoelectrons. The alpha identification probability falls with decreasing number of photoelectrons as the standard deviation of the time-constant distribution increases (see right-hand plot, Figure 10). Below a hundred photoelectrons, the probability increases as the mean of the time-constant distribution falls (see left-hand plot, Figure 10) overriding the effect of the increasing standard deviation. For gamma rays, the identification probability falls with number of photoelectrons, due to both the mean and standard deviation of the time-constant distribution falling and rising respectively. For a gamma ray signal comprising 1000 photoelectrons the probability of correctly identifying the signal is 0.96 0.01. Equivalently for an alpha signal the probability is greater than 0.999. For the experimental datasets (with large numbers of photoelectrons) this time-constant cut was good and should not have biassed the results, even under high electric field strengths. However, using this cut on signals with low numbers of photoelectrons would have resulted in misidentifying many gamma rays as alpha particles. To achieve the most success in separating gamma rays from alpha particles, the time-constant cut should vary with number of photoelectrons and be set according to one of three conditions; to either accept fewer alphas (and reject gammas with high efficiency), to accept fewer gammas (and reject alphas with high efficiency), or to some intermediary state in which the majority of one population are accepted but with a significant contamination of the other population. As an example, with 100 photoelectons and a 22 ns cut the probability of identifying a gamma ray has a low efficiency ( 0.5) but the probability of an alpha particle contaminating the sample is unlikely (less than 0.02). In this case, the gamma rays are identified with a low efficiency but alpha particles are highly discriminated.
6 Conclusion
Pulse height spectra produced by an external source and the internal source were compared to GEANT 4 [19] simulations. The features of both spectra are well reproduced. For the majority of this sensitive volume the yield is estimated to be 1.5 photoelectrons per keV (under the condition of no applied electric field).
The variation of scintillation pulse area from gamma rays was investigated as a function of electric field, using the large-angle scatter peak. The scintillation pulse areas decrease as the applied electric field increases. For a 212 keV gamma ray, 64 2 % of the scintillation is found to be produced via recombination.
The temporal profile of the scintillation signal was investigated for incident alpha particles and gamma rays with increasing electric field. No significant change with electric field was observed for alpha particles. Gamma ray signals, however, become faster with low electric field strengths from 46.1 0.1 ns with no electric field to 25.2 0.1 ns at 0.5 kV/cm. Increasing the electric field strength further reduces the time-constant to 22.6 0.1 ns at 3.7 kV/cm. The behaviour of the derived time-constant with numbers of photoelectrons detected was investigated with simulation and compared to experimental data. The behaviour of measured time-constants from alphas and gammas (at all fields) can be reproduced using only one parameter, the parent time-constant.
From this work, the scintillation signal (both in size and shape) produced by any energy deposit from an alpha particle or gamma ray in liquid xenon can be predicted. The number of electrons extracted from a gamma ray interaction under any strength electric field can also be predicted, aiding simulations of the response of two-phase xenon detectors to gamma ray interactions.
References
- [1] Doke T., Hitachi A., Kikuchi J., Masuda K., 2002, Japanese Journal of Applied Physics, 41, 1538-1545.
- [2] Barabanov I. R., Gavrin V. N., Pshukov A. M., 1987, Nuclear Instruments and Methods in Physics Research A, 254, 355-360.
- [3] Schwentner N., Kock E.-E.,Jortner J., 1985, ’Electronic Excitations in Condensed Rare Gases’, Springer Tracts in Modern Physics, Vol 107, 135-136.
- [4] Kubota S., Hishida M., Suzuki M., Ruan(Gen) J-Z., 1979, Physical Review B, 20, 3486-3496.
- [5] Akimov D., et al., 2002, Physics Letters B, 524, 245-251.
- [6] Hart S. P., et al (the UK Dark Matter Collaboration), 2002, Nuclear Physics B (Proceedings Supplement), 110, 91-93.
- [7] Cline D., 2000, Nuclear Physics B (Proceedings Supplement), 87, 114-116.
- [8] Dawson J. V., 2003, Ph.D Thesis, University of London.
- [9] Hitachi A., Takahashi T., Funayama N., Masuda K., Kikuchi J., Doke T., 1983, Physical Review B, 27, 5279-5285.
- [10] Conti E., et al, 2003, Physical Review B,68, 054201.
- [11] Jaffe G., Ann. Phys. (Leipzip), 1913, 42, 303.
- [12] Kubota S., et al, 1978, Physical Review B, 17, 2762-2765.
- [13] Voronova T., Kirsanov M., Kruglov A., 1979, Soviet Journal of Technical Physics, 59, 186-189.
- [14] Davidge D. C. R., 2003, Ph.D Thesis, University of London.
- [15] Electron Tubes Limited, 2003, http://www.electron-tubes.co.uk.
- [16] Howard A. S., et al, 2001, 3rd International Workshop on Identification of Dark Matter (World Scientific) 457-462.
- [17] Messer Griesheim, 2003, http://www.messergroup.com/index1.html.
- [18] ANSYS Inc., 2003, http://www.ansys.com.
- [19] Agostinelli S., et al (GEANT4 Collaboration), 2003, Nuclear Instruments and Methods in Physics Research A, 506, 250-303.