Observations of three slow glitches in the spin rate of the pulsar B182209
Abstract
Three slow glitches in the rotation rate of the pulsar B182209 were revealed over the 1995–2004 interval. The slow glitches observed are characterized by a gradual increase in the rotation frequency with a long timescale of several months, accompanied by a rapid decrease in the magnitude of the frequency first derivative by 1–2 per cent of the initial value and subsequent exponential increase back to its initial value on the same timescale. The cumulative fractional increase in the pulsar rotation rate for the three glitches amounts to .
keywords:
stars: neutron – stars: pulsars: general – stars: pulsars: individual: PSR B1822-09 – stars: rotation.1 Introduction
Many pulsars exhibit significant variations in their rotation rates superimposed on the deterministic pulsar spin-down due to electromagnetic torque. Rotation variations may occur in the form of glitches - sudden increases in rotation frequency and in the form of timing noise - random variations in pulse arrival times. For slow pulsars, a rotation phase is well described by a simple spin down model. The values of the second derivative due to slowdown are usually very small in comparison to the measurement uncertainties. The significant second derivatives measured for most slow pulsars are manifestations of random walk processes that produce timing residuals with cubic polynomial components (Cordes & Helfand, 1980). These cubic structures make up 30 per cent of many different structures observed in the timing residuals (Hobbs et al., 2003). The strength of timing noise is correlated with the period derivative and is quantified by the stability parameter based on a non-zero second derivative of the rotation frequency (Cordes & Downs, 1985; Arzoumanian et al., 1994).
PSR B182209 is of great interest as it enables the timing behaviour of a pulsar to be studied over a long observing span. It has a period of 0.769 s, a large period derivative of , implying a relatively young characteristic age of 230 kyr. An analysis of timing data over the observational interval 1989–1993 by Arzoumanian et al. (1994) showed that this pulsar possesses considerable timing noise described by the stability parameter =-1.2. Timing observations for a longer interval of 3000 days (Lyne, 1996) before the glitches occurred also showed that this pulsar is among the noisiest pulsars. During this interval, variations in pulse arrival times for the pulsar were characterized by red power spectrum and consequently, timing residuals relative to a simple spin-down model were described by a cubic term corresponding to the significant second derivative.
In 1994 September the pulsar suffered a small glitch with (Shabanova, 1998). This glitch was typical, associated with a sudden increase in the rotation frequency. Subsequent monitoring of the pulsar showed evidence for a new kind of timing variations which may be described in terms of a slow glitch. Since 1995, the pulsar has suffered three slow glitches. The present paper is the third in series studying the glitch behaviour of the pulsar B182209. The signature of the first slow glitch occurred in late 1995 was described in the first paper (Shabanova, 1998). It was shown that the slow glitch observed was characterized by a gradual increase in the rotation frequency during 620 days, accompanied by a rapid decrease in the magnitude of the frequency first derivative by 0.4 per sent and subsequent increase back to its initial value on the same time span. In the second paper (Shabanova & Urama, 2000), the glitch behaviour of the pulsar for the period 1991–1998 was studied at widely separated frequencies of 0.1 and 1.6/2.3 GHz using quasi-simultaneous observations made at the Pushchino Radio Astronomy Observatory (PRAO) and the Hartebeesthoek Radio Astronomy Observatory (HartRAO). The authors showed that the and changes with time are similar at both observational frequencies and reported the second large decrease in the magnitude of the frequency derivative by 2.4 per sent which occurred in 1998 August. The present paper summarises the results of the two previous papers, reports the third slow glitch occurred in 2000 December and presents the description of the timing behaviour of PSR B182209 over the 19-yr data span from 1985 to 2004.
The third slow glitch was independently detected by Zou et al. (2004) and published in a recent paper obtained from astro-ph after submission of the present paper. Comparison between the results presented in both papers is given in the results section.
2 Observations and timing analysis
Timing observations of the pulsar have been made at the Pushchino Observatory at frequencies around 102.5 and 112 MHz with the BSA transit radiotelescope, using a 32 20 kHz filter bank receiver. Observations have been conducted since 1991 a few times per month and lately daily. The detected signal was sampled at 1.28-ms intervals and integrated synchronously with the apparent pulsar period for 3.2 minutes of the BSA transit time. After the dispersion removal the signals from all the channels were summed to form an average pulse profile for a single observation.
The topocentric arrival times for each observation were calculated by cross-correlating an average pulse profile with a low-noise template and then were corrected to the barycenter of the Solar System using the TEMPO software package111http://www.atnf.csiro.au/research/pulsar/timing/tempo and the JPL DE200 ephemeris. A pulsar position and a proper motion assumed in this correction were taken from Arzoumanian et al. (1994) and Fomalont et al. (1992), respectively. A simple spin-down model involving a rotation frequency and its first derivative was used for fitting to the barycentric arrival times giving the pulse phase at the time as
| (1) |
where is the phase at some reference time . The differences between the observed times and times predicted from a best fit model gave the timing residuals which were used for an analysis of the pulsar rotation behaviour.
3 Results
In order to study variations in the spin-down parameters of the pulsar in more detail, the rotation frequency and frequency first derivative were calculated by performing local fits to the arrival time data over the intervals of 120–200 days. The timing data set analysed includes the Pushchino data collected for the period 1991–2004 and the HartRAO data collected over the 1985–1998 interval and taken from the previously published paper (Shabanova & Urama, 2000).
3.1 Signature of the first slow glitch
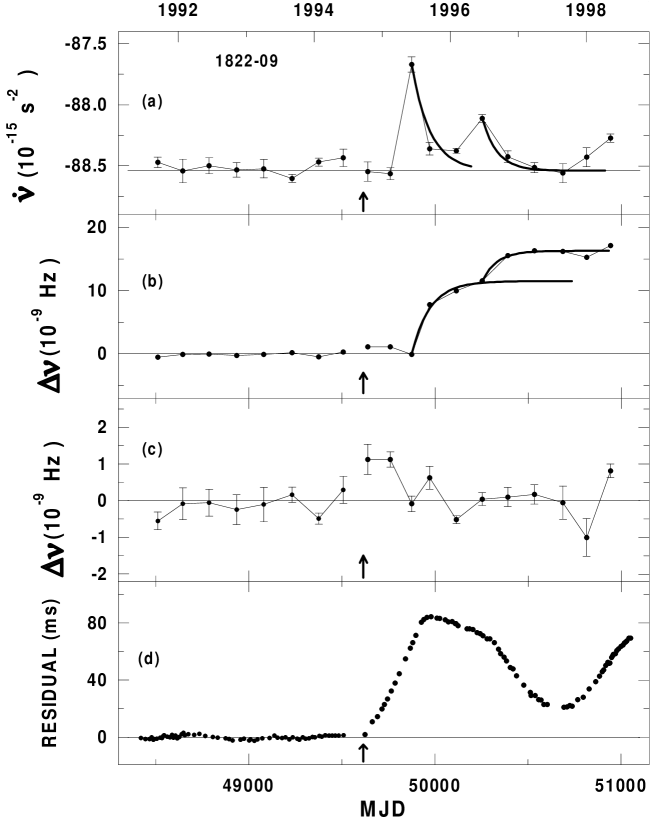
This section presents a detailed description of the signature of the first slow glitch, using the , data published in the two previous papers (Shabanova, 1998; Shabanova & Urama, 2000). During the period 1991–1998, the pulsar suffered two glitches, the first of which occurred at the end of September, 1994 (MJD 49615) and had a typical signature, while the second occurred about a year later (MJD 49940) and exhibited an unusual signature related to a gradual increase in the pulsar rotation frequency. The plots of and together with the timing residuals over the interval 1992–1998 are shown in Fig. 1. The frequency residuals are given relative to a simple slow-down model, involving the mean value of and defined over the interval 1991–1994, where the behaviour of the pulsar was steady. The values of and were calculated from the local fits, performed over intervals of 120 days. The plotted points agree well with the mean spin-down parameters up to the 1994 glitch. This glitch was quite small with the fractional increase of rotational frequency equal to . Apparently, the glitch was followed by a relaxation in frequency as shown in Fig. 1b.
From Figs. 1a and 1b, it is seen that and begin to vary considerably shortly after the 1994 glitch. During the 500-day interval from the middle of 1995 to the end of 1996, was smaller than the mean spin-down. The observed changes in involve two similar events. The first one occurred at about MJD 49874 when rapidly decreased by approximately 0.7 per cent of the initial value, while the second one occurred at about MJD 50253 when decreased by 0.3 per cent of the initial value. Both the events were followed by an increase back to its initial value. The relaxations are well described by two different exponential components with timescales of 100 and 80 days, respectively, as shown in Fig. 1a.
Fig. 1b shows that a slow increase of the frequency residuals relative to the pre-glitch data begins when rapidly reaches its minimum value (near MJD 49874). The slow growth of is well described by a combination of two asymptotic exponential functions with the same timescales of 100 and 80 days. The frequency residuals after subtracting these asymptotic exponentials are given in Fig. 1c. The size of the slow glitch after a span of two years is equal to . Apparently, the slow glitch observed is about one order of magnitude larger than the 1994 glitch which showed a typical signature.
The timing residuals relative to the best-fit for and for the data from the interval of 1200 days preceding the 1994 glitch and for the data from the interval of 1400 days following the 1994 glitch are presented in Fig. 1d. The timing residuals for the data over the period 1995–1998 when the slow glitch was observed, have quasi-periodic structure with the amplitude of about 80 ms. From Figs. 1b and 1d, it is clear that the changes in the slope of the curves of frequency and timing residuals reflect the detailed structure in the frequency first derivative .
3.2 Observed properties of the slow glitches
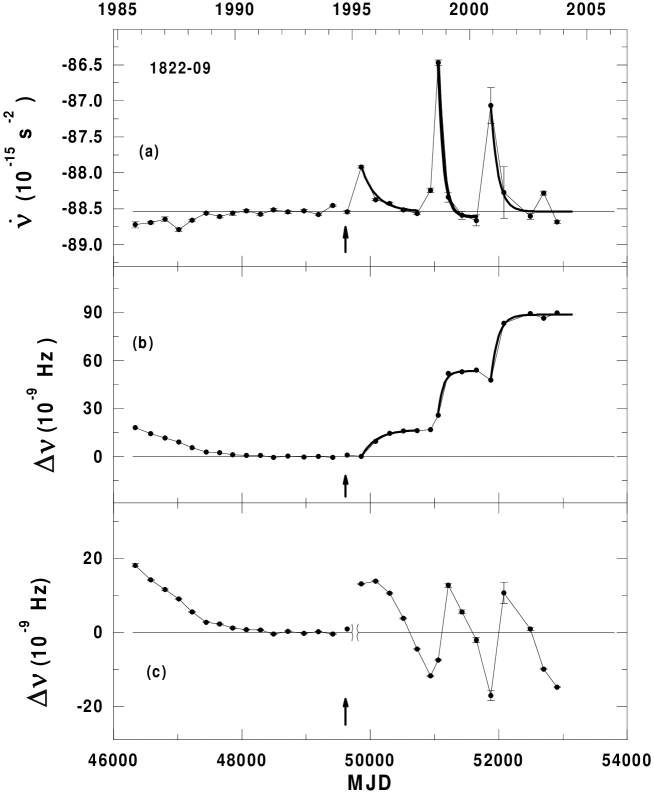
Fig. 2a shows as a function of time over the entire data span of 19 years from 1985 to 2004. A plot of versus time is given in Fig. 2b. As before, the frequency residuals are presented relative to the data from the interval 1991–1994. Here, the local fits were performed over intervals of 200 days. The dependencies of and on time are different for the timing data collected before and after the 1994 glitch. A long-term linear trend in is well seen in the pre-glitch data. Both the plots show that there is a large pre-glitch frequency second derivative . It is most likely related to timing noise.
The behaviour of the three slow glitches after 1995 can be clearly seen in Figs. 2a and 2b. The signature of the first slow glitch was analysed in detail in the previous section. Common properties of the slow glitches observed may be described as follows. The slow glitches are characterized by a rapid initial decrease in the magnitude of and subsequent increase back to its previous value with a long timescale of several months. This causes a gradual growth in the frequency residuals with the same timescale. The epoch of a slow glitch is the time at which rapidly reaches its minimum value. This epoch is slightly earlier than the epoch when the timing residuals begin to show the negative change after the slow glitch.
The derived parameters of the three slow glitches observed in the rotation rate of the pulsar B182209 are given in Table 1. A fractional decrease of the frequency derivative is about 0.7, 2.7 and 1.7 per cent for the three events, respectively. The form of the subsequent increase back to its initial value is well modelled by an exponential function with a timescale of 235, 80 and 110 days, respectively. A gradual growth in rotation frequency is well described by asymptotic exponential functions with the same timescales of 235, 80 and 110 days. A fractional increase in frequency of is about 13, 20 and 31 for the three slow glitches, respectively.
| Glitches | 1 | 2 | 3 |
|---|---|---|---|
| Epoch (MJD) | 49857 | 51060 | 51879 |
| -0.007 | -0.027 | -0.017 | |
| 12.6 | 20 | 31.4 | |
| (days) | 235 | 80 | 110 |
The integrated effect of the three slow glitches at the present time (for example, on May 25, 2004) is equal to Hz that gives the total fractional increase in the rotation frequency of . This means that at the indicated epoch the pulsar period is approximately 53 ns less than the expected value from extrapolation of the pre-glitch 1991–1994 model. As a result, the pulsar begins to rotate faster than it would if the slow glitches had not occurred.
The third glitch was also detected by Zou et al. (2004) at the observing frequency of 1540 MHz and described as slow glitch, too. The size of this glitch with is in good agreement with the result in Table 1. However, there is a discrepancy between the quoted values of the changes in the frequency derivative. Zou et al. (2004) give , that is one order magnitude smaller than given in Table 1. The signature of and shown in their Fig.2 over the interval MJD 51500–53000 is consistent with that plotted in Figs. 2a and 2b of the present paper. The small event in reported by Zou et al. (2004) as the next possible slow glitch between MJD 52798 and 52969 is clearly seen in our plot, too. The good agreement between the results describing the signature of the third slow glitch at different frequencies of 112 and 1540 MHz provides strong evidence for the existence of unusual glitch phenomenon in the pulsar B182209.
The frequency residuals relative to the new model fit involving the new values of and from the interval 1995–2004 where the three slow glitches occurred, are presented in Fig. 2c on the right hand plot. It is clearly seen that the rotation frequency of the pulsar relative to the new fit shows the oscillation behaviour. The timescale of this oscillation can be estimated to be 1000 days.
3.3 Timing residuals of the pulsar
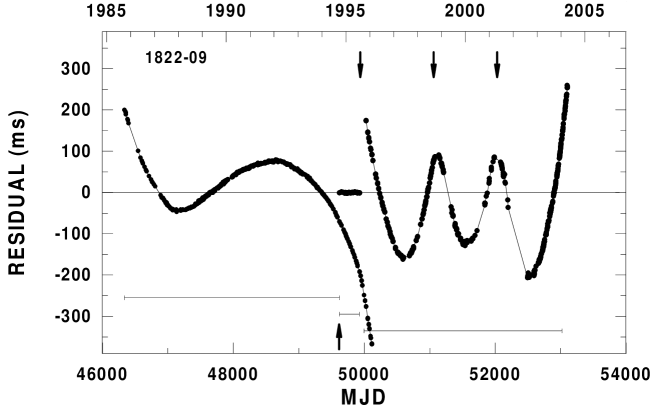
A full picture of the timing residuals for the pulsar B182209 over the 19-yr data span between 1985 and 2004 is presented in Fig. 3. Analysis of the entire data set showed that all arrival times cannot be described by a simple spin-down model within half the pulsar period because of the presence of several glitches. Therefore, the timing residuals were obtained from three independent polynomial fits for and over three different intervals indicated in the plot by the horizontal lines. The corresponding mean values of the spin-down parameters are given in Table 2. The errors are given in units of the last quoted digit. The derived models are a good representation of the timing behaviour of the pulsar for the total data span of 19 years and successfully predict the pulse arrival times and the pulse periods over the present observing session.
For the first interval 1985–1994, the timing residuals relative to a simple spin-down model show a large cubic term which corresponds to a large frequency second derivative . The magnitude of for this pulsar is a measure of the amount of timing noise (Lyne, 1996). It gives the timing noise parameter =-0.94 that agrees well with that of Arzoumanian et al. (1994). The derived braking index, , is too large to be due to the pulsar slowdown and indicates the high level of timing noise, too. This timing behaviour was interrupted by a small glitch occurred in 1994 September.
The second interval is a short one-year interval 1994–1995 following the 1994 glitch and preceding the first slow glitch in 1995 August. During this interval the pulsar exhibits the timing residuals dominated by the random deviations at a level of a few milliseconds with a zero mean.
The third interval is a long interval from 1995 to 2004 where the three slow glitches occurred. The plot shows that variations in the pulse arrival times have oscillatory structure with a large amplitude of about 150 ms. Three cycles of this structure are caused by the three slow glitches observed for this interval. It is seen that the timing residuals presented in Fig. 3 well correspond to the frequency residuals of Fig. 2. Comparison between the values of the period derivative for different intervals indicated in Table 2 shows that the presence of slow glitches decreases significantly the mean value of the period derivative.
| Fit interval | Epoch | Period | Period derivative |
|---|---|---|---|
| (MJD) | (MJD) | (s) | |
| 46338–49618 | 46338.7577 | 0.76897015431(9) | 52.3846(5) |
| 49618–49928 | 49618.8354 | 0.76898499734(6) | 52.3255(37) |
| 49996–53034 | 49996.8689 | 0.76898671206(16) | 52.0924(12) |
4 Discussion
The main result of this paper is detailed description of a new kind of timing variations which may be explained in terms of a slow glitch. Results of the two previous papers (Shabanova, 1998; Shabanova & Urama, 2000) and also the present paper have shown that the pulsar B182209 suffered three slow glitches over the 1995–2004 interval. The third slow glitch was independently detected by Zou et al. (2004) and the authors have interpreted unusual glitch phenomena in PSR B182209 as slow glitches, too. Characteristic properties of the slow glitches observed are a gradual increase in the rotation frequency with a long timescale of several months, accompanied by a rapid decrease in the magnitude of the frequency derivative by 1–2 per cent of the initial value and subsequent exponential increase back to its initial value with the same timescale. The size of a slow glitch after a span of a few years is rather moderate, with the fractional increase . An obvious relaxation in frequency after a slow glitch is not observed. An analysis of observations of large samples of pulsars (Cordes & Helfand, 1980; Gullahorn & Rankin, 1982; Cordes & Downs, 1985; Lyne et al., 1992, 1993; D’Alessandro et al., 1995; Johnston et al., 1995; Shemar & Lyne, 1996; Wang et al., 2000; Krawczyk et al., 2003) showed that an event similar to a slow glitch was not observed earlier in any pulsar.
Fig. 2 shows that the small glitch of 1994 lies between two regions with different behaviour of the frequency derivative. It is of interest whether this glitch could affect the character of timing variations and whether this small glitch could act as a trigger for a slow glitch, about two orders of magnitude larger.
It is known that variations in the pulsar rotation rate in the form of glitches and timing noise are an important source of information on neutron star interiors (Baym et al., 1969; Alpar et al., 1984; Pines & Alpar, 1985). These events are common to many pulsars and arise from sudden and irregular transfer of angular momentum between a more rapidly rotating interior superfluid and a solid crust of a neutron star. Pulsar glitches are characterized by a sudden increase in rotation frequency with to , followed by a post-glitch relaxation. They are accompanied by an increase in the magnitude of the frequency derivative with to , which decays after the glitch (Shemar & Lyne, 1996). The pulsar glitches and post-glitch relaxation reflect changes in the angular momentum distribution inside a neutron star (Alpar et al., 1993).
The signature of slow glitches, as they have been observed in the spin rate of the pulsar B182209, is quite different. The existence of a gradual glitch, as a response of a neutron star to a perturbation in its temperature, was predicted by a model in which a glitch was associated with a thermal instability in a neutron star (Greenstein, 1979). A slow glitch may be a thermal response of a neutron star to a sudden local increase of the inner crust temperature (Link & Epstein, 1996). However, the behaviour of the frequency derivative - a rapid initial decrease and subsequent exponential increase back to the initial value, is not accounted for by the thermal glitch model. It seems more likely, the significant variations in spin-down rate have to be attributed to variations in braking torque. A decrease in spin-down rate requires a corresponding decrease in torque that brakes rotation of the pulsar crust.
Torque variations may be caused by changes in the magnetosphere structure, for example, the variations of the polar cap size. The region of magnetosphere which rigidly corotates with a neutron star is restricted to the light cylinder. In order to decrease , the region of a corotating magnetosphere should decrease, i.e. closed magnetic field lines should temporarily open and then the polar cap size should increase. The measured oscillatory behaviour in the rotation frequency on the timescale of 1000 days reflects the oscillatory changes in torque which suggests the existence of a long-term oscillation in the polar cap size. This oscillation could be accompanied by observable changes in an average pulse profile shape which is determined mainly by the structure of the magnetic field.
It should be noted that the pulsar B182209 is a very interesting object. It exhibits simultaneously four rare properties of the pulsar emission. Three unusual properties as mode-changing of the average pulse profile, drifting subpulses and interpulse emission were revealed by Fowler et al. (1981) in the frequency range 1620–2650 MHz. The forth property - the microstructure in the main pulse emission, was detected by Gil et al. (1994) at the frequency of 1420 MHz. At the low frequency of 112 MHz, these unusual properties are not seen. An analysis of the width and intensity of the average pulse profile made for the data span before and after the glitches did not show any changes within the precision of the measurements. It is reasonable to search for a correlation between the times of slow glitches and the occurrence of mode-changing and other properties of the pulsar emission in the data obtained at high frequencies where the mentioned properties are clearly seen.
Acknowledgments
The author thanks Yu.P. Shitov for useful discussions, the staff of PRAO for assistance in the observations. The author is grateful to the referee for helpful comments that have improved the presentation of the paper.
References
- Alpar et al. (1984) Alpar M.A., Anderson P.W., Pines D., Shaham J., 1984, ApJ, 276, 325
- Alpar et al. (1993) Alpar M.A., Chau H.F., Cheng K. S., Pines D., 1993, ApJ, 409, 345
- Arzoumanian et al. (1994) Arzoumanian Z., Nice D.J., Taylor J.H., Thorsett S.E., 1994, ApJ, 422, 671
- Baym et al. (1969) Baym G., Pethick C., Pines D., Ruderman M., 1969, Nat, 224, 872
- Cordes & Downs (1985) Cordes J.M., Downs G.S., 1985, ApJS, 59, 343
- Cordes & Helfand (1980) Cordes J.M., Helfand D.J., 1980, ApJ, 239, 640
- D’Alessandro et al. (1995) D’Alessandro F., McCulloch P.M., Hamilton P.A., Deshpande A.A., 1995, MNRAS, 277, 1033
- Fomalont et al. (1992) Fomalont E.B., Goss W.M., Lyne A.G., Manchester R.N., Justtanont K., 1992, MNRAS, 258, 497
- Fowler et al. (1981) Fowler L.A., Wright G.A., Morris D., 1981, A&A, 93, 54
- Gil et al. (1994) Gil J.A., Jessner A., Kijak J., Kramer M., Malofeev V., Malov I., Seiradakis J.H., Sieber W., Wielebinski R., 1994, A&A, 282, 45
- Greenstein (1979) Greenstein G., 1979, ApJ, 231, 880
- Gullahorn & Rankin (1982) Gullahorn G.E., Rankin J.M., 1982, ApJ, 260, 520
- Hobbs et al. (2003) Hobbs G., Lyne A., Kramer M., 2003, astro-ph/0310093
- Johnston et al. (1995) Johnston S., Manchester R.N., Lyne A.G., Kaspi V.M., D’Amico N., 1995, A&A, 293, 795
- Krawczyk et al. (2003) Krawczyk A., Lyne A.G., Gil J.A., Joshi B.C., 2003, MNRAS, 340, 1087
- Link & Epstein (1996) Link B., Epstein R.I., 1996, ApJ, 457, 844
- Lyne (1996) Lyne A.G., 1996, in Johnston S., Walker M.A., Bailes M., eds, Proc. IAU Colloquium 160, Pulsars: Problems and Progress, Astron. Soc. Pac., San Francisco, p.73
- Lyne et al. (1993) Lyne A.G., Pritchard R.S., Smith F.G., 1993, MNRAS, 265, 1003
- Lyne et al. (1992) Lyne A.G., Smith F.G., Pritchard R.S., 1992, Nat, 359, 706
- Pines & Alpar (1985) Pines D., Alpar M.A., 1985, Nat, 316, 27
- Shabanova (1998) Shabanova T.V., 1998, A&A, 337, 723
- Shabanova & Urama (2000) Shabanova T.V., Urama J.O., 2000, A&A, 354, 960
- Shemar & Lyne (1996) Shemar S.L., Lyne A.G., 1996, MNRAS, 282, 677
- Wang et al. (2000) Wang N., Manchester R.N., Pace R.T., Bailes M., Kaspi V.M., Stappers B.W., Lyne A.G., 2000, MNRAS, 317, 843
- Zou et al. (2004) Zou W.Z., Wang N., Wang H.X., Manchester R.N., Wu X.J., Zhang J., 2004, astro-ph/0407483