Indian monsoon rainfall is higher in epochs of higher solar activity: a wavelet cross-spectral analysis
Abstract
Using the Morlet continuous wavelet transform on data over the period 1871-1990, it is found that the global wavelet cross spectra between two solar activity indices and seven major Indian monsoon rainfall time series show significant power around the period of the 11 year solar cycle, passing the test of significance proposed by Torrence and Compo (1998) at levels exceeding in 10 out of the 14 cases studied. Furthermore two distinct epochs are found in the computed cross-spectrum, the transition between them occurring around the decade 1915-1925, beyond which solar activity parameters show a significant increase. By comparison between selected periods of three cycles in solar activity in each of the two epochs, it is shown that the average rainfall is higher in all seven rainfall indices during periods of greater solar activity, at z-test confidence levels of or greater in three of them.
S. BHATTACHARYYA AND R. NARASIMHA \titlerunningheadMONSOON RAINFALL AND SOLAR ACTIVITY \authoraddrS. Bhattacharyya, R. Narasimha, Engineering Mechanics Unit, Jawaharlal Nehru Centre For Advanced Scientific Research, Jakkur, Bangalore 560064, India, roddam@caos.iisc.ernet.in {article}
1 Introduction
There are numerous studies of the possible influence of solar activity on terrestrial climate. Although solar-terrestrial connections have been somewhat sceptically received by much of the meteorological community, the growing availability of paleo-climate indicators using novel measurement techniques, and the discovery of the prominent solar activity period of 11 years in varied climate records using new mathematical tools, are producing increasingly strong evidence for possible association between solar processes and terrestrial weather and climate indices (Beer et al.(1990), Friis-Christensen and Lassen (1991), Lassen and Friis-Christensen (1995), Haigh (1996, 1999, 2001), Labitzke and Loon (1997), Mehta and Lau (1997)). Doubts about effects on shorter time scales (of the order of 100y) seem however to remain. Earlier studies of possible connections between Indian monsoon rainfall and solar activity (Jagannathan and Bhalme (1973) and Jagannathan and Parthasarathy (1973)), using correlation and power spectral analysis of the rainfall distribution in meteorological stations spread all over India, reported presence of the 11-year sunspot cycle at significance levels of or higher in of them.
The possibility of shedding light on the variability of the Indian monsoon using wavelet techniques (Kailas and Narasimha (2000), Narasimha and Kailas (2001)), and the idea that the tropics can amplify a small radiant flux signal to a relatively large and dynamic climate change elsewhere in the world as well (Haigh (2001), Visser et al. (2003)), serve to provide further motivation for the present work. In a recent study by Neff et al. (2001), strong coherence between the solar variability and the monsoon in Oman in the period between 9 and 6 kyr B.P. has been reported.
There has been a recent surge in interest in incorporating wavelet techniques for climate signal detection and analysis, as can be seen in the works of Lau and Weng (1995) and Torrence and Compo (1998). In particular, Narasimha and Kailas (2001), analysing Indian monsoon rainfall, identified six ’quasi cycles’, with average periods of 2.92, 5.8, 11.4, 19.9, 34.2 and 79.8 y. These numbers suggested the presence of several super- and sub-harmonics of the basic sun-spot period of about 11 y. Iyengar and Raghukantha (2004) have identified intrinsic modes with periods virtually identical to those observed by Narasimha and Kailas (2001).
In continuation of this on-going research, we now present an analysis of the association between indicators of solar activity and Indian monsoon rainfall, using the continuous wavelet transform method with the Morlet wavelet function.
2 The data analysed
Seven annual area-weighted rainfall time series for the period 1871-1990 have been considered for the analysis, namely, all India summer monsoon rainfall (AISMR), north east India (NEI), north west India (NWI), central north east India (CNEI), west central India (WCI), peninsular India (PENSI) and the homogeneous Indian monsoon (HIM)(Parthasarathyet al (1995)). The choice of these regions is based on several well defined criteria including primarily a considerable degree of spatial coherence. The HIM region covers the central and north-western parts of India amounting to of the total land area of the country, and may be seen as the most characteristic index of the component of Indian rainfall dominated by the dynamics of the south west monsoon. As it is well known that the NEI region shows in many ways an anti-correlation with the HIM region (Parthasarathy et al. 1993), we present more detailed results specifically for these two regions.
The range of scales over which these rainfall data can provide useful information on temporal variability is limited at one end by resolution, since not more than 12 points per year are available, and at the other end by the limited length of data stretch of 120 years. For the present study we have found annual rainfall to be the most appropriate rainfall index to use. The solar indices under study are sunspot number index and group sunspot number. Sunspot areas have also been studied, but have been found to provide no new information. The sunspot index data have been obtained from Rai Choudhuri (1999) and Fligge et al. (1999), and the data for group sunspot number from the NOAA ftp site ftp://ftp.ngdc.noaa.gov/STP/SOLAR_DATA.
We must note one important difference between the rainfall and sunspot data. The former are cumulative, the monthly data being a sum of the daily data. That is not the case for sunspot data, since individual sunspots live typically for several days. All monthly data of sunspots are usually compiled by taking averages of daily data over a month. The monthly average sunspot number plotted against time does not appear very smooth (see, for example, the website http://science.msfc.nasa.gov/ssl/pad/solar/image/zurich.gif). As our aim here is to study possible correlations of the rainfall data with solar processes with time scales of order years to decades, we filter out fluctuations in the sunspot data at small time scales by using yearly sunspot and group sunspot numbers.
3 Wavelet Cross Power Spectrum
We use the Morlet wavelet function
| (1) |
where is a nondimensional frequency, taken equal to 6 in order to satisfy the wavelet admissibility condition, and is a nondimensional time parameter. For a discrete sequence , , the continuous wavelet transform is defined as a convolution of with a scaled and translated version of the wavelet function , as given by the expression
| (2) |
where ⋆ denotes the complex conjugate, and is the (sampling) time interval between two consecutive points in the time series. The wavelet function at each scale is normalised to have unit energy, so that
| (3) |
| (4) |
where is the Fourier transform of . The wavelet power spectrum of is given by the convolution and the wavelet power is given by the magnitude . For the wavelet cross power spectral analysis we utilize the easy-to-use toolkit, including statistical significance testing, as outlined by Torrence and Compo (1998). The cross wavelet spectrum between two time series and , with the respective wavelet transforms and , may be defined as
| (5) |
The cross wavelet power is . Torrence and Compo (1998) derive the confidence levels for the cross wavelet power from the square root of the product of two distributions. In the test, a peak in the wavelet power spectrum is considered to be a true feature, with a certain percentage confidence, if the peak is significantly above a background or reference spectrum given by
| (6) |
Here is the frequency index, and where and are the lag-1 and lag-2 autocorrelation coefficients of the process under consideration. For a white noise background spectrum . If the two time series have background spectra given respectively by and , then the cross wavelet power distribution will be given by
| (7) |
where and are the standard deviations of and respectively, is the number of degrees of freedom with which is distributed, denotes the level of confidence and denotes the value of the distribution with degrees of freedom at the confidence level . For the complex Morlet wavelet .
4 Results
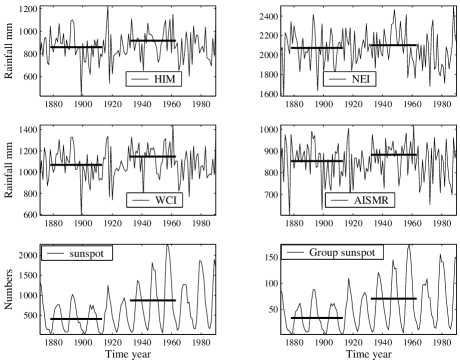
A plot of the annual time series of the four rainfall and two solar indices under consideration is shown in figure 1. The rainfall time series appear irregular and random, while the solar indicators have a clearly cyclic character.
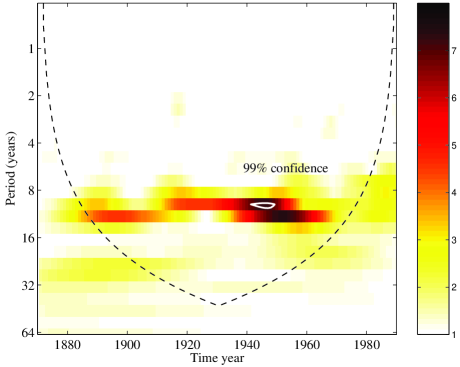
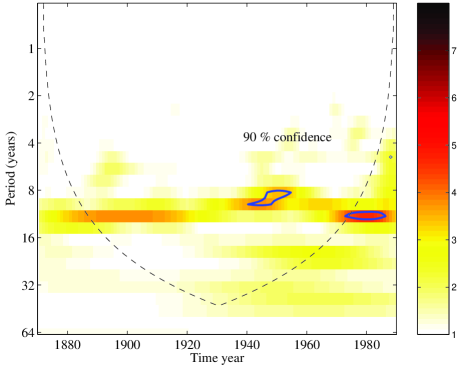
The results of the present analysis are presented in the form of colour-coded contour maps (see figures 2 and 3) of wavelet cross power spectra as functions of time and Fourier period (henceforth refered to as period) respectively for HIM and NEI rainfall. Outlined on these graphs are thick contours enclosing regions where wavelet cross power exceeds confidence levels, with respect to the reference spectra mentioned above. The cones of influence within which edge effects become important are also indicated by dashed lines in the figures.
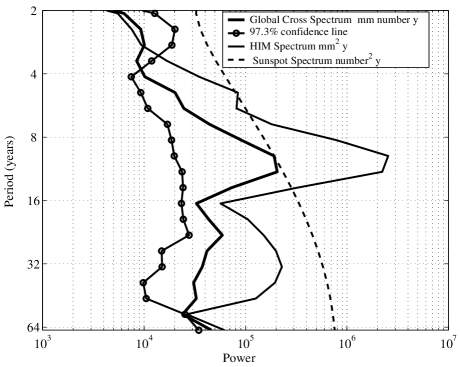
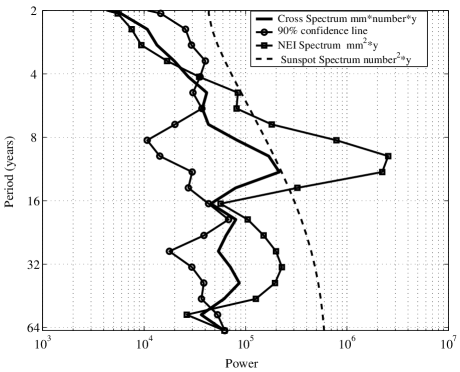
Figures 4 and 5 show several global wavelet power spectra as functions of period for HIM and NEI rainfall. For HIM rainfall (figure 2), a wavelet cross power of noticeably high magnitude is observed at the middle of the period range 8-16 years. An integration over time of this wavelet cross power, which gives the global wavelet cross power spectrum, is shown in figure 4. It can be seen clearly from this figure that the cross wavelet power crosses the confidence line at a period of around 11 years. Circles and squares respectively denote the contributions of the individual global wavelet power of the rainfall and the sunspot time series to the global spectrum. It is seen that the contribution of the 8-16 year period band is for the total rainfall and for the sunspot index.
Figures 3 and 5 show plots similar respectively to figures 2 and 4 but for NEI rainfall and group sunspot number. Significant power is observed in the 8-16 year period band in this case also. The global cross wavelet power spectrum also crosses the confidence line in the period range 8-16 years (figure 5); the corresponding cross power (see figure 2) is however lower than that for HIM. The highest cross power is observed during periods 1890-1905 and 1915-1965 in the former case, and during 1880-1920 and 1935-1980 in the latter case. In both cases, therefore, there is strong indication of two relatively distinct epochs, the transition from one to the other occurring around 1915-1925. As may be seen from Figure 1, solar activity generally shows an increase beyond this decade, suggesting that higher solar activity is associated with the higher cross spectrum.
Similar analyses have been carried out for the other 5 rainfall indices as well, and the results are summarised in Table 1. It will be seen that, except for NEI and PENSI rainfall, all the other cases show up regions of cross power at confidence levels exceeding at the 8-16 year period band.
From figure 1, two epochs of low and high group sunspot number can be identified, this transition also occurring around 1915 to 1925. We select here one time interval in each of the two epochs, namely 1878-1913 and 1933-1964 respectively, during each of which three complete solar cycles are present (considering the period from one minimum to the next as one complete cycle). Table 1 lists the annual rainfall means and respectively for the two periods 1878-1913 and 1933-1964; both the epochs and the corresponding means are shown in figure 1. The null hypothesis that the difference in mean annual rainfall between these two periods is zero is rejected at the maximum confidence levels listed in Table 1 using a one-tailed z-test (Crow et al. 1960). Thus the mean annual rainfall during 1933-64 (higher solar activity) is everywhere higher than that during the period (1878-1913) of lower solar activity. However the confidence levels are or higher in 3 cases out 7, including AISMR and HIM, and reaching in WCI. At the other extreme, it is a low in NEI and NWI.
The ratio of wavelet power present in the period 8-16 years to the total rainfall wavelet power is also presented in table 1. So are the ratios of cross wavelet power between the rainfall and group sunspot number in the 8-16 year band to the total cross wavelet power. In the case of HIM and WCI, which show the solar-monsoon link at the highest confidence levels, the cross spectrum is also high (about ), and the contribution from the 8-16 y band is nearly . It will be seen from Table 1 that, in general, significant effects on rainfall go with significant levels of cross power. The exception is the arid region NWI, where the lower significance levels for the differences in rainfall are due to the large relative standard deviation.
| Region | % con- | power | cross | conf., | ||
| mm \tablenotemarka | mm \tablenotemarkb | fidence \tablenotemarkc | rainfall \tablenotemarkd | power \tablenotemarke | cr-power \tablenotemarkf | |
| AISMR | 853.5 | 883.0 | 95 | 10.2 | 49.9 | 98 |
| HIM | 858.6 | 916.5 | 96.8 | 16.8 | 56.7 | 99 |
| WCI | 1067.2 | 1145.7 | 99 | 16.9 | 56.4 | 98 |
| PENSI | 1140.5 | 1183.2 | 85 | 10.4 | 47.4 | 92.5 |
| CNEI | 1204.2 | 1235.4 | 80 | 7.7 | 45.7 | 95 |
| NWI | 542.0 | 565.1 | 75 | 15.3 | 55.9 | 99 |
| NEI | 2071.8 | 2100.2 | 75 | 8.6 | 45.8 | 98 |
aMean rainfall over three cycles of low solar activity, 1878-1913. \tablenotetextbMean rainfall over three cycles of high solar activity, 1933-1964. \tablenotetextcConfidence level at which differs from zero by the z-test. \tablenotetextdContribution to total rainfall from 8-16 y band. \tablenotetexteContribution to cross-spectrum power from 8-16 y band. \tablenotetextfApproximate maximum confidence level at which cross spectrum exceeds values for reference spectrum over a continuous period of at least 10 y.
Incidentally the present results demonstrate the advantages of the wavelet approach, as compared with classical correlation/power spectral density methods: (i) wavelets permit identification of epochs during which correlations at different significance levels may have prevailed; (ii) wavelet methods allow us to take account of slight variations in the effective period or scale (’meandering’) of the effect of a given forcing (as may be seen from the regions of high cross spectra in figures 2 and 3), such meandering being presumably the result of the nonlinear interactions between different modes of the system.
5 Conclusions
The present study, involving two solar index time series and seven Indian rainfall time series and using wavelet cross spectral density analysis as outlined by Torrence and Compo (1998), reveals considerable power in the global cross power spectra around the 11 year solar cycle period for all the indices considered. In particular the global cross power spectra for AISMR, WCI and HIM rainfall with the group sunspot number reveal a significant peak at the 11 year period at confidence levels of or higher. Greater solar activity seems to be associated in all cases with greater rainfall, although at significance levels that are distinctly high in 3 and lower in 4 out of 7 cases studied. This regional variation is not inconsistent with the simulations of Haigh et al. (2004), which suggest that a major effect of higher solar activity may be a displacement in the Hadley cell. Such a displacement, depending on its magnitude, can have different effects on rainfall in different regions.
Acknowledgements.
The authors would like to thank Prof. A Rai Choudhuri, of the Physics Department of Indian Institute of Science, for his help on the solar data. The authors are grateful to the Centre for Atmospheric and Oceanic Sciences of the Indian Institute of Science for their continued hospitality.References
- [1] Beer et al., Use of 10Be in polar ice to trace the 11-year cycle of solar activity, Nature, 347, 164–166, 1990.
- [2] Crow et al., Statistics Manual, Dover Publications, Inc. New York, 1960.
- [3] Fligge et al., Determination of solar cycle length variations using the continuous wavelet transform, Astronomy and Astrophysics, 346, 313-321, 1999.
- [4] Haigh J. D., The impact of solar variability on climate, Science, 272, 981–984, 1996.
- [5] Haigh J. D., A GCM study of climate change in response to the 11-year solar cycle, Q. J. R. Meteorological Society, 125, 871–892, 1999.
- [6] Haigh J. D., Climate variability and the influence of the sun, Science, 294, 2109–2111, 2001.
- [7] Haigh et al., The response of tropospheric circulation to perturbations in lower stratospheric temperature, Preprint, 2004.
- [8] Iyengar R. N. and Raghu Kanth S. T. G., Intrinsic mode functions and a strategy for forecasting Indian monsoon rainfall, Meteorology and Atmospheric Physics, (in press), 2004.
- [9] Jagannathan P. and Bhalme H. N., Changes in the Pattern of Distribution of Southwest Monsoon Rainfall Over India Associated with Sunspots, Monthly Weather Review, 101,9 691–700, 1973.
- [10] Jagannathan P. and Parthasarathy B., Trends and periodicities of rainfall over India,Monthly Weather Review, 101, 371–375, 1973.
- [11] Kailas S.V. and Narasimha R., Quasi-cycles in monsoon rainfall using wavelet analysis, Current Science,78 , 592–595, 2000.
- [12] Labitzke K. and van Loon H., The signal of the 11-year sunspot cycle in the upper troposphere-lower stratosphere, Space Science Reviews, 80, 393–410,1997.
- [13] Lassen K. and Friis-Christensen E., Variability of the solar cycle length during the past five centuries and the apparent association with terrestrial climate, Journal of Atmospheric and Terrestrial Physics, 57, 8, 835–845, 1995.
- [14] Lau K. M. and Weng H., Climate Signal Detection Using Wavelet Transform: How to make a time series sing, Bulletin of the American Meteorological Society, 76, 12, 2391-2402, 1995.
- [15] Mehta V. and Lau K.M., Influence of solar irradiance on the Indian monsoon-ENSO: relation at decadal-multidecadal time scales, Geophysical Research Letters, 24, 159–162, 1997.
- [16] Narasimha R. and Kailas S. V., A Wavelet Map of Monsoon Variability, Proceedings of the Indian National Science Academy, 67, 327–341, 2001.
- [17] Neff et al., Strong coherence between solar variability and the monsoon in Oman between 9 and 6 kyr ago, Nature, 411, 290–293, 2001.
- [18] Parthasarathy et al., Homogeneous Indian Monsoon Rainfall: Variability and Prediction. Proceedings, Indian Academy of Science (Earth and Planetary Science), 102, 121–155, 1993.
- [19] Parthasarathy et al., Monthly and seasonal rainfall series for all-India homogeneous regions and meteorological subdivisions: 1871-1994, Research Report no. RR-065, Indian Institute of Tropical Meteorology, Pune., 1995.
- [20] Rai Choudhuri A.,The solar dynamo, Current Science, 77, 11, 1475–1486, 1999.
- [21] Torrence C. and Compo G. P., A Practical Guide to Wavelet Analysis, Bulletin of the American Meterological Society 79, 1, 61–78, 1998.
- [22] Visser et al., Magnitude and timing of temperature change in the Indo-Pacific warm pool during deglaciation, Nature, 421, 152–155, 2003.