Also at ]Physics Department, University College London, Gower Street, London, WC1E 6BT, UK
Two-photon photo-ionization of the Ca level in an optical dipole trap
Abstract
We report an optical dipole trap for calcium. The trap is created by focusing a 488 nm argon-ion laser beam into a calcium magneto-optical trap. The argon-ion laser photo-ionizes atoms in the trap because of a near-resonance with the level. By measuring the dipole trap decay rate as a function of argon-ion laser intensity, we determine the photo-ionization cross section at our wavelength to be approximately 230 Mb.
pacs:
32.80.Pj, 32.80.Rm, 33.80.EhI Introduction
Laser-cooling experiments have expanded in recent years to group II metals. This is partially due to a growing interest in optical frequency standards ruschewitz98 ; oates99 ; riehle99 . Calcium, strontium, and ytterbium all have narrow resonances from the ground state at relatively convenient laser wavelengths. The major isotopes of these elements have no angular momentum in the ground state, making the narrow “clock” transition frequencies less sensitive to external fields. Other experiments, such as metastable collision studies, photo-associative spectroscopy and quasi-molecule formation, Bose-Einstein condensation in simple atomic systems, and ultracold plasma investigations also contribute to the growing interest in laser-cooling alkaline-earth metals.
The atomic density in dipole traps can be much higher than in magneto-optical traps. For some experiments, such as Bose-Einstein condensation, photo-association, cold plasmas, and collision studies, higher densities can be helpful. Dipole traps for alkaline-earth atoms may also improve the performance of atomic clock experiments. For example, atoms can be held in a dipole trap generated by a laser at the so-called “magic wavelength” where the ac Stark shift is exactly equal for both atomic levels in the clock transition takamoto03 ; degenhardt04 . This would make it possible to use trapped neutral atoms for the clock, increasing the maximum interrogation time and therefore increasing the accuracy of the clock.
Only a few experiments have explored optical dipole traps for alkaline-earth atoms. The absence of angular momentum in the ground state prevents sub-Doppler cooling using resonance transitions ye03 , complicating dipole trap loading. However, advanced cooling techniques can reduce the atomic temperature to a few microKelvin, and dipole traps in Sr katori99 ; katori03 and Yb takasu03a ; takasu03b have been reported in the literature. We are also aware of a ground-state calcium dipole trap reported in a Ph.D. thesis degenhardt04a .
In this paper we report an optical dipole trap for calcium. Our trap captures mK atoms in the excited metastable state. Because the atomic temperature is relatively high, the dipole trap operates in the regime where the light-shift is several times larger than the natural atomic transition linewidth heinzen93 . The high intensities required to capture these atoms is also high enough to photo-ionize them. By measuring the photo-ionization production rate and the trap lifetime as a function of dipole trap laser intensity, we determine the effective lifetime in our system and photon-ionization cross section.
II Magneto-optical trap
The calcium MOT is formed by three pairs of counter-propagating laser beams that intersect at right angles in the center of a magnetic quadrupole field raab87 . The 423 nm laser light required for the calcium MOT is generated by frequency-doubling an infrared laser in KNbO3, and has been described previously ludlow01 . A diode laser master-oscillator-power-amplifier (MOPA) system delivers 300 mW single frequency at 846 nm, as shown in Fig. 1. This laser is phase-locked to a build-up cavity using the Pound-Drever-Hall technique pound83 , giving a power enhancement of 30. A 10mm long a-cut KNbO3 crystal in the small waist of the build-up cavity is used to generate 45 mW output power at 423 nm via non-critical phase matching at a temperature of C ludlow01 .
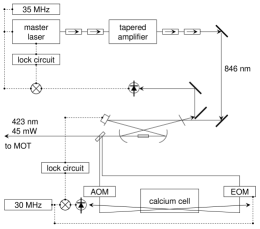
The laser is further stabilized by locking the 423 nm light to the calcium resonance transition using saturated absorption spectroscopy in a calcium vapor cell libbrecht95 . An acousto-optic modulator (AOM) in one arm of the saturated absorption laser beams shifts the laser frequency so that the laser beam sent to the MOT is 35 MHz (one natural linewidth) below the atomic resonance. We also use the AOM to chop this beam and use a lock-in amplifier to eliminate the Doppler background in the saturated absorption signal. Because the 846 nm laser is already locked to the frequency-doubling cavity, the feedback from this second lock circuit servos the frequency-doubling cavity length.
The trap is loaded from a thermal beam of calcium atoms that passes through the center of the MOT. The thermal beam is formed by heating calcium in a stainless steel oven to C. The beam is weakly collimated by the 1mm diameter, 10mm long aperture in the oven wall. As the beam passes through the MOT, the slowest atoms in the velocity distribution are cooled and trapped. An additional red-detuned (140 MHz, or four times the natural linewidth) laser beam counter-propagates the calcium atomic beam, significantly enhancing the MOT’s capture efficiency. The density profile of the MOT is approximately Gaussian, with a -radius of 0.5 mm and a peak density of cm-3. The lifetime of the MOT is limited by optical pumping to the state (see Fig. 2).
III Optical dipole trap
The dipole trap is formed by focusing a 488 nm argon-ion laser beam in the center of the MOT. The interaction of the laser beam with the atoms is easily described in terms of the AC-Stark shift. The electric field of the laser beam induces a polarization in the atom. The interaction of these two fields gives rise to the potential. A rotating wave approximation of this interaction leads to the well-known optical potential or “light shift”:
| (1) |
where is Planck’s constant divided by 2, is 2 times the natural line width, and is the saturation intensity, is the speed of light, is the wavelength of the atomic transition, is the detuning of the laser from the atomic transition in rad/s, and is the intensity of the laser beam. For multi-level atoms with many transitions from a given state, the light shift calculation in Eq. 1 is extended by summing contributions from all of the transitions connected to the level, replacing with the appropriate Einstein-A coefficients. We use the data tabulated in Refs. nist ; kurucz .
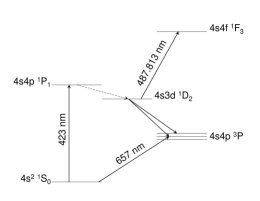
The 488 nm argon-ion laser wavelength is near-resonant with the transition (). For a 1 W laser beam focused to a 20m Gaussian waist, the optical potential depth is mK. Such a deep potential is required to trap our relatively hot calcium atoms. The atomic temperature is near the Doppler limit of laser cooling using the 423 nm transition.
Dipole traps for heavier group II atoms have been reported. Those experiments cooled on the intercombination lines, which have a much lower Doppler limit. This could be done in calcium, especially in conjunction with quenched cooling binnewies01 ; curtis03 or two-photon cooling filho03 . However, no reports have been published to our knowledge.
IV Dipole trap loading
We load the dipole trap while the MOT light is on. The dipole trap fills up with atoms optically pumped into the state in the region of the 488 nm laser beam focus. Other atoms from outside the focal region pass through the dipole trap, but there is no dissipative cooling mechanism to capture them.
Some of the atoms are ionized by the 488 nm laser beam via a two-photon transition to the continuum. This photo-ionization pathway is enhanced by a near-resonance with the level. As discussed below, it is probably further enhanced by a near-resonance in the Rydberg series leading up to the Ca II ionization limit.
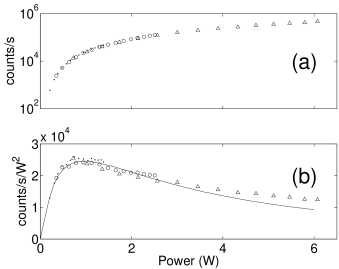
We measure the ion production rate for different 488 nm laser beam intensities channeltron . Sample data is plotted in Fig. 3(a). This data is re-plotted in Fig. 3(b) with the ion production rate divided by the laser power squared. This ratio is proportional to the number of atoms in the laser focus, and in the absence of a dipole trap, this signal should be a flat line. At low powers, the number of atoms in the dipole trap increases as the trap depth increases. The trap number maximizes when the average well depth is a few times the Doppler temperature. At higher power, the trap number fall off because the 488 nm laser beam shifts the and levels out of resonance with the MOT laser, reducing the efficiency of the optical pumping loading mechanism. We performed a Monte-Carlo simulation of trap loading and found agreement with our data, as plotted in Fig. 3b.
At higher laser powers, the ion production rate is somewhat higher than expected. This occurs when the light-shift of the and levels due to the 488 nm laser beam exceeds the natural linewidth. This is precisely the condition under which ground-state atoms can be captured in the dipole trap. For these atoms the trap depth is comparable to the atom temperature (the Doppler cooling limit). Such an arrangement would increase the density of ground-state atoms, making the loading rate due to optical pumping higher at higher powers.
We can estimate the number of atoms in our dipole trap using a simple rate equation. For deep optical potentials in steady state conditions, this is equal to the trap loading rate multiplied by the trap lifetime. The loading rate is equal to the optical pumping rate multiplied by the dipole trap volume, and divided by the MOT volume. Because the confocal parameter of the 488 nm laser beam exceeds the MOT dimension, and because the dipole trap oscillation period along the symmetry axis is long compared to the lifetime, we can assume that the volume ratio is just the square of the laser beam waist divided by the square of the Gaussian size of the MOT cloud. The number of atoms in the dipole trap, , can be written as
| (2) |
where is the saturation parameter, is the number of ground state atoms in the trap, is the dipole trap lifetime, s-1 is the Einstein A coefficient for the transition, and is the Gaussian radius of the MOT. Depending on the beam waist and laser power, this simple model tells us that we load up to 2000 atoms into the trap, for a peak density of approximately cm-3. By comparison, the background density of atoms is given by Eq. 2 without the volume ratio, and with the numbers and replaced by densities. The background density is cm-3.
In view of these numbers, it is perhaps surprising that at the lowest laser powers we can detect a small number of atoms in the dipole trap, and discriminate against the background atoms. But the background atoms roll through the trap in a few s, and the trapped atoms remain in the trap approximately 100 times longer. The photo-ionization probability increases with the time spent in the 488 nm laser focus, so the ionization signal is predominantly from the trapped atoms.
V Two-photon photoionization rate
We measure the lifetime of the dipole trap by blocking the MOT laser beams, and measuring the decay of the ion signal. The three most important decay mechanisms are radiative decay of the level, collisional decay due to hot atoms from the thermal atomic beam, and two-photon ionization of the atoms. Because we do not have a suitable method for turning off the thermal beam, we cannot reliably extract the radiative lifetime. Published values of the lifetime are around 2 ms pasternack80 ; husain86 ; drozdowski93 ; porsev01 ; fischer03 , somewhat longer than measured in our experiment. While our experiment cannot determine the radiative lifetime, by measuring the decay rate as a function of 488 nm laser intensity we can determine the photo-ionization cross-section.
A rate-equation for level decay in the dipole trap after the loading has turned off is
| (3) |
where is the two-photon ionization rate coefficient. This has the well-known solution
| (4) |
In second-order perturbation theory, two-photon ionization is written as an overlap of the initial and final states summed over all possible intermediate states, divided by an energy denominator. For near-resonant ionization, the energy denominator makes the near-resonant term dominant, collapsing the sum to just one term. This one term looks like the product of the probability that an atom is excited into the state multiplied by the probability of photo-ionizing out of that state. We can write this term as
| (5) | |||||
| (6) |
where is the one-photon photo-ionization cross section. The approximation in Eq. 6 assumes that and . In our experiment, the intensity of the 488 nm laser has a Gaussian spatial profile. Averaging the square of the intensity over the laser profile allows us to relate the photo-ionization rate to the total laser power. In this case, it can be written as
| (7) |
The dipole trap decay rate as a function of the square of the 488 nm laser power squared is shown in Fig. 4. For each power level, we measured the dipole trap decay. At sufficiently low power levels, this decay is approximately exponential, and we extract the decay rate using a least-squares fitting routine i-squared . The decay rate depends on power. The zero-extrapolated decay rate is kHz. This rate is approximately twice the radiative decay rate. We see evidence in our experiment that our rate is significantly influenced by collisions with atoms in the thermal atomic beam. This is not surprising because the dipole trap sits in the middle of the thermal atomic beam. Without detailed characterization of the thermal beam, we cannot reliably extract a thermal-atom--atom collision cross-section.
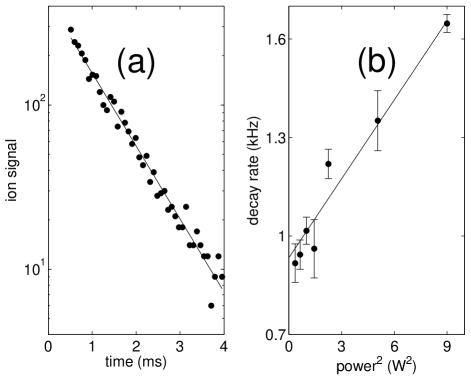
The slope of the decay rate with power is Hz/W2. Using Eq. 7, we can determine the photo-ionization cross section. This gives a photo-ionization cross-section for the level of cm2. This extraordinarily large cross section suggests that the final state lies near a Rydberg state in the continuum. The final state is 133 cm-1 below the Ca II ionization limit. The principle quantum of hydrogenic Rydberg levels in this region are , and the separation between levels is 9 cm-1. Our measurements are carried out in the presence of an electric field, further increasing the probability of finding a nearby Rydberg level. The NIST database tabulates only odd parity levels in this energy region. We are unaware of applicable quantum defect calculations or measurements.
VI Conclusion
We have demonstrated an optical dipole trap for neutral calcium atoms. These atoms are non-adiabatically loaded into the trap by an optical pumping mechanism. The lifetime of our trap is limited by the ms lifetime of the atoms and by collisions with atoms in the thermal atomic beam.
Our initial interest in the calcium optical dipole trap was its potential application to our ultracold plasma research. It may be possible to use the dipole trap as the beginning point for ultracold plasma expansion studies. Because of the high aspect ratio, a plasma generated from a dipole trap would be a two-dimensional ultracold neutral plasma at early times. Correlation heating would be reduced compared to the three-dimensional case chen04 , bringing the two-dimensional plasma closer to the strongly-coupled regime. Furthermore, the plasma expansion depends on the exact density distribution of the initial cloud. Compared to standard MOT traps, a dipole trap has a well-defined density profile, meaning that these new plasmas could greatly improve the reproducibility of plasma expansion experiments. We plan to explore these possibilities in future work.
VII Acknowledgements
This work was supported in part by grants from the Research Corporation and the National Science Foundation (Grant No. PHY-9985027).
References
- (1) F. Ruschewitz, J. L. Peng, H. Hinderth r, N. Schaffrath, K. Sengstock, and W. Ertmer, Phys. Rev. Lett. 80, 3173 (1998)
- (2) C. W. Oates , F. Bondu, R. W. Fox , and L. Hollberg, Eur. Phys. J. D 7, 449 (1999)
- (3) F. Riehle et al., IEEE Trans. Instrum. Meas. 48, 613 (1999)
- (4) M. Takamoto and H. Katori, Phys. Rev. Lett. 91, 223001 (2003)
- (5) C. Degenhardt, H. Stoehr, U. Sterr, F. Riehle, and C. Lisdat, Phys. Rev. A 70, 023414 (2004)
- (6) We note that sub-Doppler single-stage cooling of the odd-isotope 87Sr was demonstrated in Xinye Xu, Thomas H. Loftus, Josh W. Dunn, Chris H. Greene, John L. Hall, Alan Gallagher, and Jun Ye, Phys. Rev. Lett. 90, 193002 (2003)
- (7) H. Katori, T. Ido, and M. K.-Gonokami, J. Phys. Soc. Japan 68, 2479 (1999)
- (8) M. Takamoto and H. Katori, Phys. Rev. Lett. 91, 223001 (2003)
- (9) Y. Takasu et al, Phys. Rev. Lett. 90, 023003 (2003)
- (10) Y. Takasu et al., Phys. Rev. Lett. 91, 040404 (2003)
- (11) Carsten Degenhardt, “Free and trapped calcium atoms for an optical frequency standard,” Ph.D. thesis, University of Hannover (2004). Chapter 5 in this thesis describes a dipole trap created with an Ar-ion laser at 514 nm. They focused 8 W to a waist of 150 m for a trap depth of roughly 30 K. They loaded the dipole trap from an ultracold ensemble of “quench-cooled” atoms.
- (12) J. D. Miller, R. A. Cline, and D. J. Heinzen, Phys. Rev. A 47, R4567 (1993)
- (13) E. L. Raab, M. Prentiss, Alex Cable, Steven Chu, and D. E. Pritchard Phys. Rev. Lett. 59, 2631 (1987)
- (14) A. D. Ludlow, H. M. Nelson, and S. D. Bergeson J. Opt. Soc. Am. B 18, 1813 (2001)
- (15) R. W. P. Drever, J. L. Hall, F. V. Kowalski, J. Hough, G. M. Ford, A. J. Munley, and H. Ward, Appl. Phys. B 31 97 (1983)
- (16) K. G. Libbrecht, R. A. Boyd, P. A. Willems, T. L. Gustavson, and D. K. Kim Am. J. Phys. 63, 729 (1995)
-
(17)
The NIST Atomic Data Center critically evaluates and compiles
transition probability data. It can be accessed through their
web site at http://physics.nist.gov/cgi-bin/AtData/main
_asd . The paper version of the data for calcium can be found in Atomic Transition Probabilities (Na through Ca - A Critical Data Compilation), W. L. Wiese, M. W. Smith, and B. M. Miles, Natl Stand. Ref. Data Ser., Natl Bur. Stand. (U.S.), NSRDS-NBS 22, Vol. II (1969). Improved transition probabilities, when available, are found in J. R. Fuhr and W. L. Wiese, “Atomic Transition Probabilities,” published in the CRC Handbook of Chemistry and Physics, 79th Edition, edited by D. R. Lide (CRC Press, Inc., Boca Raton, FL, 1998). - (18) R.L. Kurucz and B. Bell, “1995 Atomic Line Data,” Kurucz CD-ROM No. 23. Cambridge, Mass.: Smithsonian Astrophysical Observatory. This information is also available online at http://cfa-www.harvard.edu/amdata/ampdata/kurucz23/sekur.html
- (19) T. Binnewies et al., Phys. Rev. Lett. 87, 123002 (2001)
- (20) E. A. Curtis, C. W. Oates, and L. Hollberg, J. Opt. Soc. Am. B 20 977 (2003)
- (21) R. L. C. Filho et al., J. Opt. Soc. Am. B 20 994 (2003)
- (22) A weak electric field (5 V/cm) applied to high-transparency grids on either side of the MOT extracts the ions. The ions are detected using a channeltron (Burle model 4860) and counted in a multichannel scaler.
- (23) L. Pasternack, D. M. Silver, D. R. Yarkony, and P. J. Dagdigian, J. Phys. B 13, 2231 (1980)
- (24) D. Husain and G. Roberts, J. Chem. Soc., Faraday Trans. 2, 1921-1933 (1986)
- (25) R. Drozdowski, J. Kwela, and M. Walkiewicz, Z. Phys. D. 27, 321 (1993)
- (26) S. G. Porsev, M. G. Kozlov, Yu. G. Rakhlina, and A. Derevianko, Phys. Rev. A 64, 012508 (2001)
- (27) C. F. Fischer and G. Tachiev, Phys. Rev. A 68, 012507 (2003)
- (28) The trap depth is proportional to , and the photoionization signal is proportional to . At high laser powers, when atoms can be trapped even at large radii, it is possible that kinetic effects will skew the photo-ionization signal. Atoms trapped at the bottom of the potential will be ionized first, and atoms trapped at the edge of the potential will be ionized at a later time. For low enough laser powers, when the potential is too shallow to trap significant numbers of atoms, this effect should not influence the photo-ionization signal.
- (29) Y. C. Chen, C. E. Simien, S. Laha, P. Gupta, Y. N. Martinez, P. G. Mickelson, S. B. Nagel, and T. C. Killian, Phys. Rev. Lett. 93, 265003 (2004)