Ultracold Neutral Plasmas
Abstract
Ultracold neutral plasmas are formed by photoionizing laser-cooled atoms near the ionization threshold. Through the application of atomic physics techniques and diagnostics, these experiments stretch the boundaries of traditional neutral plasma physics. The electron temperature in these plasmas ranges from 1-1000 K and the ion temperature is around 1 K. The density can approach cm-3. Fundamental interest stems from the possibility of creating strongly-coupled plasmas, but recombination, collective modes, and thermalization in these systems have also been studied. Optical absorption images of a strontium plasma, using the Sr+ transition at 422 nm, depict the density profile of the plasma, and probe kinetics on a 50 ns time-scale. The Doppler-broadened ion absorption spectrum measures the ion velocity distribution, which gives an accurate measure of the ion dynamics in the first microsecond after photoionization.
1 Introduction
The study of ionized gases in neutral plasmas traditionally spans temperatures ranging from K in the magnetosphere of a pulsar to K in the earth’s ionosphere. Ultracold neutral plasmas [1], formed by photoionizing laser-cooled atoms near the ionization threshold, stretch the boundaries of these studies. The electron temperature ranges from 1-1000K and the ion temperature is around 1 K. The density can approach cm-3.
Fundamental interest in these systems stems from a range of phenomena in the ultracold regime. It is possible to form strongly-coupled plasmas [2] - systems in which the electrical interaction energy between the charged particles exceeds the average kinetic energy. This reverses the traditional energy hierarchy that underlies our normal understanding of plasmas based on concepts such as Debye screening and hydrodynamics. Strongly-coupled plasmas appear in exotic environments, such as dense astrophysical systems [3], matter irradiated with intense-laser fields [4, 5], dusty plasmas of highly charged macroscopic particles [6], or non-neutral trapped ion plasmas [7] that are laser-cooled until they freeze into a Wigner crystal. Ultracold plasmas are excellent systems in which to study strong-coupling achieved at relatively low-density in neutral systems where recombination, collective modes, and thermalization are all interesting things to explore.
Early experiments with ultracold neutral plasmas used charged particle detection techniques to study methods and conditions for forming the plasma[1], excitation and detection of plasma oscillations[8], dynamics of the plasma expansion[8], and collisional recombination into Rydberg atomic states[9]. In related experiments, researchers at the University of Virginia and Laboratoire Aimé Cotton, Orsay, France studied the spontaneous evolution of a dense, cold cloud of Rydberg atoms into a plasma [10].
Optical absorption imaging and spectroscopy, demonstrated [11] using the Sr+ transition in a strontium plasma, opens many new possibilities. Images depict the density profile of the plasma, and the Doppler-broadened absorption spectrum measures the ion velocity distribution. Both can probe ion dynamics with 50 ns resolution. This paper will concentrate on the physics we have learned from plasma imaging. A review of the results from studies using charged particle diagnostics can be found in [12].
Section 2 provides an overview of the creation of an ultracold neutral plasma and the absorption imaging technique. Section 3 discusses the dynamics of the ions during the first few microseconds after photoionization. Section 4 describes the ion absorption spectrum, and Sec. 5 describes recent studies of plasma equilibration.
2 Experimental Overview
The recipe for an ultracold neutral plasma starts with laser-cooled and trapped neutral atoms[14]. Photons from properly arranged laser beams scatter off the atoms to generate the forces for cooling and trapping. Alkali atoms, alkaline-earth atoms, and metastable noble gas atoms are the most common atoms for these experiments because they posses electric-dipole allowed transitions at convenient laser wavelengths. The normal trapping configuration is called a magneto-optical trap (MOT) (Fig. 1 and 2) [13]. In the experiments described here, the neutral atom cloud is characterized by a temperature of a few mK and a density distribution given by , with mm and cm-3. The number of trapped atoms is typically . These parameters can be adjusted. In particular, turning off the trap and allowing the cloud to expand yields larger samples with lower densities.
![[Uncaptioned image]](/html/physics/0410019/assets/x1.png) Figure 1: Strontium atomic and ionic energy levels involved in the experiment, with decay rates.
(A) Neutral atoms are laser cooled and trapped in a magneto-optical trap (MOT) operating on the
transition at 460.9 nm, as
described in [13]. Atoms excited to the level by
the MOT lasers are ionized by photons from a laser at nm.
(B) Ions are imaged using the transition at nm.
ions decay to the state 7% of the time, after which
they cease to interact with the imaging beam.
This does not complicate the experiment because ions typically
scatter fewer than one photon during the time the imaging beam is
on.
Figure 1: Strontium atomic and ionic energy levels involved in the experiment, with decay rates.
(A) Neutral atoms are laser cooled and trapped in a magneto-optical trap (MOT) operating on the
transition at 460.9 nm, as
described in [13]. Atoms excited to the level by
the MOT lasers are ionized by photons from a laser at nm.
(B) Ions are imaged using the transition at nm.
ions decay to the state 7% of the time, after which
they cease to interact with the imaging beam.
This does not complicate the experiment because ions typically
scatter fewer than one photon during the time the imaging beam is
on.
![[Uncaptioned image]](/html/physics/0410019/assets/x2.png) Figure 2: From [11].
Experimental schematic for strontium plasma experiments.
The MOT for neutral atoms consists of a pair of anti-Helmholtz magnetic
coils and 6 laser-cooling beams. Atoms from a Zeeman-slowed
atomic beam enter the MOT region and are trapped.
atoms are ionized by the photoionizing laser.
The imaging beam passes through the plasma and
falls on a CCD camera.
Figure 2: From [11].
Experimental schematic for strontium plasma experiments.
The MOT for neutral atoms consists of a pair of anti-Helmholtz magnetic
coils and 6 laser-cooling beams. Atoms from a Zeeman-slowed
atomic beam enter the MOT region and are trapped.
atoms are ionized by the photoionizing laser.
The imaging beam passes through the plasma and
falls on a CCD camera.
To form the plasma, the MOT magnets are turned off and atoms are ionized with photons from the cooling laser and from a ns pulsed dye laser whose wavelength is tuned just above the ionization continuum (Fig. 1). Up to % of the neutral atoms are ionized, producing plasmas with a peak electron and ion density as high as cm-3. The density profiles, , follow the Gaussian shape of the neutral atom cloud.
Because of the small electron-ion mass ratio, the electrons have an initial kinetic energy approximately equal to the difference between the photon energy and the ionization potential, typically between 1 and K. The initial kinetic energy for the ions is close to the kinetic energy of neutral atoms in the MOT. As we will discuss below, the resulting non-equilibrium plasma evolves rapidly.
To record an absorption image of the plasma, a collimated laser beam, tuned near resonance with the principle transition in the ions, illuminates the plasma and falls on an image intensified CCD camera. The ions scatter photons out of the laser beam and create a shadow that is recorded by an intensified CCD camera. The optical depth () is defined in terms of the image intensity without () and with () the plasma present,
| (1) |
Figure 3 shows a typical absorption image. Section 4 describes how detailed information about the plasma is extracted from the optical depth.
![[Uncaptioned image]](/html/physics/0410019/assets/x3.png) Figure 3: Optical depth of an ultracold neutral plasma.
The delay between the formation of the plasma and
image exposure is ns. The plasma contains
ions and the initial peak ion density is cm-3.
Resolution is about m, limited
by pixel averaging to improve the signal-to-noise ratio.
Figure 3: Optical depth of an ultracold neutral plasma.
The delay between the formation of the plasma and
image exposure is ns. The plasma contains
ions and the initial peak ion density is cm-3.
Resolution is about m, limited
by pixel averaging to improve the signal-to-noise ratio.
3 Ion Dynamics
In order to understand the details of the image analysis, it is necessary to understand the dynamics of the plasma. The imaging probe is most sensitive to the ion dynamics, so we will concentrate on this topic. The behavior of electrons was studied experimentally in [1, 8, 9] and theoretically in [15, 16, 17].
Ions are created with very little kinetic energy, but their initial spatially uncorrelated state possesses significant Coulomb potential energy compared to the regular lattice that represents the ground state of the system [18, 7]. As ions equilibrate and correlations develop, the kinetic energy increases. This process is called disorder-induced heating, or correlation heating, and it has been discussed in many theoretical papers. Early interest was generated by non-equilibrium plasmas created by fast-pulse laser irradiation of solid targets, for example [19, 20, 21, 22], and the problem has been revisited in the context of ultracold neutral plasmas [15, 16, 23, 24].
Qualitatively, one expects the ion temperature after equilibration to be on the order of the Coulomb interaction energy between neighboring ions. A quantitative analysis [23], assuming complete initial disorder and incorporating the screening effects of the electrons, predicts an ion temperature of
| (2) |
Here, where is the Debye length. The quantity is the excess potential energy per particle in units of , where is the Wigner-Seitz radius, or interparticle distance. is the number of ions. has been studied with molecular dynamics simulations [25] for a homogeneous system of particles interacting through a Yukawa potential, , which describes ions in the background of weakly coupled electrons111As the number of electrons per Debye sphere () approaches unity, the Yukawa interaction ceases to accurately describe ion-ion interactions. For strontium plasmas studied here, this situation only occurs for the highest and lowest . It will be interesting to test Eq. 2 for these conditions..
For typical strontium plasmas discussed here, , and m. ranges from to , so is close to as expected. is related to the Coulomb coupling parameter for electrons, , through . A system of particles with charge is strongly coupled when [2]. for the systems studied here, so the electrons are not strongly coupled. This avoids excessive complications that arise when approaches or initially exceeds unity, such as screening of the ion interaction [15], and rapid collisional recombination and heating of the electrons [15, 16, 17, 26], although we do see some signs of these effects, even in this regime. The ions typically equilibrate with K, which gives , so the ions are strongly coupled.
The time scale for disorder-induced heating is the inverse of the ion plasma oscillation frequency, , which is on the order of 100 nanoseconds. Physically, this is the time for an ion to move about an interparticle spacing when accelerated by a typical Coulomb force of . This time scale is also evident in molecular dynamics simulations of ion-ion thermalization [15, 16, 19, 20, 21, 22, 23, 24].
For , the ions have equilibrated and the thermal energy of the electrons begins to dominate the evolution of the plasma. Electrons contained in the potential created by the ions exert a pressure on the ions that causes an outward radial acceleration. This was studied experimentally in [8] and theoretically by a variety of means in [17]. The experiments measured the final velocity that the ions acquired, which was approximately . With the imaging probe, we can now observe the expansion dynamics at much earlier times during the acceleration phase.
As discussed in [8] and [11], a hydrodynamic model, which describes the plasma on length scales larger than , shows that the pressure of the electron gas drives the expansion through an average force per ion of
| (3) |
where the electron and ion density distributions are . We assume thermal equilibrium for the electrons throughout the cloud [17].
The force leads to an average radial expansion velocity for the ions,
| (4) |
The velocity is correlated with position and increases linearly with time. This does not represent an increase in the random thermal velocity spread or temperature of the ions. Due to the large mass difference, thermalization of ions and electrons [15] is slow and occurs on a millisecond time scale.
Equation 4 for the average ion velocity assumes a constant electron temperature. Actually, as the plasma expands, electrons will cool. This can be thought of in terms of energy conservation or adiabatic expansion. It is possible to describe the expansion with a Vlasov equation that includes the changing electron temperature. For an initial Gaussian density distribution, the equations can be solved analytically and the expansion preserves the Gaussian shape with a density radius given by [17, 27, 28]. The experiments involving absorption imaging of the plasma, however, have concentrated on the first few microseconds of the expansion when the plasma size and electron temperature have not changed significantly. Thus we can safely use Eq. 4. The effects of the expansion are evident in the radial velocity that manifests itself in Doppler broadening of the ion absorption spectrum.
4 Doppler-Broadened Spectrum
![[Uncaptioned image]](/html/physics/0410019/assets/x4.png) Figure 4: Absorption spectra of ultracold neutral plasmas.
We plot the integral of the optical depth (Eq. 6).
The frequency is with respect to a Doppler-free absorption
feature in a strontium discharge cell.
Both spectra correspond to K and
an initial peak plasma density of
cm-3.
Data are fit with Voigt profiles, and the increase in
linewidth for longer is clear.
Figure 4: Absorption spectra of ultracold neutral plasmas.
We plot the integral of the optical depth (Eq. 6).
The frequency is with respect to a Doppler-free absorption
feature in a strontium discharge cell.
Both spectra correspond to K and
an initial peak plasma density of
cm-3.
Data are fit with Voigt profiles, and the increase in
linewidth for longer is clear.
To obtain quantitative information from the plasma images, we relate the (Eq. 1) to underlying physical parameters. Following Beer’s law, the for a laser propagating along the z axis is
| (5) |
where is the ion density, and is the ion absorption cross section at the image beam frequency, . The absorption cross section is a function of temperature due to Doppler broadening, and since we expect the temperature to vary with density, we allow to vary with position. If we now integrate over x and y, or, in reality, sum over the image pixels multiplied by the pixel area, we get the spectrum
| (6) |
as a function of the image laser detuning222We can also fit to a two dimensional Gaussian, as described in [11], and identify , where and are the transverse sizes of the absorption profile, and is the peak optical depth. This sometimes has signal-to-noise ratio advantages over integrating the entire image, but both approaches should give the same result.. As we vary the detuning, we obtain absorption spectra as shown in Fig. 4. The rest of the paper will deal with the relationship between spectra such as these and the underlying temperature distributions of the ions.
The absorption cross section for ions in a region described by a temperature , is given by the Voigt profile
where is the Doppler width, and is the effective Lorentizian linewidth due to the natural linewidth of the transition, rad/s, and the laser linewidth, rad/s. The center frequency of the transition is , where nm. The “three-star” symbol, , accounts for the equal distribution of ions in the doubly degenerate ground state and the linear polarization of the imaging light [29]. We fit the spectrum to a single Voigt profile with effective temperature ,
| (8) |
where is the number of ions. We will explain below that is a good approximation of the average ion temperature in the plasma.
5 Recent Results
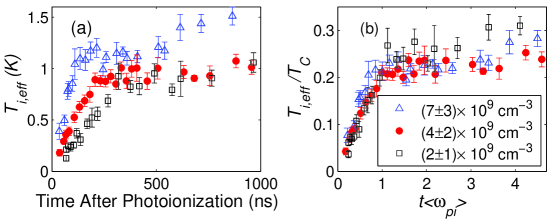
Fig 5(a) shows the evolution of for three different densities. The rapid increase in the temperature for ns is due to disorder-induced heating. This originates from conversion of Coluomb potential energy into kinetic energy as the ions evolve from a completely disordered state to one with some degree of spatial correlations. This was predicted in [23], and observed in numerical simulations [15, 26, 24] and the first experimental studies with optical imaging [11].
The time scale of the heating is the inverse ion plasma frequency ns. The energy scale is K, where is the Wigner-Seitz radius. Fig 5(b) shows the same data with time scaled by the average inverse plasma frequency and temperature scaled by . The three curves coincide very well in the time axis, but show slight deviation in the temperature axis. The deviation indicates the effects of electron screening of the ion-ion interaction. Electron screening is discussed in [30].
To quantitatively analyze the data in Figs. 5 we must account for the effect of the inhomogeneous density distribution [31]. We expect the ion temperature to vary with density because global thermal equilibrium occurs on a hydrodynamic time scale, , which is on the order of tens of s, where is the ion acoustic wave velocity. Local thermal equilibration occurs on a much faster time scale, [32]. For a range of reasonable temperature distribution, numerical simulations [31] show that . Here is the average ion temperature in the plasma. The extracted and Eq. 2 agree within our uncertainties of typically 0.2 K.
If the effective ion temperature is measured for longer delay times, acceleration of the ions by the electron pressure also becomes important. The effect is small for the data presented here, but its effect can be modelled [30, 31]. The acceleration of the ions then becomes a sensitive probe of the electron temperature which evolves under the influence of recombination, continuum lowering, disorder-induced heating, and adiabatic expansion [8, 11, 30, 17, 28].
From the measured , , and density distribution, we calculate the average Coulomb coupling constant for Debye-screend ions,
| (9) |
For all the data shown in Figs. 5 and in [30], is in the range of 1.7 to 2.5. With lower and higher density, is slightly higher. The surprisingly small variation in suggests that disorder-induced heating is a natural feedback mechanism that leads to equilibration just barely in the strongly coupled regime.
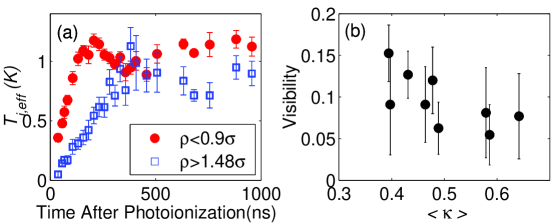
Close inspection of Figs. 5 reveals that at the end of the disorder-induced heating phase, the ion temperature overshoots it equilibrium value before settling. This phenomenon is more evident in Fig. 6(a), where is calculated for an inner and outer region of the plasma image ( and respectively). Each selected annular region contains 1/3 of the ions and probes a region with significantly less variation in density than in the entire plasma. The region with lower density has lower , supporting our hypothesis of local thermal equilibrium, but the oscillation is the most striking observation.
Intuitively, one can explain this phenomenon as an oscillation of each ion in its local potential energy well. A simple calculation implies that the time for an ion to move an interparticle distance, when accelerated from rest by a force of , varies as , and the observed oscillation occurs at . As expected from the density dependence of , the oscillation period is longer for the outer region where the average density is lower. This explains why averaging over the entire cloud obscures the oscillation; the motion dephases because of the variation in . It is questionable whether the ion motion should be called an ion plasma oscillation or not, because there is probably no collective, or long range coherence to the motion.
Kinetic energy oscillations at have been observed in molecular dynamics simulations of equilibrating strongly-coupled systems [20, 22, 24]. Calculations [33, 34] also show oscillations in the velocity autocorrelation function in equilibrium strongly-coupled one-component plasmas. To our knowledge, this is the first experimental observation of the phenomenon.
Numerical results[20] suggest that the damping time for the oscillations is approximately for , and that lower leads to faster damping. Because our analysis still averages over the z-axis of the plasma, which introduces dephasing into the observed oscillations, it is difficult to comment on the damping of the oscillation. But we do find a correlation between the visibility of the oscillation and , as shown in Fig. 6(b), suggesting that electron screening plays a role in the damping. The visibility is defined as , where and are effective ion temperatures at the peak and dip of the oscillation.
In conclusion, we have developed absorption imaging as a tool for studying ultracold neutral plasmas [11]. The absorption spectrum, after accounting for the inhomogeneous plasma density distribution, measures the average ion temperature. Equilibration of the plasma shows the effect of disorder-induced heating. The screening effect of electrons on the final ion temperature has been studied, and experiment and theory agree very well [30]. The ion kinetic energy also displays oscillations that are characteristic of equilibrating strongly coupled plasmas.
Many future experiments suggest themselves. Some of the most interesting are investigating dynamics when the initial electron Coulomb coupling parameter is large and recombination and disorder-induced electron heating are expected to dominate the plasma evolution. Detailed examination of ion and electron thermalization at the border of the strongly coupled regime is also possible. Quantitative study of the kinetic energy oscillations is also necessary in order to develop a better understanding of aspects of the phenomenon such as damping. Improvements in imaging optics will also increase the image signal-to-noise ratio and allow study of features on the ion density distribution with m experimental resolution.
The fact that strontium ions scatter blue light so efficiently suggests one of the most exciting future directions for studies of ultracold nuetral plasmas. It may be possible to use laser light to cool and trap the ions in a strontium ultracold neutral plasma [12], just as lasers are used to cool and trap neutral atoms. Confining the ions would also confine the electrons through Coulomb attraction. This would be an entirely new method of plasma confinement and may also lead to drastically lower plasma temperatures and stronger coupling for the ions.
This research was supported by the Department of Energy Office of
Fusion Energy Sciences, National Science Foundation, Office for
Naval Research, Research Corporation, Alfred P. Sloan Foundation,
and David and Lucille Packard Foundation.
References
- [1] T. C. Killian, S. Kulin, S. D. Bergeson, L. A. Orozco, C. Orzel, and S. L. Rolston. Creation of an ultracold neutral plasma. Phys. Rev. Lett., 83(23):4776, 1999.
- [2] S. Ichamuru. Strongly coupled plasmas: high-density classical plasmas and degenerate electron liquids. Rev. Mod. Phys., 54(4):1017, 1982.
- [3] H. M. Van Horn. Dense astrophysical plasmas. Science, 252:384, 1991.
- [4] M. Nantel, G. Ma, S. Gu, C. Y. Cote, J. Itatani, and D. Umstadter. Pressure ionization and line merging in strongly coupled plasmas produced by 100-fs laser pulses. Phys. Rev. Lett., 80(20):4442, 1998.
- [5] E. Springate, N. Hay, J. W. G. Tisch, M. B. Mason, T. Ditmire, M. H. R. Hutchinson, and J. P. Marangos. Explosion of atomic clusters irradiated by high-intensity laser pulses: Scaling of ion energies with cluster and laser parameters. Phys. Rev. A, 61:063201, 2000.
- [6] G. E. Morfill, H. M. Thomas, U. Konopka, and M. Zuzic. The plasma condensation: Liquid and crystalline plasmas. Phys. Plasmas, 6(5):1769, 1999.
- [7] T. B. Mitchell, J. J. Bollinger, X. -P. Huang, W. M. Itano, and D. H. E. Dubin. Direct observations of the structural phases of crystallized ion plasmas. Phys. Plasmas, 6(5):1751, 1999.
- [8] S. Kulin, T. C. Killian, S. D. Bergeson, and S. L. Rolston. Plasma oscillations and expansion of an ultracold neutral plasma. Phys. Rev. Lett., 85(2):318, 2000.
- [9] T. C. Killian, M. J. Lim, S. Kulin, R. Dumke, S. D. Bergeson, and S. L. Rolston. Formation of Rydberg atoms in an expanding ultracold neutral plasma. Phys. Rev. Lett., 86(17):3759, 2001.
- [10] M. P. Robinson, B. L. Tolra, M. W. Noel, T. F. Gallagher, and P. Pillet. Spontaneous evolution of rydberg atoms into an ultracold plasma. Phys. Rev. Lett., 85(21):4466, 2000.
- [11] C. E. Simien, Y. C. Chen, P. Gupta, S. Laha, Y. N. Martinez, P. G. Mickelson, S. B. Nagel, , and T. C. Killian. Using absorption imaging to study ion dynamics in an ultracold neutral plasma. Phys. Rev. Lett., 92(14):143001, 2004.
- [12] T. C. Killian, V. S. Ashoka, P. Gupta, S. Laha, S. B. Nagel, C. E. Simien, S. Kulin, S. L. Rolston, and S. D. Bergeson. Ultracold neutral plasmas: recent experiments and new prosects. J. Phys. A: Math. Gen., 36:6077, 2003.
- [13] S. B. Nagel, C. E. Simien, S. Laha, P. Gupta, V. S. Ashoka, and T. C. Killian. Magnetic trapping of metastable atomic strontium. Phys. Rev. A, 67:011401, 2003.
- [14] H. J. Metcalf and P. van der Straten. Laser Cooling and Trapping. Springer-Verlag New York, New York, 1999.
- [15] S. G. Kuzmin and T. M. O’Neil. Numerical simulation of ultracold plasmas. Phys. Plasmas, 9(9):3743, 2002.
- [16] S. Mazevet, L. A. Collins, and J. D. Kress. Evolution of ultracold neutral plasmas. Phys. Rev. Lett., 88(5):55001, 2002.
- [17] F. Robicheaux and J. D. Hanson. Simulated expansion of an ultra-cold, neutral plasma. Phys. Plasmas, 10(6):2217, 2003.
- [18] T. B. Mitchell, J. J. Bollinger, D. H. E. Dubin, X. -P. Huang, W. M. Itano, and R. H. Baughman. Direct observations of structural phase transitions in planar crystallized ion plasmas. Science, 282:1290, 1998.
- [19] M. Bonitz, D. Semkat, and D. Kremp. Short-time dynamics of correlated many-particle systems: Molecular dynamics versus quantum kinetics. Phys. Rev. E, 56(1):1246, 1997.
- [20] G. Zwicknagel. Molecular dynamics simulations of the dynamics of correlations and relaxation in an ocp. Contrib. Plasma Phys., 39:155, 1999.
- [21] K. Morawetz, M. Bonitz, V. G. Morozov, G. Röpke, and D. Kremp. Short-time dynamics with initial correlations. Phys. Rev. E, 63:020102, 2001.
- [22] I. V. Morozov and G. E. Norman. Non-exponential dynamic relaxation in strongly nonequilibrium nonideal plasmas. J. Phys. A: Mah. Gen., 36:6005, 2003.
- [23] M. S. Murillo. Using fermi statistics to create strongly coupled ion plasmas in atom traps. Phys. Rev. Lett., 87(11):115003, 2001.
- [24] T. Pohl, T. Pattard, and J. M. Rost. On the possibility of ‘correlation cooling’ of ultracold neutral plasmas. J. Phys. B: At. Mol. Opt. Phys., 37:183, 2004.
- [25] R. T. Farouki and S. Hamaguchi. Thermodynamics of strongly-coupled Yukawa systems near the one-component-plasma limit. II. Molecular dynamics simultations. J. Chem. Phys., 101(11):9885, 1994.
- [26] A. N. Tkachev and S. I. Yakovlenko. Moderation of recombination in an ultracold laser-produced plasma. Quantum Electronics, 30(12):1077, 2000.
- [27] D. S. Dorozhkina and V. E. Semenov. Exact solution of vlasov equations for quasineutral expansion of plasma bunch into vacuum. Phys. Rev. Lett., 81(13):2691, 1998.
- [28] T. Pohl, T. Pattard, and J. M. Rost. Coulomb crystallization in expanding laser-cooled neutral plasmas. Phys. Rev. Lett., 92(15):155003, 2004.
- [29] A. E. Siegman. Lasers. University Science Books, Sausolito, California, 1986.
- [30] Y. C. Chen, C. E. Simien, P. Gupta, S. Laha, Y. N. Martinez, P. G. Mickelson, S. B. Nagel, and T. C. Killian. Submitted Phys. Rev. Lett.
- [31] T. C. Killian, Y. C. Chen, P. Gupta, S. Laha, Y. N. Martinez, P. G. Mickelson, S. B. Nagel , A. D. Saenz, and C. E. Simien. Submitted J. Phys. B., arXiv/physics/0407138.
- [32] T. Pohl, T. Pattard, and J. M. Rost, arXiv/physics/0405125.
- [33] J. P. Hansen, E. L. Pollock, and I. R. McDonald. Velocity autocorrelation funtion and dynamical structure factor of the classical one-component plasma. Phys. Rev. Lett, 32(6):277, 1974.
- [34] J. P. Hansen, I. R. McDonald, and E. L. Pollock. Statistical mechanics of dense ionized matter. III. Dynamical properties of the classical one-component plasma. Phys. Rev. A, 11(3):1025, 1975.