Absorption of Scintillation Light in a 100 Liquid Xenon Ray Detector and Expected Detector Performance
Abstract
An 800 liquid xenon scintillation ray detector is being developed for the MEG experiment which will search for decay at the Paul Scherrer Institut. Absorption of scintillation light of xenon by impurities might possibly limit the performance of such a detector. We used a 100 prototype with an active volume of mm3 to study the scintillation light absorption. We have developed a method to evaluate the light absorption, separately from elastic scattering of light, by measuring cosmic rays and sources. By using a suitable purification technique, an absorption length longer than 100 cm has been achieved. The effects of the light absorption on the energy resolution are estimated by Monte Carlo simulation.
keywords:
Liquid xenon , Scintillation detector , Purification , CalorimeterPACS:
29.40.Mc , 29.40.Vj , 81.20.YmUT-ICEPP 04-02
, , , , , , , , , , , , , , , , , , , , , , , , , , , , , ,
1 Introduction
A liquid xenon (LXe) scintillation ray detector is being developed for the MEG experiment which will search for decay at the Paul Scherrer Institut [1]. The MEG experiment aims to improve the sensitivity by at least two orders of magnitude over the previous experiment [2] and to reach a branching ratio that is predicted by theories of supersymmetric grand unification [3] and supersymmetric theories with right-handed neutrinos [4].
The LXe detector is an indispensable component of the experiment that enables to achieve such a superior sensitivity with its excellent performance in ray measurement. It will have an active LXe volume of 800 surrounded by 800 photomultiplier tubes (PMTs) viewing inside [1]. The detector utilizes only scintillation light without any attempt to measure ionization. The principle of the detector has been successfully demonstrated by a small prototype with an active LXe volume of 2.34 surrounded by 32 PMTs [5].
However, since such a large LXe detector has never been built, nobody has verified long distance transparency of LXe for the vacuum ultra violet (VUV) scintillation light of xenon. While LXe itself should never absorb the scintillation, practically unavoidable impurities might deteriorate the transparency and thus the performance of the detector.
We have recently built a 100 prototype with an active volume of mm3 (69 ) surrounded by 228 PMTs to gain practical experiences in operating such a device and to prove its excellent performance. In this paper we describe how this prototype has been used to evaluate the absorption of the scintillation light in LXe. Based on the obtained result, the effects of the light absorption on the energy resolution are estimated by Monte Carlo simulation.
2 Optical properties of LXe
We discuss here the optical properties of LXe that are of interest for a scintillation detector. The main optical properties of LXe are listed in Table 1.
| Material Properties | Value & Unit | Ref. |
|---|---|---|
| Refractive index at scintillation wavelength | [6, 7, 8] | |
| Peak scintillation wavelength | nm | [9, 10] |
| Scintillation spectral width (FWHM) | nm | [9, 10] |
| Absorption length | cm | present work |
| Scattering length | 29 - 50 cm | [6, 8, 11, 12, 13] |
Light attenuation in LXe can be described by the attenuation length, , as defined in the equation, . The attenuation length consists of two separate components, the absorption length, , describing real absorption and loss of photons, and the scattering length, , that represents elastic scattering of photons without any loss. For the elementary photon scattering they are related by: . For an actual photon beam one must take into account the fact that photons can be forward scattered. In our case the elastic scattering is dominated by Rayleigh scattering, therefore may be regarded as the Rayleigh scattering length, . The knowledge of refraction index in the region of the xenon VUV light emission is also relevant.
The most important among these parameters for the detector performance is the absorption length , since the energy measurement relies on the total number of scintillation photons detected by the PMTs that surround and view the LXe volume from all sides and is therefore not affected by photon scattering.
The experimental knowledge of these quantities, , , and for pure LXe is poor. Especially no measurement of has been made before. There are also some discrepancies among the available experimental data, which might partly be explained by the degree of purity of the LXe. As we shall show later, small amounts of VUV absorbing molecules like H2O or O2, at the level of a few parts per million, can dramatically change LXe optical parameters. Thus a reliable determination of optical parameters necessarily requires monitoring the level and the stability of the xenon purity. In addition a size of the LXe volume comparable to the absorption/scattering lengths is needed to make a reasonable measurement of these lengths.
Considering the scintillation mechanism of LXe through the excimer state Xe [14], absorption in pure LXe is improbable, i.e. ; any absorption is thus caused by VUV absorbing impurities. In this paper we report the first measurement of using our prototype and present a significant lower limit.
In contrast to the situation for LXe, better information is available for gaseous xenon (GXe) at various pressures both for visible and VUV light [15, 16, 17]. One can then examine if optical properties for LXe can be derived from those for GXe, although this might imply a daring extrapolation in terms of density. For a non-polar gas like xenon, however, this extrapolation proves to be valid [8]. One has to ascertain up to which value of photon energies the extrapolation maintains its validity. This point was further investigated by us [18]; the extrapolation is reliable up to a photon energy of 8.1 eV. At higher energies and closer to the first xenon absorption line at 8.3 eV the extrapolation is no longer valid. Our prediction for the value of the LXe refractive index at its emission line (7 eV corresponding to the wavelength of 178 nm) is . Most of the information obtained for GXe in various physical conditions can be used for reliably predicting other LXe optical properties [18]. Here we restrict the discussion to the relation between two quantities: and .
For a dense fluid like LXe depends on density and temperature fluctuations of the medium, according to the Einstein’s expression [19]:
| (1) |
where is the dielectric constant, is the isothermal compressibility, is the specific heat at constant volume and is the Boltzmann’s constant.
Since xenon is a non-polar fluid, the second part of Eq. 1 comes out to be negligible [8, 20, 21]. The derivative appearing in the first part of Eq. 1 can be computed from the Clausius-Mossotti equation:
| (2) |
where is the Avogadro’s number, is the molecular polarizability and is the molecular weight. The Einstein’s equation reduces then to:
| (3) |
This equation establishes therefore a useful relation between the index of refraction in pure LXe and the Rayleigh scattering length.
3 The 100 prototype
A schematic view of the prototype detector is shown in Fig. 1. It has an active volume of (69 ) viewed from all sides by 228 PMTs assembled into a rectangular shape. The cryostat consists of thermal insulated vessels equipped with a pulse tube refrigerator [22, 23] and a liquid nitrogen cooling pipe. Several sensors are used inside the vessels for monitoring temperatures and pressures. A signal feedthrough that was originally developed for the ATLAS liquid argon calorimeter [24] is installed on the flange of the vessel.
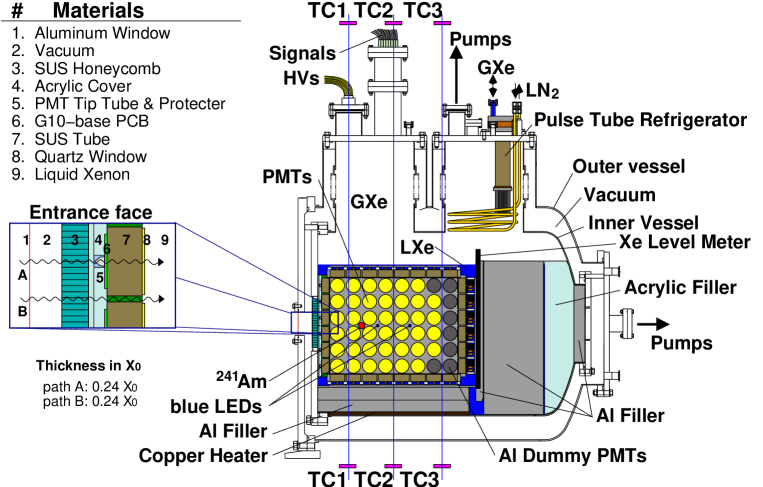
To minimize ray interactions before the active region of the detector, a thin aluminum plate and a honeycomb window made of stainless steel are used as an entrance window. Including the PMTs and their holders, the front materials amount to a total thickness of 0.24 , as summarized in Fig. 1.
All the PMTs are immersed in LXe in order to maximize the direct light collection. The PMTs (HAMAMATSU R6041Q [25]) operate at the LXe temperature and stand up to 0.3 MPa pressure. They have been specially developed in cooperation with Hamamatsu Photonics K. K. Their properties are summarized in Table 2. The short axial length of 32 mm is realized by the adoption of metal channel dynode structure. A synthetic quartz window is used to allow for the VUV scintillation light [10, 26]. The circuit elements that operate even at the liquid nitrogen temperature were carefully selected for the voltage dividers.
The detector is equipped with 8 blue LEDs and four 241Am sources, two LEDs and one source on each lateral face, for PMT calibration. Three pairs of trigger counters (TC1, TC2, and TC3) are placed above and below the vessel to select cosmic ray muons traversing the LXe for various tests.
| Diameter | 57 mm |
|---|---|
| Photo-Cathode Material | Rb-Cs-Sb |
| Active Area | 46 mm |
| QE at 165 K | 6 % typ. |
| Dynode Type | Metal channel |
| Number of Stages | 12 |
| Supplied H.V. | 900 V typ. |
| Gain | typ. |
| Thickness (center) | 0.20 |
4 Detector operations
The detector requires a total of about 100 of LXe. Some preparations are needed to bring it into operational conditions. Once in operation, the gains of the PMTs are measured with the blue LEDs and adjusted by changing the high voltage. The effective quantum efficiencies (QE) are estimated by measuring scintillation spectra of the sources in GXe at 170 K, close to the liquid temperature.
4.1 Liquefaction process
Both the inner and outer vessels are initially evacuated. While being evacuated, the inner vessel is baked at the rather low temperature of C because of the PMTs and acrylics inside the vessel. After a continuous evacuation for about ten days, the inner pressure reaches Pa.
In order to cool the inner vessel down to 165 K prior to xenon liquefaction (pre-cooling), it is first filled with GXe at 0.2 MPa and then cooled for a whole day by the combined action of the pulse tube refrigerator and liquid nitrogen flowing through a coiled stainless steel pipe in the inner vessel. The refrigerator, operating quietly with no moving parts near the cooling head, does not require frequent interruptions for maintenance [23].
When the inner vessel is sufficiently pre-cooled, xenon is finally liquefied by using liquid nitrogen and the refrigerator. GXe flows through a gas purifier (SAES Getter[27]) and molecular filters (Oxisorbs [28]) before entering the vessel and getting liquefied. The gas purifier absorbs various contaminants such as and down to the ppb level. The molecular filters act as an additional oxygen trap. It usually takes two days to liquefy 100 of LXe. The vapor pressure in the inner vessel is continuously monitored to regulate the flow of liquid nitrogen.
After liquefaction, LXe is maintained at 168 K and 0.13 MPa mainly by the refrigerator. For the measurement described later in this paper, the detector was kept in operation continuously for approximately 2000 hours.
After detector operation xenon is recovered to a storage tank. The refrigerator is turned off, the outer vessel is filled with nitrogen gas of room temperature, and a heater under the PMT holder is switched on to accelerate LXe evaporation. The storage tank is cooled down by liquid nitrogen in order to re-condense the xenon flowing from the detector vessel. Recovery and warming up of the cryostat take two and four days, respectively.
4.2 PMT calibration
A precise knowledge of PMT gains and quantum efficiencies is necessary to have an excellent energy resolution. The blue LEDs and the 241Am sources placed inside the detector are used for the calibration of the PMTs.
4.2.1 Gain monitoring and adjustment
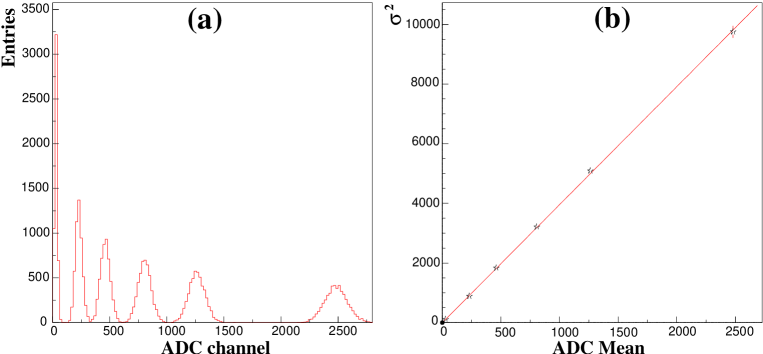
During data acquisition, that lasted over 2000 hours, the gain of each PMT was monitored twice a day by flashing, at a time, a pair of LEDs facing each other at 100 Hz by LED drivers (CAEN C529 [29]) at several different intensities. A typical ADC spectrum of the PMT outputs in one of these LED runs is shown in Fig. 2 (a). Assuming negligible fluctuations of the LEDs intensity, the gain can be given by the following equation:
| (4) |
where is the charge per ADC channel (), and are the standard deviation and the mean of ADC spectrum, respectively, and is the electron charge magnitude. Here it is assumed that the number of photoelectrons () observed on a PMT is reasonably large so that the spectrum can be regarded as Gaussian. In practice we have to consider a contribution from the pedestal as in the following equation:
| (5) |
where and are the mean and the standard deviation of the pedestal. Fig. 2 (b) shows an example of the linear relation between and . The gain of the PMT is evaluated by fitting the data with Eq. 5. To evaluate reliability of the obtained results, the procedure was repeated both by using different LED pairs and by using the same pair in several consecutive runs. The results were reproduced within 0.9 % in FWHM, which gives a negligible contribution to the energy resolution of the detector.
4.2.2 Determination of quantum efficiencies
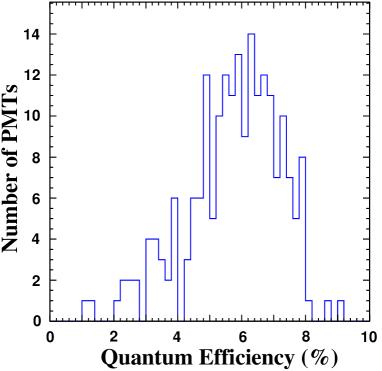
Quantum efficiencies (QEs) of the PMTs depend on the temperature and the light wavelength and must be evaluated in the operational conditions. They were evaluated by using the sources with 0.13 MPa GXe at 170 K. The use of gaseous xenon is necessary to avoid scattering and possible absorption of the scintillation photons, which are more prominent in liquid phase. The scintillation spectra in liquid and gaseous phases are not much different [9, 30].
QEs for individual PMTs were evaluated by comparing the measured spectra with a GEANT3 simulation [31]. The obtained QE distribution for all the PMTs is shown in Fig. 3. The low values and the broad spread of QEs are thought to be due to the increased photo-cathode resistivity at low temperature and the difficult evaporation procedure of the photo-cathode.111 New types of PMTs have been recently developed by coating Al strips on the quartz window to reduce the resistivity and by using more standard photo-cathode material to ease the evaporation procedure. A preliminary measurement shows their QEs are about 15–20 %.
The sources were also used for monitoring the stability of the PMTs during the data taking in liquid phase. It is found that the PMT outputs stabilize in about 50 hours after the liquefaction and are stable within 0.5 % thereafter.
5 Xenon purification
LXe should in principle be transparent to its own scintillation light thanks to the scintillation mechanism through the excimer state [14]. However possible contaminants in LXe, such as water and oxygen at ppm level, considerably absorb scintillation light [32, 33].
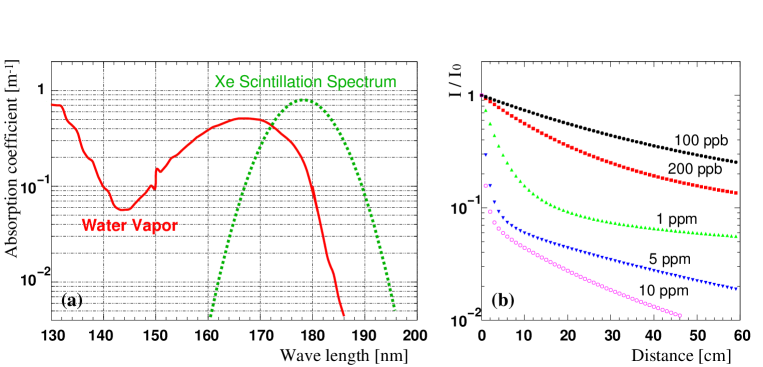
In Fig. 4 (a) the absorption coefficient for VUV light is shown for 1 ppm contamination of water vapor. The absorption spectra of water and oxygen largely overlap with the xenon scintillation spectrum. Given these absorption coefficients and neglecting the scattering (), we calculated the light intensity as a function of the distance from the light source for various concentrations of the contaminant. The result is shown in Fig. 4 (b) for water. Since water tends to absorb light with shorter wavelengths, only a component with longer wavelengths survives for a long distance. This might explain the discrepancies among the measurements of the LXe refractive index , as varies rapidly as a function of the wavelength in the vicinity of the scintillation wavelength.
As we already noted, xenon is well purified before filling the detector vessel, but some inner components of the prototype are made of G10 and acrylic that are known to absorb and desorb water. During the initial stage of the prototype operation, a strong absorption of scintillation light was observed. After systematic studies on the residual gas by means of mass spectroscopy and build-up tests, we concluded that water at the ppm level seemed to be desorbed from the detector material into LXe.
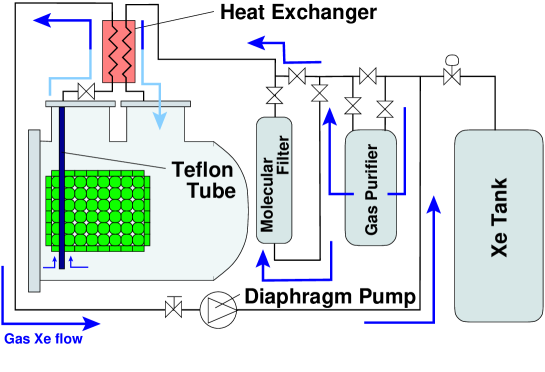
We therefore introduced a circulation-purification system, as schematically shown in Fig. 5, to remove the water. In this system, xenon, taken from the bottom of the vessel through the Teflon tube and evaporated by the heat exchanger, is pumped by a diaphragm pump and circulated through the gas purifiers and the molecular filters, and is finally condensed back into the detector. The flow rate of GXe is about 500 /min, hence the whole volume could be circulated in a few month time. We also carried out various tests to study the purification process, such as stopping or changing the flow rate and bypassing the purifiers or the filters.
6 Absorption length estimate
Purification was continuously performed for over 1200 hours. To evaluate and monitor light absorption in LXe separately from Rayleigh scattering during purification, we used cosmic ray muons as well as the sources.
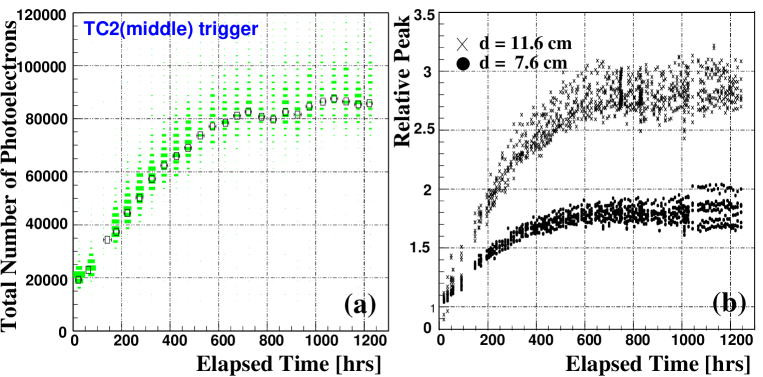
The total number of photoelectrons collected by all the PMTs () for each cosmic ray event, being sensitive only to the loss of the scintillation photons, is a good measure of the light absorption. In Fig. 6 (a), is plotted as a function of time. It increased by a factor four in about one month (700 hours) and almost saturated. A comparison with a Monte Carlo simulation indicates that increased from cm to above 1 m.
In Fig. 6 (b) the relative changes in the peaks of the PMTs located at certain distances (7.6 cm and 11.6 cm) from the sources are plotted. For the PMTs at a longer distance, the PMT outputs increased much more significantly and saturated slightly later, just as expected for the light absorption in LXe.
We first made a crude estimate of the Rayleigh scattering length by using the PMTs located on the same face as the source; these PMTs can not directly see the scintillation light from the particles but only the scattered light. Our data prefer values of 40 - 50 cm, which are consistent with the numbers currently available in the literature [6, 8, 11, 12, 13].
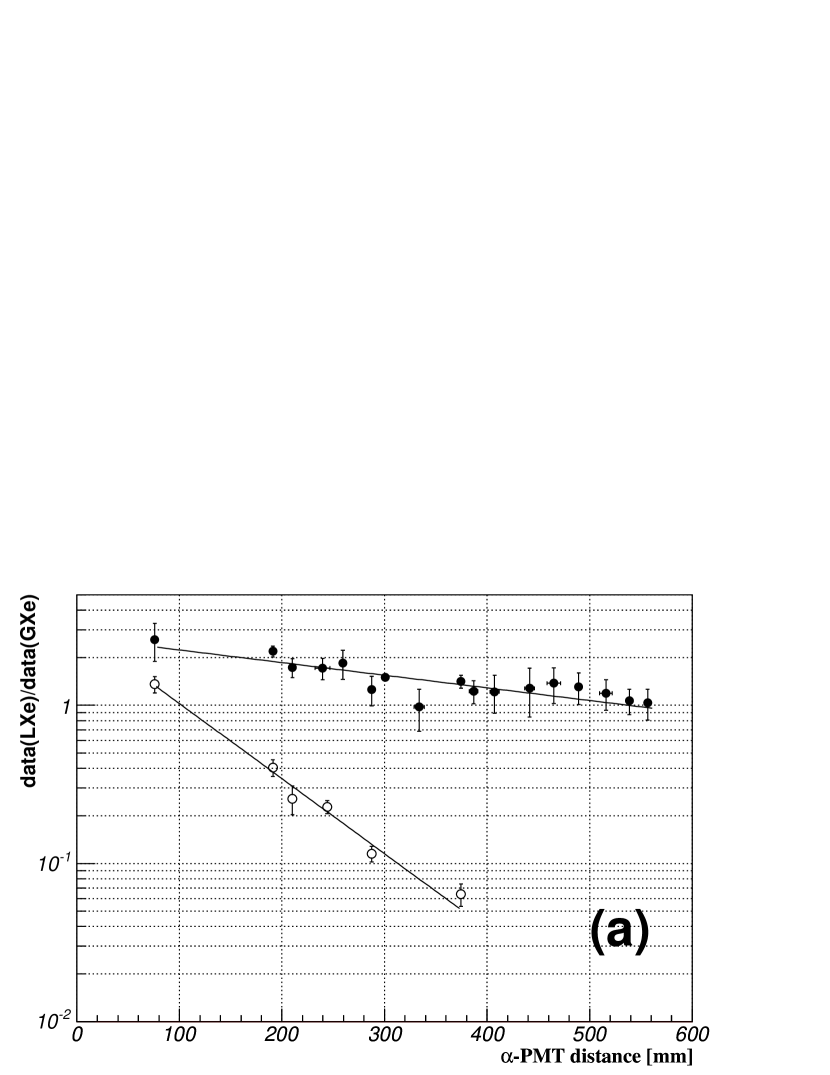
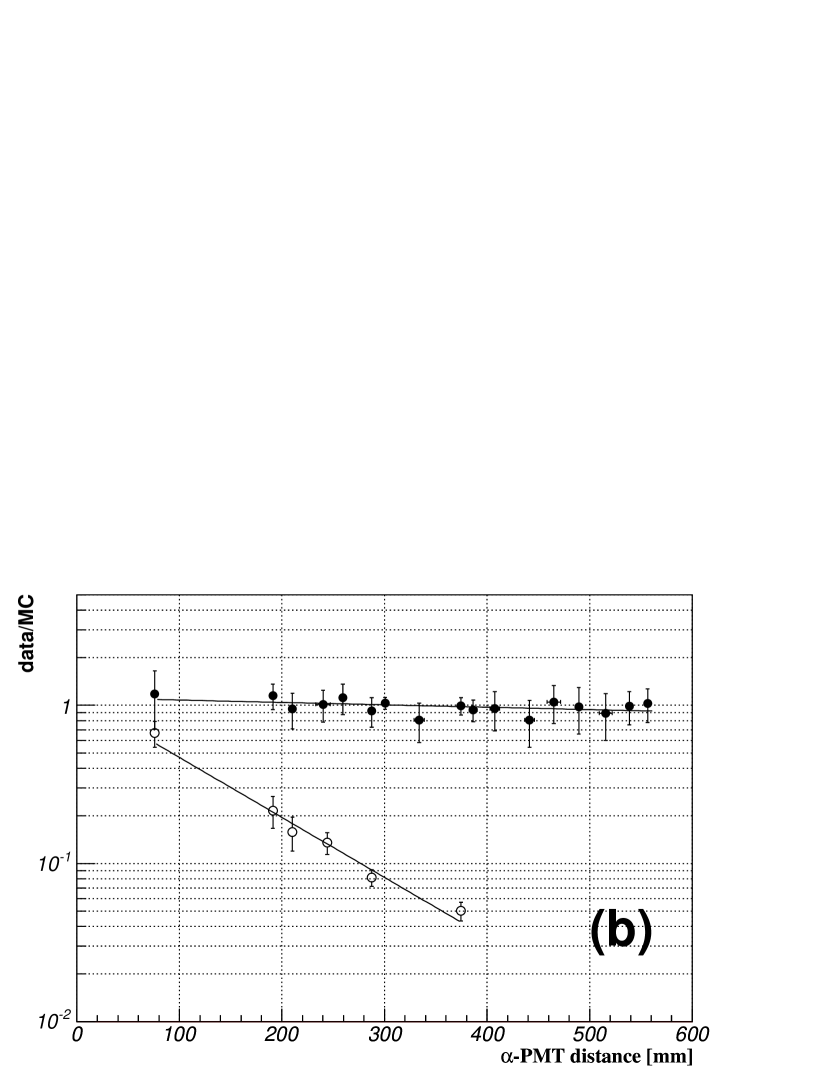
To evaluate the absorption length , we compared the PMT outputs in the LXe to those in the GXe and to a Monte Carlo simulation with no absorption and a variable . Note that both absorption and scattering are negligible in the GXe. In Fig. 7 the PMT outputs normalized either to those in the GXe (a) or to the MC simulation with cm (b) are plotted against the source-PMT distance. Here the distributions at the beginning of purification (open circles) and after one month of purification (closed circles) are compared. The evident exponential decline at the beginning almost vanished after purification.
These distributions were then fitted with exponential functions. From the comparison with the GXe data an effective attenuation length of cm was obtained after the purification. This effective length contains the effects of both the absorption and the Rayleigh scattering. Since the scattered photons are not totally lost but may be detected by other PMTs, the obtained effective attenuation length is longer than and, especially if , it is longer than . Note that the LXe/GXe ratio is larger than unity since the ratio of the scintillation yields in LXe and GXe is approximately 2.7 [34].
The comparison with the simulation does not show a significant slope. We used this result to establish a lower limit on the absorption length of 90 cm at 90 % confidence level, where was varied from 30 cm to 50 cm in the simulation. Before the purification was cm. We conclude that the level of water content after the purification was much lower than 100 ppb.
After successful purification of LXe under the operational conditions, efforts have been focused on reducing the initial amount of water contamination in the vessel. We replaced most of the acrylic parts with Teflon to suppress out-gassing in the inner chamber, which resulted in an initial absorption length of 30 cm in the subsequent operation. A lower limit on the absorption length of 100 cm at 90 % confidence level was then achieved in a much shorter time of xenon purification, in about 300 hours.
We are also developing a liquid-phase purification system with a fluid pump to increase the purification efficiency. In such a system the circulation speed could be increased up to 100 /hour of LXe, more than 1000 times faster than the current system.
7 Expected detector performance
In this section we estimate the performance of the 100 LXe prototype for 52.8 MeV rays that are expected from the decays.
Simulations show that the determination of the incident positions of the rays is only slightly affected by absorption and Rayleigh scattering. On the contrary the energy resolution is heavily dependent on the absorption mainly because of fluctuations in light collection efficiency. For a short absorption length the total amount of light collected by the PMTs depends strongly on the positions of the energy deposits. Although corrections for the first ray conversion points may be straightforward, the total light yield just fluctuates according with the event-by-event shower fluctuations. We therefore concentrate on the detector performance in energy measurement of rays in the following.
For negligible absorption (i.e. the detector size) the ray energy may be simply evaluated by the total sum of the photons collected by all the PMTs, possibly weighted by the local density of the PMTs. For a finite absorption length, however, a better method of summing the PMT outputs is necessary.
The ray energy may be calculated as a linear sum of the PMT outputs with arbitrary coefficients :
| (6) |
To optimize the coefficients we may use simulated events with the ray energy of and minimize
| (7) |
where is the average of over the simulated events. The minimization is straightforward and yields the following result:
| (8) | |||||
| (9) |
Here is just the covariance matrix of for the simulated events, . This method is called “linear fit” and its validity is based on the principal component analysis [35].

Using the linear fit, a reconstructed energy spectrum for 52.8 MeV monochromatic rays that uniformly irradiate the center of the detector face is shown in Fig. 8. The spectrum has an asymmetric shape. The lower tail is caused by interactions of the rays in the materials before the LXe and by a leakage of shower components (mostly low energy rays). Most important for the experiment is the resolution at the upper edge () to reject background events, while the lower tail concerns the detection efficiency. The spectrum was fitted to the following function to evaluate :
where the parameters and were also determined in the fit.
The obtained resolutions in FWHM and for 52.8 MeV rays are plotted in Fig. 9 as a function of the absorption lengths assumed in the simulation. The resolutions for two incident positions A and B described in the inset of Fig. 9 are similar, indicating a small position dependence. The resolutions are also stable by changing cm and for for LXe. Note that in the simulation refraction, reflection and absorption of the scintillation light at the PMT quartz windows are taken into account.
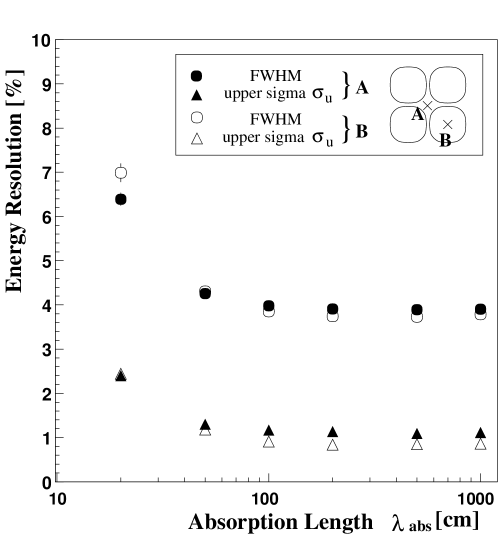
With the achieved absorption length of cm an energy resolution of 4 % FWHM and %, averaged over the detector acceptance, is expected from the Monte Carlo simulation. The detection efficiency is estimated to be approximately 60 % for cm if selected within % around the energy peak.
8 Summary
We are developing a LXe ray detector for the MEG experiment. A 100 prototype with an active volume of mm3 was constructed to examine its performance for 52.8-MeV rays that are expected from decays. We have established a long stable operation of this new type of device by successfully running it for approximately 2000 hours without interruptions.
Absorption of the vacuum ultra violet scintillation light of xenon by possible impurities might critically limit the performance of the detector. We developed a method to evaluate absorption of scintillation light in LXe, separately from Rayleigh scattering, by measuring cosmic rays and sources attached inside the detector. It was found that a ppm level contamination of water is the prime cause of light absorption in LXe. By introducing a suitable purification system, an absorption length longer than 100 cm at 90 % C.L. has been achieved.
A Monte Carlo simulation study shows that, with an absorption length of 100 cm or longer, an energy resolution of 4 % in FWHM and an upper edge resolution of % are expected.
To verify the detector performance, the prototype has been recently irradiated by high energy rays from laser Compton back-scatterings and from decays in the charge exchange reactions, . Analyses of these data are in progress and the results will be reported elsewhere.
References
- [1] T. Mori et al., Research Proposal to PSI, May 1999; A. Baldini et al., Research Proposal to INFN, Sep. 2002; These proposals are available at .
- [2] MEGA Collaboration, M.L. Brooks et al., Phys. Rev. Lett. 83 (1999) 1521; MEGA Collaboration, M. Ahmed et al., Phys. Rev. D65 (2002) 112002.
- [3] R. Barbieri and L.J. Hall, Phys. Lett. B338 (1994) 212; R. Barbieri, L.J. Hall and A. Strumia, Nucl. Phys. B445 (1995) 219.
- [4] J. Hisano and D. Nomura, Phys. Rev. D59 (1999) 116005 and references therein.
- [5] S. Mihara et al., IEEE TNS 49 (2002) 588; A more detailed paper in preparation.
- [6] V.N. Solovov, V. Chepel, M.I. Lopes and A. Hitachi, Nucl. Instr. and Meth. A516 (2004) 462.
- [7] L. M. Barkov et al., Nucl. Instr. and Meth. A379 (1996) 482.
- [8] G.M. Seidel, R.E. Lanou, W. Yao, Nucl. Instr. and Meth. A489 (2002) 189.
- [9] J. Jortner et al., J. Chem. Phys. 42 (1965) 4250.
- [10] N. Schwenter, E.-E. Koch and J. Jortner, “Electronic Excitations in Condensed Rare Gases,” Springer-Verlag, Berlin 1985.
- [11] A. Braem, et al., Nucl. Instr. and Meth. A320 (1992) 228.
- [12] V. Y. Chepel, et al., Nucl. Instr. and Meth. A349 (1994) 500.
- [13] N. Ishida, et al., Nucl. Instr. and Meth. A384 (1997) 380.
- [14] T. Doke, Portugal Phys. 12 (1981) 9.
- [15] U. Hohm, Molecular Physics 81 (1994) 157.
- [16] A. C. Sinnock, J. Phys. C: Sol. St. Phys. 13 (1980) 2375.
- [17] A. Bideau-Mehu, et al., J. Quant. Spectrosc. Radiat. Transfer 25 (1981) 395.
- [18] A. Baldini, et al., physics/0401072, August 2003.
- [19] L.D. Landau, E.M. Lifshitz and L.P. Pitaevskii, “Electrodynamics of Continuous Media,” 2nd edition, Butterworth-Heinemann, 1985.
- [20] A.C. Sinnock and B. L. Smith, Phys. Rev. 181 (1969) 1297.
- [21] U. Hohm, K. Kerl, Molecular Physics, 69 (1990) 803.
- [22] T. Haruyama et al., Proc. ICEC18 (2000) 563.
- [23] T. Haruyama et al., KEK Preprint 2002-102, Sep 2002.
- [24] ATLAS Liquid Argon Calorimeter Technical Design Report, CERN/LHCC/96-41, ATLAS TDR2, December 15, 1996.
- [25] R6041Q, Hamamatsu Photonics K. K., Shizuoka 438-0193, Japan.
- [26] N.G. Basov et al., Journal of Luminescence 1, 2 (1970) 834; N.G. Basov et al., JETP Lett. 12 (1970) 329.
- [27] MONO TORR PS15 Series, SAES Pure Gas, Inc. 4175 Santa Fe Road San Luis Obispo, California, 93401 USA.
- [28] Oxisorb, Messer Griesheim GmbH, Dusseldorf, Germany.
- [29] LED driver C529, CAEN S.p.A., Via Vetraia 11 55049 Viareggio (LU), Italy.
- [30] E. Morikawa et al., J. Chem. Phys. 91 (1989) 1469.
- [31] GEANT, Detector Description Simulation Tool, CERN Program Library.
- [32] K. Watanabe, et al., J. Opt. Soc. Am. 43 (1953) 753.
- [33] K. Watanabe, et al., J. Chem. Phys. 21 (1953) 1026.
- [34] M. Miyajima, et al., Nucl. Instr. and Meth. B63 (1992) 297.
- [35] S. Belforte et al., SVT Technical Design Report, CDF note 3108 (1994); CERN EP report 81-12/Rev.