Also at P.N. Lebedev Physics Institute, Moscow, Russia] Also at D.I. Mendeleev Institute for Metrology, St. Petersburg, Russia] Also at Ludwig-Maximilians-University, Munich, Germany]
2S hyperfine structure of atomic deuterium
Abstract
We have measured the frequency splitting between the and hyperfine sublevels in atomic deuterium by an optical differential method based on two-photon Doppler-free spectroscopy on a cold atomic beam. The result Hz is the most precise value for this interval to date. In comparison to the previous radio-frequency measurement we have improved the accuracy by the factor of three. The specific combination of hyperfine frequency intervals for metastable- and ground states in deuterium atom derived from our measurement is in a good agreement with calculated from quantum-electrodynamics theory.
pacs:
12.20.Fv, 32.10.Fn, 32.30.Jc, 42.62.FiI introduction
High-precision measurements in light atomic systems permit accurate tests of the quantum-electrodynamics theory (QED). QED calculations enter into a number of fundamental values related to free particles and simple atoms. In conventional atomic systems the accuracy of QED tests is restricted by insufficient knowledge of the nuclear structure which is the main obstacle on the way to improve theoretical predictions for the Lamb shift and the hyperfine structure in hydrogen (see e.g. Eides ; sgkpsas ).
The leading corrections for different energy levels coming from nuclear size effects are proportional to the squared value of non-relativistic wave function of the electron at the origin:
| (1) |
where the value of the coefficient is determined by parameters of the nucleus and does not depend on atomic quantum numbers. For –levels in hydrogen-like systems the non-relativistic wave function at the origin scales with the principal quantum number as . Thus, if one takes the following difference of the energies corresponding to two different –levels , the leading contribution of nuclear effects cancels.
Recently, a significant progress in calculations of the difference of and hyperfine splitting (HFS) intervals in light hydrogen-like atoms has been achieved Karsh1 . New state-dependent QED terms to the HFS interval frequency up to the fractional order of and have been calculated as well as the next-to-leading nuclear structure effects. The accuracy of this theoretical prediction for exceeds now the experimental accuracy which is mainly restricted by the uncertainty in the determination of the .
Experimental results are available for the and hyperfine interval in hydrogen Ramsey ; Kusch ; Hessels ; Kolachevsky , deuterium Wineland ; Reich and the helium-3 ion Schl69 ; Prior . The study of neutral atoms and ions requires different experimental techniques. While HFS intervals in neutral atoms Ramsey ; Wineland have been measured with a higher relative accuracy as in the helium-3 ion Schl69 , the HFS intervals in hydrogen Hessels ; Kolachevsky and deuterium Reich are known less precisely as in the helium-3 ion Prior . Since the traditional microwave methods have likely reached their limits we have been working on an optical determination of the hyperfine interval in the metastable state of hydrogen and deuterium.
Recently we have measured the hyperfine splitting of the state of the hydrogen atom applying an optical technique Kolachevsky . It is based on two-photon spectroscopy on a cold beam shielded from magnetic fields. The HFS interval has been determined from the frequency difference of two stable light fields exciting – transitions for singlet () and triplet () components. The differential method cancels a number of systematic effects intrinsic to two-photon spectroscopy which provides a significant increase of accuracy in comparison with absolute frequency measurements Niering ; Hbook ; Fischer .
We have improved this technique Kolachevsky and applied it to the spectroscopy of atomic deuterium. The hyperfine structure in deuterium is approximately 4 times smaller than in hydrogen and its accurate optical measurement is a harder problem, however, a smaller HFS value has also some advantages due to a reduction of certain systematic effects for the comparison of the – frequencies between different spin states. The experiment and its systematic effects are presented in two following sections while a comparison of theory and experiment is summarized in the concluding part of the paper.
II Measurement of the hyperfine splitting
The HFS interval has been measured once by Reich, Heberle, and Kusch Reich . The value of
| (2) |
has been obtained by a radio-frequency (rf) method applied earlier to a similar measurement in hydrogen Kusch . In comparison to the hydrogen measurement Kusch , the absolute accuracy of determination of Reich has been improved by a factor of 3. In spite of the fact that the HFS intervals in deuterium are strongly affected by magnetic fields, as in hydrogen, the average of two rf transitions frequencies in the metastable deuterium atom and contains no linear field-dependent terms and thus is rather insensitive to the field. Still, the most important systematic effects contributing to the 20 Hz error were the uncertainty in the determination of the magnetic field and the rf Stark effect.
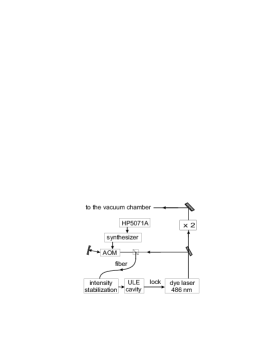
For an independent measurement of we use the hydrogen spectrometer setup described elsewhere Fischercan . A dye laser operating near 486 nm is locked to a definite TEM00 mode of an ultra-stable cavity with Ultra-Low Expansion (ULE) glass spacer and a drift less than 0.5 Hz/s (Fig.1). To change the laser frequency with respect to the cavity mode we use a broadband double-pass acousto-optic modulator (AOM) placed between the laser and the cavity. The frequency of the dye laser is doubled in a Barium -borate crystal, and the resulting 243 nm radiation is coupled to a linear enhancement cavity inside the vacuum chamber where the two-photon excitation takes place.
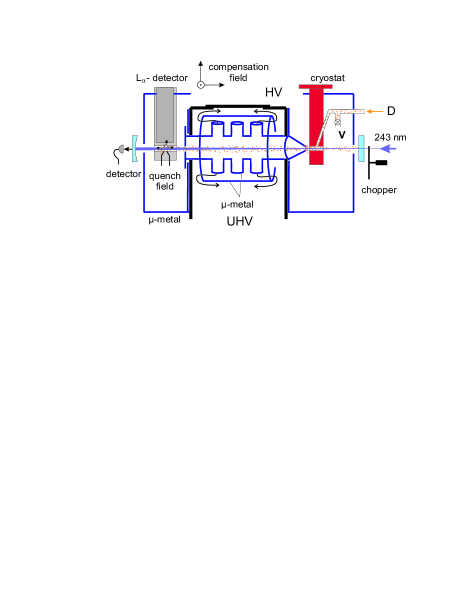
Atomic deuterium produced in a 15 W, 2.5 GHz rf gas discharge flows through teflon tubes to a copper nozzle cooled by a flow-through cryostat (Fig.2). Atoms thermalize with the nozzle walls and leave the nozzle in both directions coaxially with the enhancement cavity mode. A part of the atoms flying along the mode are excited to the state and then reach the detection zone where a weak electrical quenching field is applied. The field mixes the and states of the atoms causing their fast decay to the ground state with the emission of Lyman– photons. Photons are counted by a solar-blind photomultiplier connected to a photon counter incorporated into time-of-flight measurement scheme. The excitation radiation is periodically blocked before the cavity by a chopper wheel, and 121 nm photons are detected only within a 3 ms dark time interval. Introducing a delay between closing the beam and starting the detection, we can thus select different velocity groups contributing to the signal. The delay sets an upper limit for the atomic velocity to , where is the distance between the nozzle and detector. Using a multi-channel scaler we sort the counts in adjacent time bins (,) and simultaneously record up to 12 spectra containing the information about velocity-dependent effects, e.g. 2nd order Doppler effect.
Here we will point out some important changes which have been introduced in the spectrometer configuration (which has been used for the recent measurements in atomic hydrogen Kolachevsky ; Fischer ) to optimize it for the current deuterium measurement. To maximize the count rate for slow atoms ( m/s) one has to find a compromise between thermalization and recombination processes at the cold walls of the nozzle by adjusting the nozzle geometry and temperature. The best rates are observed with a larger nozzle diameter (2–2.5 mm compared to 1.2 mm for hydrogen) and at slightly higher temperatures (6–6.5 K compared to 5 K). Typically, the count rate with the deuterium beam has been higher than for hydrogen (by a factor 2–5 depending on ).
On the way between the gas discharge and the nozzle we have installed a bypass valve which can be opened to a high-vacuum (HV) part of the vacuum chamber, where the cavity mirrors, the nozzle and the detector have been placed. By opening the valve we reduce the atomic flow through the nozzle by a factor of 4. Even at the lowest pressure in the gas discharge (0.7 mbar) and with opened valve, the count rate was sufficient to detect a solid signal for the atoms with m/s. The high-vacuum volume is pumped by a turbo-molecular pump to mbar.
Atoms are collimated by two 1.5 mm diaphragms separating the HV and the ultrahigh-vacuum (UHV) volumes. Most of the interaction region (95%) is in the UHV region pumped by a l/s cryopump. Without the atomic beam, the background gas pressure in the UHV region equals mbar. The background gas pressure increases with the deuterium flow escaping from the nozzle and can be thus varied up to mbar.
The excitation region is shielded against external magnetic fields. As in Kolachevsky , we use a two-stage –metal shielding. The outer shielding together with the compensation field reduces residual fields over the entire interaction region to 10–20 mG. Configuration of the inner shielding has been improved to increase the shielding factor as well as its throughput for pumping.
In the absence of magnetic fields, the HFS interval frequency is given by the following combination of optical frequencies and the ground state HFS interval:
| (3) |
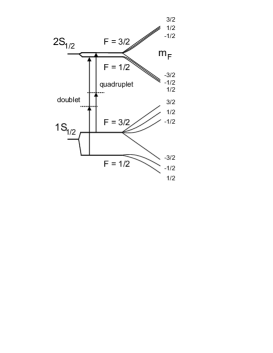
where and are the frequencies of the doublet and the quadruplet transitions at 121 nm (see Fig.3). In our experiment, we measure the frequency difference using two-photon spectroscopy of the corresponding transitions. The frequency of the ground-state splitting has been measured by Wineland and Ramsey Wineland with an uncertainty of :
| (4) |
The contribution to the resulting error budget introduced by this uncertainty is negligible.
For allowed two-photon transitions between the levels with , the contribution of the linear Zeeman effect cancels and the HFS frequency shift in a magnetic field scales as which is unfavorable for deuterium in comparison to hydrogen. But due to a low-field regime and the absence of linear terms, our measurement is rather insensitive to magnetic fields. In our case, the magnetic field shifts the frequency approximately as kHz/G2.
The laser as well as the lock electronic are adjusted in such a way, that the two (doublet) (quadruplet) transitions can be excited by changing the AOM frequency (see Fig.3).
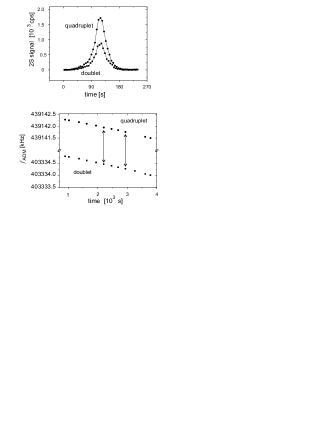
To measure the frequency difference between the two two-photon transitions we have applied the following procedure. The frequency of the double-pass AOM placed between the reference ULE cavity and the laser is tuned to one of the transitions and one point of the spectrum is measured with a photon accumulation time of 0.5 s. After the measurement, the AOM frequency is sweeped over a big fixed frequency interval (approximately equals to MHz) to reach the other two-photon transition. During the sweep, the laser has been continuously kept in lock. The factor 8 arises from the double-pass scheme for the AOM, the second harmonic generation stage and the two-photon process. Than we introduce 0.5 s pause as recovery time for multiple feedbacks, and repeat the measurement of one point of the other two-photon transition. After the measurement we add a small frequency step for scan and sweep the synthesizer back to the first transition. The result of such a procedure is presented on Fig.4(top).
The rf synthesizer driving the AOM is continuously referenced to the 10 MHz signal of a HP5071A cesium frequency standard calibrated by GPS (Fig.1). The miscalibration of the primary standard introduces a negligible uncertainty to the measured difference. After the double-pass AOM, the laser light is spatially filtered by means of a single-mode fiber, while the intensity of the light coupled into the cavity is actively stabilized. That guarantees that the coupling conditions which can change the frequency of the reference cavity mode Nevsky are the same for both transitions.
Both simultaneously recorded doublet and quadruplet transition lines are fitted with a Lorentzian function in the time and frequency domains. A typical time interval between the centers of such a line pair is less than 5 s. This corresponds to some small correction on a level of a few hertz which should be introduced to correct for the reference cavity drift (fig.4(bottom)). Such a procedure significantly reduces the influence of reference cavity frequency fluctuations on the HFS data statistics. The new method suppresses the influence coming from all drifts in the experimental setup with a time scale exceeding 200 s which is required to record one line. Even though such fluctuations do not introduce systematic shifts, a long time is required to average them. The approach is much more forgiving to systematic effects: one independent point is obtained after 3 minutes of measurement, while for the previous method Kolachevsky the corresponding time interval was about 20 minutes.
III Results and systematic effects
We have measured during 7 days using the new method and during 6 days applying the method described in Kolachevsky . To test for systematic effects we have varied different parameters of the experiment within each day. We have recorded over 1000 deuterium time-resolved spectra. The averaged amplitude ratio between quadruplet and doublet transitions equals to 2.00(2) which is in a good agreement with theoretical expectation.
The systematic effects for our two-photon beam spectroscopy are well-known Hbook . For the differential measurement, the most significant effects cancel out. As shown in Kolachevsky , the differential dynamic Stark shift cancels to the level of relative to the shift of the – transition (about 500 Hz). Because of some residual fluctuations of the 243 nm radiation intensity, the doublet and quadruplet lines acquire slightly different shifts. We correct for this difference for each line by monitoring the power leaking out of the cavity (Fig.2). The resulting correction for the new method equals 0.5 Hz which is a factor 4 lower than for the measurement in hydrogen Kolachevsky . For the simultaneous recording technique, long-term intensity fluctuations in the enhancement cavity contribute less to the result than in the case of Kolachevsky . Besides the correction, we add a 0.5 Hz uncertainty to the error budget.
A DC electrical field mixes and levels causing a level shift. According to Bethe , the energy shift of the level is reversely proportional to the Lamb shift. Thus, the differential shift scales as , where is the Lamb shift of the level. The evaluated shift of the HFS interval in deuterium equals Hz cm2/V2 and is about 4 times smaller as in hydrogen. The excitation region is shielded from stray fields by coating all surrounding parts of the interaction region with graphite. Residual stray fields in the setup are estimated to be less than 30 mV/cm Huber , which corresponds to a HFS frequency shift on a level of Hz. We add an uncertainty of 0.5 Hz to the error budget considering the slightly worse geometrical properties of our shielding compared to the Faraday cage used in Huber .
Residual magnetic fields split the magnetic sublevels and shift the measured hyperfine splitting to higher values. The shift mostly originates from imperfectly shielded parts of the excitation region lying in the HV region (Fig.2). To check for this effect we have once made a set of measurements without compensation field and observed a change of equal to 20(22) Hz. Without compensation field, the measured value of magnetic fields around the nozzle and the detector is about 200 mG. The compensation field reduces the magnetic fields for at least a factor of 10, which means that the residual shift should be on a sub-hertz level. We conservatively estimate the shift as 0.5(1.0) Hz.
Another source for level shifts is a pressure shift caused by collisions with the background gas and within the beam itself. The ground-state hyperfine splitting in hydrogen and deuterium is rather insensitive to collisions. Typically, this shift is on a level of 1 Hz/mbar depending on the buffer gas Anderson ; Morgan which corresponds to a vanishing shift for our pressure range. On the other side, there are no reliable experimental data for the pressure shift of the HFS frequency Hessels ; Kolachevsky . The upper limit for the HFS frequency shift can be taken as the frequency shift of the transition equal to MHz/mbar McIntyre ; Kleppner . But considering the theoretical works Davison ; Ray , there is no reason to expect the HFS shift to be orders of magnitude higher than for the ground state.
| , s] | , [m/s] | , [Hz] | , [Hz/a.u.] |
|---|---|---|---|
| 10 | 40 924 452(7) | 4(4) | |
| 210 | 1000 | 40 924 454(3) | 0.6(2.0) |
| 410 | 510 | 40 924 453(5) | 0.4(3.0) |
| 610 | 340 | 40 924 448(10) | 0.3(6.0) |
| 810 | 260 | 40 924 446(15) | 5(9) |
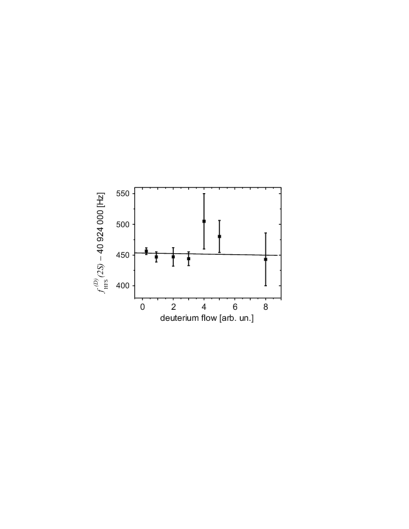
We have experimentally investigated the influence of collisions on the frequency. Most of the collisions take place within the atomic beam where the pressure can be much higher than the background gas pressure. Using the method of simultaneous detection, we have varied the atomic flow over a wide range by changing the pressure in the gas discharge (between 0.8 mbar and 8 mbar) and by opening the bypass valve (Fig.2). The background gas pressure scales linearly with the flow with a small offset of mbar. Experimental data are presented in Fig.5. Each point represents the result of statistical averaging of multiple data points detected at different days. About 1/4 of all the data have been taken at the lowest pressure in the gas discharge with an opened valve (the left point). At high flows the slow atoms are accelerated and pushed away from the beam by collisions (Zacharias effect) Huber which causes a loss in statistics and corresponding increase of uncertainty. Moreover, the measurement time becomes restricted by a fast growth of a film of molecular deuterium on the nozzle. For the previous method Kolachevsky the flow range of - (Fig.5) is practically unreachable. Disregarding the delay time we have not observed any indication for a HFS interval pressure shift on our level of accuracy.
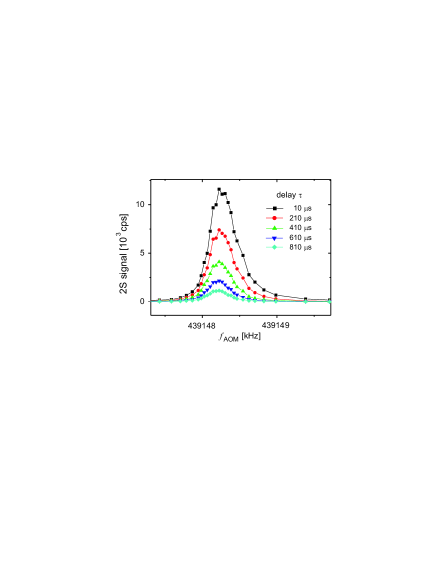
The observed transition lines are shifted by the second order Doppler effect in a range between 0.1–1 kHz depending on the velocity distribution of the atoms contributing to the signal Hbook . The lines are not symmetric and significantly differ from Lorentzian profiles at short () delays (Fig.6). If we excite two-photon transitions in the same thermal beam and detect the signal with some precisely defined delay time equal for both singlet and quadruplet transitions, the shift and the influence of the asymmetry should cancel out. To estimate the possible uncertainty coming form the ”wrong” fitting procedure with a Lorentzian function and all other velocity-dependent effects, we have evaluated the frequency for different delays. The data for each delay has been corrected for the AC Stark shift, and then the extrapolation to zero flow has been made (Fig.5). The results of this extrapolation are presented in the Table 1. All velocity-dependent systematic effects, if they exist, should reveal themselves in such evaluation procedure.
All the results are consistent within the error bars. For higher delays the corresponding uncertainty grows due to the lack of statistics. As a final value we have chosen the result ( s) due to the following reasons: (i) the statistical uncertainty for this result is small, (ii) the line-profile is practically undistinguishable from Lorentzian, and (iii) the fast non-thermalized atoms do not contribute to the signal. We add an additional uncertainty of 0.3 Hz corresponding to the conservatively estimated shift coming from the collisions with the residual background gas.
The data obtained during 6 days of measurement applying the older method presented in Kolachevsky give the result of Hz. The data are measured only at low deuterium flows – and are simply averaged over the entire ensemble. We have increased the uncertainty due to the possible pressure shift (1 Hz) and the AC Stark shift (2 Hz).
Combining both these statistically independent results and adding all known systematic uncertainties linearly, we arrive at the final value for the hyperfine interval in atomic deuterium
| (5) |
This result is in a good agreement with the one obtained by an rf method Reich , but is more accurate by a factor 3. The results as well as the error budget are collected in Table 2.
| Contribution [Hz] | Uncertainty [Hz] | |
| ”New” method | 40 924 453 | 5 |
| AC Stark shift | 0.5 | |
| DC Stark shift | 0.5 | |
| Magnetic field | 1.0 | |
| Pressure shift | 0.3 | |
| Method Kolachevsky | 40 924 462 | 15 |
| AC Stark shift | 2 | |
| DC Stark shift | 0.5 | |
| Magnetic field | 1.0 | |
| Pressure shift | 1 | |
| Result | 40 924 454 | 7 |
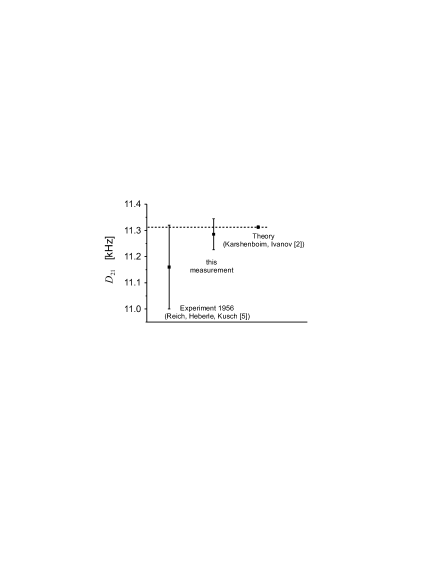
IV difference
To derive the difference we should combine our result with the known value of the HFS interval Wineland :
| (6) |
This result is in a good agreement with the theoretical prediction Karsh1
| (7) |
The experimental and theoretical values are presented in Fig.7. Restricted by the experimental accuracy, we can test the state-dependent QED contributions on the level of 0.2 ppm which can be compared to similar tests in hydrogen Kolachevsky and the 3He+ ion Prior . We point out that the absolute accuracy of our measurement exceeds the both cited results, while the relative accuracy suffers from the relatively small HFS interval in deuterium.
Today precision optical methods challenge even in fields were classical rf methods have been traditionally considered as favorable. After a successful measurement of the Lamb shift Hbook ; Weitz and the the HFS interval Kolachevsky in the hydrogen atom we have now presented a result on the HFS interval in deuterium with an accuracy exceeding that of rf methods.
The accuracy of the optical measurement can be improved by the further reducing the atomic velocity. The current results indicate that the pressure shift, which limits the accuracy of absolute frequency measurements in ultra-cold hydrogen Kleppner , may not play such a crucial role for the differential technique.
The work was partially supported by DFG (grant # 436RUS113/769/0-1) and RFBR (grant #03-02-04029). The authors wish to thank U. Jentschura, Th. Udem, and M. Fischer for useful discussions.
References
- (1) M.I. Eides, H. Gotch, and V.A. Shelyuto, Phys. Rep. 342, 63 (2001)
- (2) S. G. Karshenboim, in: Precision Physics of Simple Atomic Systems, Ed. by S. G. Karshenboim and V. B. Smirnov, (Springer, Berlin Heidelberg 2001) p. 141
- (3) S.G. Karshenboim and V.G. Ivanov, Phys. Lett. B 524, 259 (2002); Euro. Phys. J. D 19, 13 (2002)
- (4) N. Ramsey, in: Quantum Electrodynamics, ed. by T. Kinoshita (World Scientific, Singapore 1990), p. 673; Hyp. Interactions 81, 97 (1993)
- (5) J.W. Heberle, H.A. Reich, and P. Kusch, Phys. Rev. 101, 612 (1956)
- (6) N.E. Rothery and E.A. Hessels, Phys. Rev. A 61, 044501 (2000)
- (7) N. Kolachevsky et al., Phys. Rev. Lett. 92 033003 (2004)
- (8) D.J. Wineland, N.F. Ramsey, Phys. Rev. A 5, 821 (1972).
- (9) H.A. Reich, J.W. Heberle, and P. Kusch, Phys. Rev. 104, 1585 (1956)
- (10) H.A. Schluesser et al., Phys. Rev. 187, 5 (1969).
- (11) M.H. Prior and E.C. Wang, Phys. Rev. A 16, 6 (1977).
- (12) M. Niering et al., Phys. Rev. Lett. 84, 5496 (2000)
- (13) F. Biraben et al., in: The Hydrogen Atom. Precision Physics of Simple Atomic Systems, ed. by S.G. Karshenboim et al. (Springer, Berlin Heidelberg 2001), p. 17
- (14) M. Fischer et al., eprints physics/0311128 and physics/0312086
- (15) M. Fischer et al., Can. J. Phys. 80, 1225 (2002)
- (16) A.Yu. Nevsky, M. Eichenseer, J. von Zanthier, and H. Walther, Opt. Commun. 210, 91 (2002)
- (17) H.A. Bethe and E.E. Salpeter, Quantum Mechanics of One- and Two-Electron Atoms, Plenum, New York (1977)
- (18) A. Huber et al., Phys. Rev. A 59, 1844 (1999)
- (19) L.W. Anderson, F.M. Pipkin, and J.C. Baird, Phys. Rev. Lett. 4, 69 (1960)
- (20) C.L. Morgan and E.S. Ensberg, Phys. Rev. A 7, 1494 (1973)
- (21) D.H. McIntyre et al., Phys. Rev. A 41, 4632 (1990)
- (22) Th. C. Killian et al., Phys. Rev. Lett. 81, 3807 (1998)
- (23) W.D. Davison, J. Phys. B 2, 1110 (1969)
- (24) S. Ray, J.D. Lyons, and T.P. Das, Phys. Rev. 174, 104 (1968)
- (25) M. Weitz, F. Schmidt-Kaler, and T.W. Hänsch, Phys. Rev. Lett. 68, 1120 (1992)