Transition Radiation Spectroscopy with Prototypes of the ALICE TRD
Abstract
We present measurements of the transition radiation (TR) spectrum produced in an irregular radiator at different electron momenta. The data are compared to simulations of TR from a regular radiator.
1 Motivation
Measurements of TR yield and spectra for a large variety of regular radiator configurations have been presented by different authors. In general, data confirm the theoretical predictions [1], although total TR yield and dependence on the momentum of the emitting particle are not always reproduced [2][3]. The ALICE Transition Radiation Detector (TRD) consists of 540 drift chambers with mixed fibre/foam radiators. The expected performance of the detector in heavy-ion collisions is investigated in detailed simulations of the detector response. An accurate numerical treatment of TR production in an irregular-layered radiator requires knowledge of the distributions of material thickness and spacing in the medium [4], information usually not easy to quantify with precision. A realistic implementation of the ALICE TRD radiator in the simulations requires measurements of the spectral distribution of the emitted TR.
2 Setup and simulation
The measurements were carried out using a secondary beam at the CERN PS. A schematic drawing of the setup is shown in Fig. 1. Two threshold Cherenkov detectors provide offline electron-pion discrimination. We use two prototype drift chambers (DC) described in [5], operated with the standard gas mixture for the TRD, Xe,CO2(15%), and read out via a low-noise fast preamplifier-shaper and FADC. The radiator is composed of 8 pure polypropylene fibre mats, corresponding to 3.6 cm total thickness, in a box of 6 mm carbon fibre-enforced Rohacell© HF71. It is separated from DC1 by a He-filled plexiglas tube, 80 cm long, with 2 aluminum coated mylar foils of 10 m thickness serving as gas barriers. To deflect and separate the beam from the TR photons, radiator, He pipe and the DCs are placed in a dipole magnet. For beam momenta of 1.5, 2, and 3 GeV/c the magnetic field strength is B=0.42, 0.42, and 0.56 T, respectively. In addition, runs at B=0 are carried out for each momentum.
TR production is simulated tuning a regular foil stack configuration to reproduce the measurements. The doubly differential TR yield [1] is integrated numerically over the solid angle . The parameters (220 polypropylene foils of 12 m thickness, separated by air gaps of 100 m) reflect typical dimensions of the radiator materials [6], but are not unambiguously determined. We use tabulated X-ray cross sections from [7] to calculate photon absorption in the materials and the chamber gas.

3 Charge reconstruction
The signal induced by beam particles and TR photons is measured on a row of 8 readout pads. The integrated pulse height is a measure of the deposited charge. Photon scattering, the angular spread of the beam and the Lorentz angle of the ionization drifting in the detector result in a wide distribution of the charge from absorbed TR and beam ionization over the pads. For each incident electron a TR cluster search is performed, connecting time intervals with signal over threshold on adjacent pads. Local minima in the pulse height distribution occuring simultaneously on adjacent pads are detected to resolve multiple overlapping photons. The position of the incident beam is identified from the signal in DC2. To avoid contamination of the measured spectra due to overlap of beam and TR, a separation of 2 pads or more is required. In case the distance is exactly 2 pads, the signal measured on the interjacent pad can not be unambiguously assigned to the beam or the TR cluster. In this case the cluster is rejected unless the contribution of the interjacent pad to the total charge of the cluster is less than 5%.
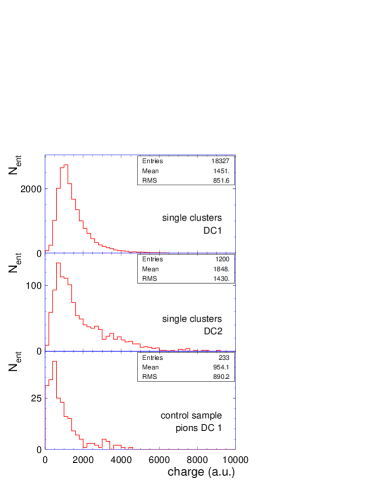
In Fig. 2 we present the TR charge spectra measured in DC1 and DC2 (upper and center panel). A smaller number of photons with higher average energy is detected in DC2, since most of the TR is deposited in DC1 or absorbed in the material before DC2, and only a fraction of hard photons penetrates into DC2. To assess the noise rejection power of the TR search algorithm we apply it to the sample of incident pions. The resulting charge spectrum of fake TR clusters is shown in the lower panel of Fig. 2. Comparing the number of entries to the total size of the pion sample, the probability to produce a fake TR is found to be smaller than 2%.
4 Cluster number distribution
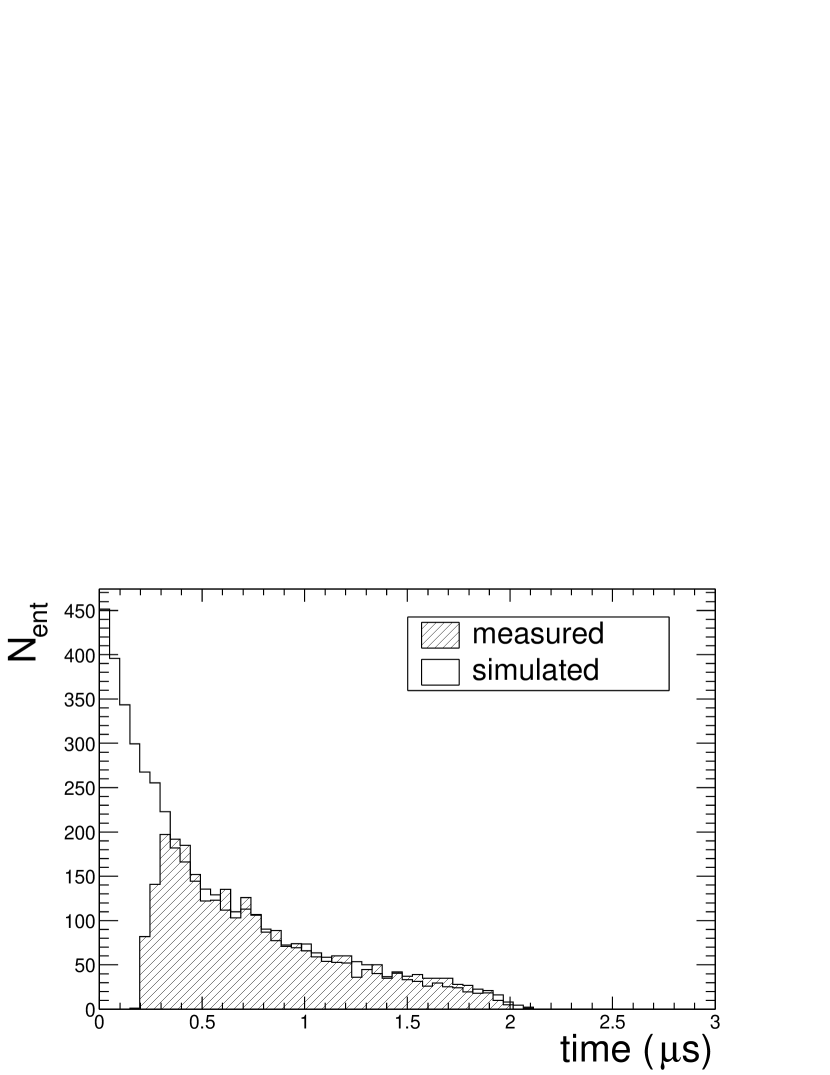
In the upper panel of Fig. 3 we present the normalised distribution of the detected photon number per incident electron for 2 GeV/c beam momentum. The shape of the distribution compares well with a Poissonian, indicated by the dashed curve. On average 0.61 photons per incident electron are detected. This number is smaller than expected from simulations (0.8 for the measured momenta). To some extent, TR overlap due to the finite time response of the detector and associated electronics accounts for this discrepancy, as illustrated in the lower panel. The minimum time interval between two TR photons resolved in the measurements is 0.2 s. Comparing to the distribution obtained in simulations with ideal 2-cluster resolution we find an overlap probability of 38%.
For higher momenta, increasing stiffness of the beam results in smaller separation to the TR photons and stronger rejection of detected clusters. As a consequence, the number of reconstructed TR clusters drops to 0.43 for 3 GeV/c.

|
|
5 TR energy
To relate the measured charge to the corresponding photon energy we compare the charge deposit in pion runs at B=0 to the simulated energy deposit [8]. To avoid any bias by single track space charge effects, which are maximal at perpendicular beam incidence, we use the charge collected at the beginning of the drift time, in the amplification region of the DC. The calibration factors obtained for each momentum from the most probable values (m.p.v.) of the measured charge and simulated energy spectra agree to an accuracy of 2.7%. The main sources of errors are: 1) the uncertainty of the assignment of the average pulse height distribution to the amplification region, which is determined for each run by variation of the interval of charge summation by 1 time bin. It is typically 10%. 2) the deviation of the measured relative to the simulated shape of the charge spectrum, due to the inhomogeneous field in the amplification region and lack of statistics, resulting in an error of 2.5% in determining the m.p.v.

|
|
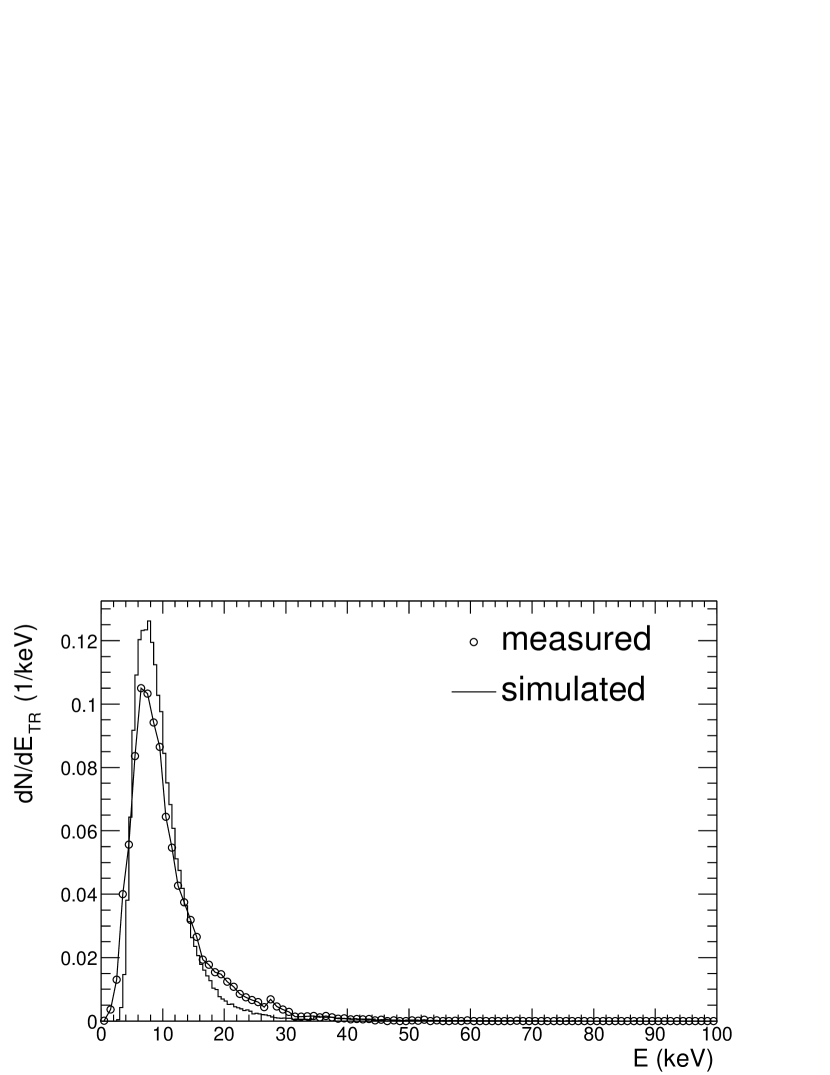
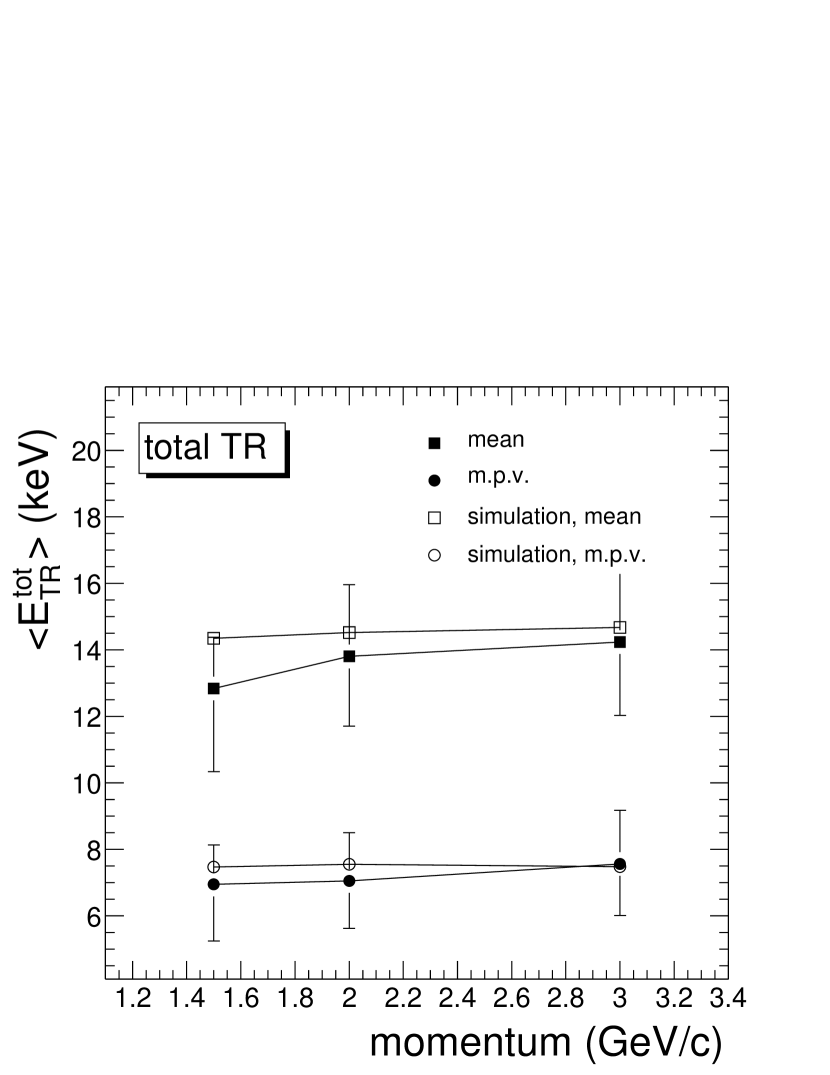
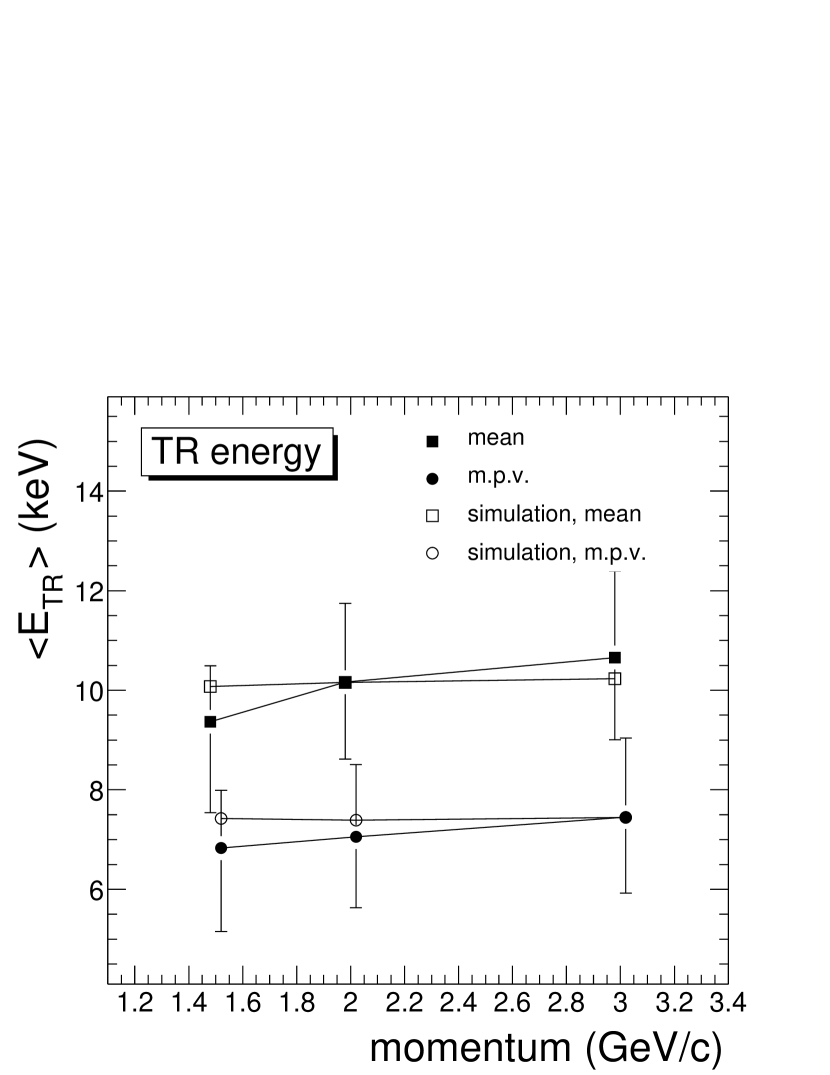
In Fig. 4 we present the spectra of total TR energy and energy per photon for a beam momentum of 2 GeV. The simulations reproduce the total TR spectrum, whereas the single photon spectrum has a more pronounced tail towards higher energies than calculated, as a consequence of cluster overlap. The evolution of the mean and m.p.v. of the spectra as function of momentum is shown in Fig. 5. The errors on the data points are a 5% uncertainty on the measured charge, reflecting the tolerance of the TR search algorithm to contamination from ionization, and the error of the energy calibration. The m.p.v. of the spectra is determined by a gaussian fit to the maximum. An additional error of 5% on the m.p.v. accounts for the variation of the fit with the fit interval. Within the measurement errors, which are dominated by the systematic error of the calibration, the simulations agree with the measured values. Consistently with [5] we observe a systematic increase of the TR yield as function of momentum. This trend is not reproduced by the simulations.
|
|
ALICE TRD collaboration
C. Adler1, A. Andronic2, V. Angelov3, H. Appelshäuser2, C. Blume4, P. Braun-Munzinger2, D. Bucher5, O. Busch2, V. Cătănescu6, V. Chepurnov7, S. Chernenko7, M. Ciobanu6, H. Daues2, D. Emschermann1, O. Fateev7, P. Foka2, C. Garabatos2, R. Glasow5, T. Gunji8, M. Gutfleisch3, H. Hamagaki8, J. Hehner2, N. Heine5, N. Herrmann1, M. Inuzuka8, E. Kislov7, V. Lindenstruth3, C. Lippmann2, W. Ludolphs1, T. Mahmoud1, A. Marin2, D. Miskowiec2, K. Oyama1, Yu. Panebratsev7, V. Petracek1, M. Petrovici6, A. Radu6, C. Reichling3, K. Reygers5, A. Sandoval2, R. Santo5, R. Schicker1, R. Schneider3, K. Schwarz2, S. Sedykh2, R.S. Simon2, L. Smykov7, H.K. Soltveit1, J. Stachel1, H. Stelzer2, H. Tilsner3, G. Tsiledakis2, I. Rusanov1, W. Verhoeven5, B. Vulpescu1, J. Wessels5, B. Windelband1, V. Yurevich7, Yu. Zanevsky7 and O. Zaudtke5
1Physikalisches Institut, Heidelberg, Germany; 2GSI, Darmstadt, Germany; 3Kirchhoff Institut, Heidelberg, Germany; 4Universität Frankfurt, Germany; 5Universität Münster, Germany; 6NIPNE Bucharest, Romania; 7JINR Dubna, Russia; 8University of Tokyo, Japan.
References
- [1] C.W. Fabjan and W. Struczinski, Phys. Lett. B 57(1975) 483.
- [2] M.L. Cherry and D. Müller, Phys. Rev. Lett. 38(1977) 5.
- [3] M.L. Cherry et al., Phys. Rev. D 10(1974) 3594.
- [4] G.M. Garibian et al., Nucl. Inst. Meth. 125(1975) 133.
- [5] A.Andronic for the ALICE TRD collaboration, these proceedings.
-
[6]
ALICE Collaboration, Transition Radiation Detector, Technical Design Report,
CERN/LHCC 2001-021,
http://www-alice.gsi.de/trd/tdr - [7] http://physics.nist.gov/PhysRefData/Xcom /Text/XCOM.html
- [8] A. Andronic et al., accepted to Nucl. Instr. Meth.