Creating a self-induced dark spontaneous-force optical trap for neutral atoms
Abstract
This communication describes the observation of a new type of dark spontaneous-force optical trap (dark SPOT) obtained without the use of a mask blocking the central part of the repumper laser beam. We observe that loading a magneto-optical trap (MOT) from a continuous and intense flux of slowed atoms and by appropriately tuning the frequency of the repumper laser is possible to achieve basically the same effect of the dark SPOT, using a simpler apparatus. This work characterizes the new system through measurements of absorption and fluorescence imaging of the atomic cloud and presents a very simple model to explain the main features of our observations. We believe that this new approach may simplify the current experiments to produce quantum degenerated gases
keywords:
high-density MOT, optical pumping, dark SPOT.Introduction
Laser cooling and trapping techniques have been very useful in the studies of atomic physics. Particularly the magneto-optical trap (MOT) has shown to be a versatile method to produce cold and relatively dense atomic samples. Its development is certainly one of the main responsible for the wide spreading of the cold and ultracold matter studies and applications [1]. In many of these studies is important to have a very dense sample of ultracold atoms populating the lower hyperfine ground state. However, in practice, there is a limit to the highest density attainable in a MOT, which is typically on the order of .
As it is well known, the limit to the density in a MOT is consequence of two major processes: cold-collision induced losses and secondary light scattering. The first impediment involves the cold collision of ground and excited state atoms within the trap, which allows transforming part of the excitation energy of the photon into kinetic energy of the colliding pair. This process eventually provides enough energy to the atoms to leave the trap [2]. In this case, higher densities imply in a larger collisions rate and leads to higher losses. Since the trap loss rate is usually on the order of , one has in practice samples with atomic densities on the order of . Secondary light scattering imposes another limitation to these systems. The reabsorption of emitted photons causes an outward radiation pressure [3] that prevents further increase of the density. Due to this second mechanism the loading normally occurs at constant density, where an increase in the number of atoms results in a increase of the volume [4].
In order to overcome both limitations Ketterle et al [5] developed the so called dark spontaneous-force optical trap, or simply ‘dark SPOT’, where the trapped atoms were spatially confined in a hyperfine ground state which does not interact with the trapping laser frequencies, staying therefore in the dark. This scheme provides an effective way to supplant the light scattering that causes the limitations mentioned before. This was accomplished by placing a physical obstacle to block the central region of the repumper laser beams. Atoms in the dark region are rapidly pumped to the lower energy ground state and do not interact with the lasers. The absence of light scattering in inner and most dense portion of the cloud causes a tremendous decrease in the repulsive force induced by photon secondary scattering as well as the ground-excited collisions rates and allowed them to obtain approximately sodium atoms in this type of ”dark MOT”. One of the main feature of the dark SPOT is to produce a very dense and compact distribution of ground state atoms, located in the center of the atomic trapped cloud. This achievement was an important step towards magnetic trapping of these atoms and the further realization of Bose Einstein Condensation [6].
In this paper we demonstrate a similar trap without the use of any obstacle in the repumper beam. The dark region, in our case, is created by the own atoms absorption. Using a continuous and intense flux of slowed sodium atoms in their ground state and adjusting the intensity and frequency of the repumper laser, we were able to capture about atoms in a configuration where the repumper beam is severally absorbed by the outer part of the atomic cloud, in this way the atoms in the center of the trap stay in a ”dark ground state”. We named this situation a self-induced dark MOT (SDMOT). It represents an improvement in the achievement of high density because it can be done even when a single electro-optically modulated laser beam is used for trapping the atoms. In the next sections we present a description of our experimental apparatus, followed by the results obtained by absorption of a probe laser beam. Finally we also present a simple model in order to explain some of the main features of our system.
1 Experimental Setup
A schematic diagram of our experimental setup is showed in figure 1. An effusive sodium beam is decelerated in a tapered solenoid by the Zeeman-tuned technique [7]. After the solenoid there is an extra coil that allows to extract an intense flux of slowed atoms [8]. These atoms are already in the lower hyperfine ground state, as discussed in the next section of this paper and explained in more details in reference [9] . In this configuration, to avoid any zero crossing in the value of the magnetic field, the current circulation in the extra coil is such that its field lines smoothly match the field lines of the MOT coils.
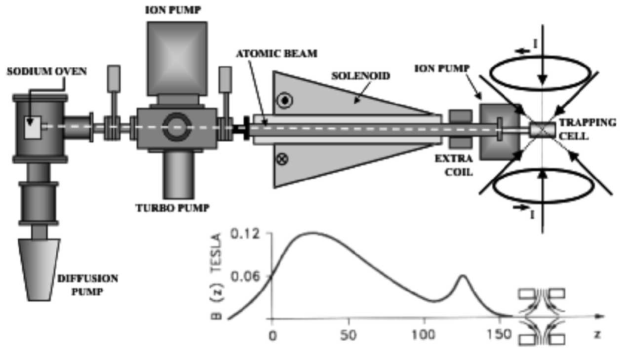
Three ring-cavity dye lasers provide the light for the slowing, trapping and repumping transitions. In order to do that, all the lasers are frequency stabilized and peak-locked to the appropriate optical transition, using a vapor cell and the saturated absorption signal. The laser frequencies are easily tuned to the red of the sodium atomic transitions and at the specified and detunings, through the use of acousto-optical modulators (AOM). Although in the measurements described here we have used two independent lasers to produce the SDMOT, we verified that similar results could be observed when a single laser was used for trapping. In that case an electro-optical modulator (EOM) tuned around 1.7 GHz is necessary to provide the repumping light. The main reason for choosing the extra dye laser was to easily change the repumper frequency, allowing for large repumping detunings. Once our home-built EOM has a resonance cavity, to enhance the electric field applied to the non-linear crystal [10], it would be somewhat trickier to do the same large frequency variation using only the EOM. In fact, the possibility of easily changing the frequency of the repumper light might be one of the reasons that allowed us to observe the above-mentioned effect.
The MOT is located in an ultra-high vacuum (UHV) glass cell, positioned at the end of the deceleration tube and in-line with the slowing process, as shown in figure 1. This configuration provides a very efficient coupling of the slowed atoms into the MOT. To avoid the undesirable mechanical effect of the strong slowing laser, tuned close to the transition, we use a variation of the Zeeman-tuned technique, which is discussed in details in reference [11]. The trap is created by six independent laser beam tuned to the red of the trapping and repumping transitions, respectively by the values and The repumper laser comes in four independent beams, aligned collinearly with the trapping beam in the horizontal plane.
Once the MOT laser beams and the quadrupole coils are activated we capture about atoms in the trap after the optimization of the MOT and slowing process parameters. In our system, the atomic cloud can be characterized either by fluorescence or absorption imaging using a triggerable digital CCD camera.
2 Emerging slowed atomic beam characteristics
In order to characterize the outgoing flux of slow atoms we have used a probe laser beam crossing the atomic beam at small angle. During this characterization the MOT lasers and the quadrupole magnetic coils were turned off. The fluorescence at the crossing position was imaged in a photomultiplier tube and the analysis of the fluorescence, as function of the probe frequency, allowed us to measure the velocity distribution of the output flux after deceleration. This measurement also allowed us to discriminate the population in each of the two ground states sub-levels.
Tuning the slower laser frequency close to the cycling transition and with the slowing magnet carrying a curent of about 45A, which produces a field approximately given by , for B given in gauss and z in meters, one obtains a flux of slow atoms emerging in the ground state level with a peak velocity of about 200 m/s. To obtain lower velocities at this condition the slowing laser frequency has to be tuned to the blue of the transition. This type of behavior has been already investigated by our group in the past [9] and it is mainly due to the adiabatic following of the atoms in the magnetic field during the slowing process. The measured velocity distribution is presented in figure 2. Decreasing the current of the slowing magnet to about 36A the situation is completely different and a large flux of very slow atoms emerges from the process in the ground state level. The output velocity of these atoms obey the relation , where is the slower laser detuning and is the wave vector.
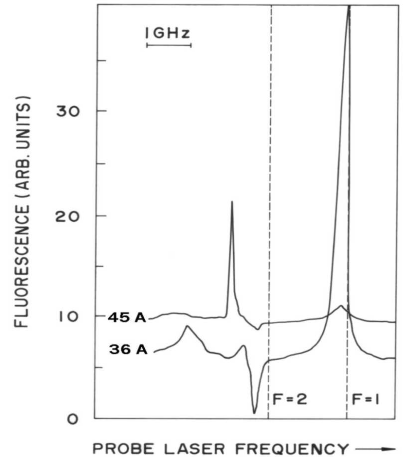
Although the atoms are decelerated in the cycling transition , as they approach the end of the slowing solenoid, the lower amplitude of the field as well as the configuration of the field lines create adequate conditions to optically pump the atoms to the state. At this point the deceleration process stops abruptly and the slowed atoms migrate out of the solenoid without interacting with the slowing laser. We measured about atoms/sec emerging from the slowing process near zero velocity and already in the state. The figure 2 also shows the velocity distribution for the atoms when the second operating condition is used. The peak velocity is nearly zero when and the distribution width is approximately 50 m/s. Recalling a previous measurement of the capture velocity of a MOT [12], one sees that a considerable portion of this flux can be captured by the trap.
3 Trapping the decelerated atoms
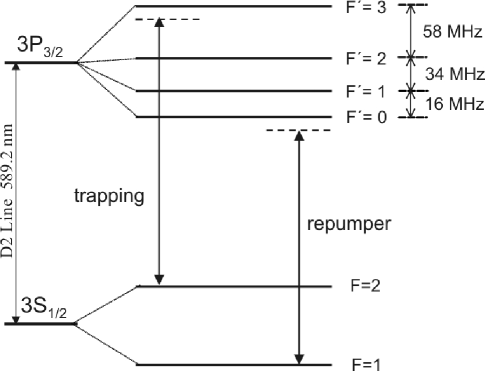
To be able to efficiently capture atoms in the MOT, the average atomic velocity has to be on the order of the capture velocity of the trap. We use a variant of the Zeeman-tuned technique [11] to provide the slow atoms for the MOT, which is kept in UHV conditions. Then, after activating the MOT coils and lasers, as the slowed atoms emerging in get into the capture region, they start to accumulate in the trap. The slowing laser frequency and Zeeman magnet current are optimized for capturing the maximum number atoms. In our experiment we used , with respect to the transition , and with respect to the transition. This situation is represented in figure 3. The loading time was about 0.6 seconds and the total number of trapped atoms was around atoms. Each of the six beams of the trapping laser had about , and on each of the four repumping beams. The beams had a gaussian profile with waist of approximately 1 cm FWHM.
To understand how the process actually works, we can consider the capture happening in the following way: atoms emerge from the slowing solenoid in the ground state, interacting with the repumping and trapping lasers they are pumped to state and initiate cycling in the strong transition, where the spatially selective light pressure capture them in the MOT . However, because of the high loading flux of atoms, there is a strong absorption of the repumper laser across the trapped cloud. As consequence of this fact, the repumper laser is attenuated and therefore atoms are no longer efficiently repumped to state. The result is an atomic cloud composed of two parts: an outside shell predominantly with atoms, interacting with both lasers, and an inner atomic cloud mainly pumped to the ground state. The inner part does not interact with the lasers and therefore is not subjected to the limitations of density discussed before. A schematic diagram of the physical situation is presented in figure 4, where the relative dimensions for both parts observed are represented.
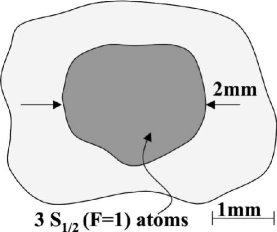
Using a weak probe beam, which could be tuned resonant with the and atomic transition, we have characterized the cloud with respect to both hyperfine ground state. In order to do that we imaged the probe beam on a CCD and observed the integrated absorption distribution along the probe beam path. A sequence of these images can be observed in figures 5 and 6. The maximum absorption observed of atoms was less than 50%, while for the atoms was higher than 95%. The outer diameter of the atoms was about when observe through the absorption image, the absorption for the shows a spatial distribution within of diameter. With the value of absorption and optical path we can calculate densities which are for atoms and for atoms. This situation characterizes what we have called a ’self dark SPOT’, where the inner part of the cloud is in the dark and the outside works as a regular MOT. These numbers are in agreement with the conventional dark SPOT reported in ref. [5].
We have observed that to obtain the self-induced dark SPOT the conditions on the repumper detuning and the efficiency of deceleration process are crucial. The figure 5 shows a sequence of absorption images for the atoms in different conditions of deceleration. As the magnetic field of the slower magnet is lowered, more atoms emerge in the state and the establishment of the SDMOT is remarkable. Usually, when the SDMOT is operating, one can see a strong absorption in a weak probe beam with bare eyes.
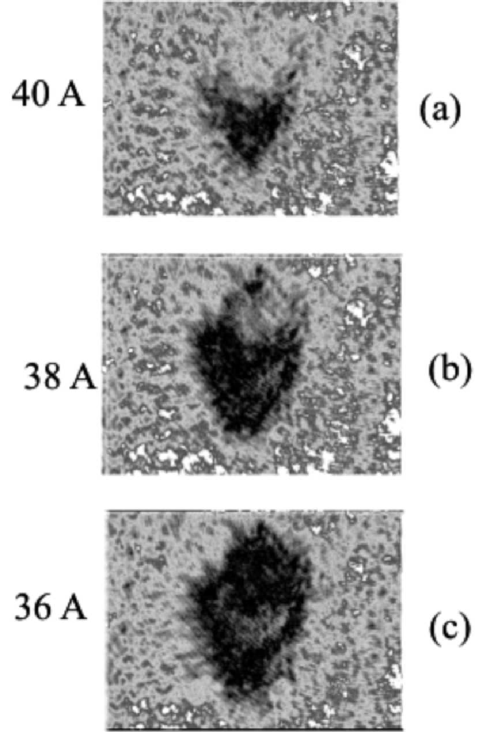
However, if the flux of atoms is not high enough to create the initial density profile, the subsequent pumping of the atoms to is not reached. It is interesting to note that is not only the absorption of the repumper that plays a role in the creation of a population difference across the cloud, but also the decrease in the absorption of the trap laser, which due to the higher intensity rapidly pumps the atoms to the lower hyperfine and accelerates the establishment of the differential population profile.
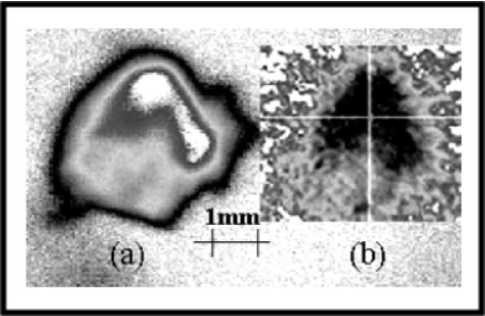
Figure 6 shows two images of the trap, where the first one (a) was obtained by fluorescence and the second (b) by absorption imaging. The absorption image was obtained with a weak probe laser, tuned to the . Both images have the same scale and where taken while the SDMOT was turned on. It is clearly observed that the absorption image of the atoms is concentrated in the inner part of the trap and its spatial distribution is smaller than the whole trap, which is represented in the fluorescence image. Irregularities on the trap image are mainly due to laser beam inhomogeneity and certain trap instabilities due to the high number of atoms.
4 A simple model for the SDMOT
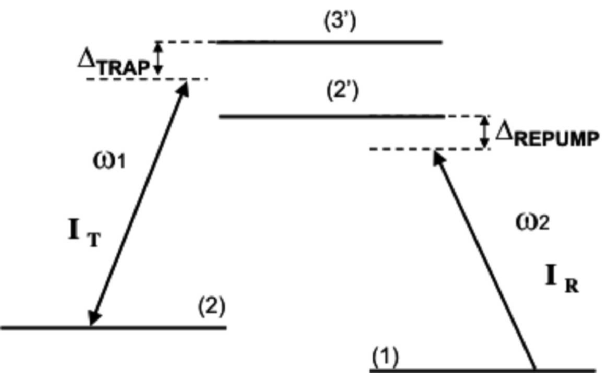
In order to understand our observations we present here a very simple analytical model to show the attenuation of the laser intensity along the cloud and the accumulation of the state atoms at the central part of the trap. The idea of the model is simply to point out the main features presented by the system. Our model considers the four-level system shown in figure 7. The levels (1) and (2) are respectively the ground states and while the levels and are the respective . We consider this four-level system in the presence of the two laser beams, the trapping and repumper laser, both represented in the figure 7 respectively by the frequencies and .
Using the rate equations for the transitions involved one can determine the local population ratio as a function of light intensity. In the equations below, is the number of atoms in state 2, while is the number in state 1. The local population ratio on steady state is given by:
| (1) |
where
| (2) |
| (3) |
| (4) |
The terms and are the local Rabi frequencies along a given -direction, while represents the intensity of trap laser and the repumper laser intensity along the same line. In all the equations the frequencies are expressed in MHz and the intensities in mW/mm as given by the reference [13]. In our case MHz and MHz (as represented by the figures 3 and 7). The calculation, which is a simplified one-dimensional version of the actual trap, starts considering an atomic cloud with homogenous distribution of atoms. As the lasers are turned on, the strong absorption of the repumper laser produces a population imbalance as predicted by equation (1). At each position, as the intensities and varies, higher concentration of atoms in appears. The final result, predicted by the rate equation model, is the establishment of a population and laser intensity profiles across the atomic cloud. At steady state the one-dimensional profile for atomic population and laser intensity are represented in figure 8.
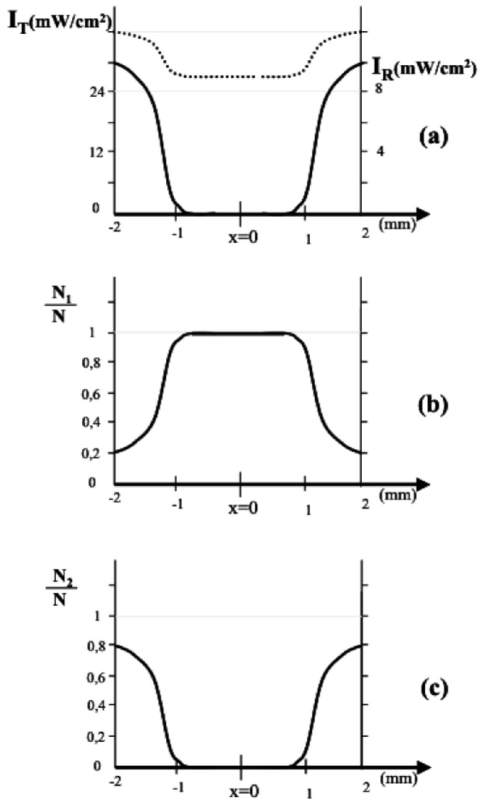
According to the figure 8(a) we see that the intensity of the trapping laser decreases only modestly, while the repumper is fully attenuated as it penetrates in atomic cloud. We also see that eventhough the population in is initially small at the outer part of the trapped cloud; it increases rapidly as the repumper laser is absorbed. The population in is complementary because in our model the local number obeys The importance of this model resides in showing the establishment of a population profile, which is qualitatively in concordance with our observations.
5 Conclusions
We have observed a new kind of dark SPOT, which is naturally produced by loading a standard MOT from an intense flux of slowed atoms in the state, and by adjusting the intensity and frequency of the repumper laser. Using the system described here it was possible to create a ”dark MOT ”, without spatially separating the and laser beams. The shadow in the light was created by the own absorption of the atoms, due to an accumulation of ”dark state ” atoms in the center of the trap. Because the resemblance of this process with the work of Ketterle et al [5], we named this new trap as self-induced dark MOT (SDMOT).
”Dark MOTs ” of this kind, where atoms stay predominantly in a ”dark” hyperfine level, not interacting with the trapping light, are an important to overcome density limitations of the standard MOT. We verified that the SDMOT works as good as the usual dark SPOT configuration, with the advantage that since it does not require spatially separated beams for trap and repumper, it can be simply operated with a single electro-optical modulator (EOM) to produce the repumping light. This simplifies the experimental setup also because it does not require special alignments to image the blocking disk, used as a physical obstacle in the repumper beam. However, the situation we have presented here depends upon a dense flux of atoms in conditions to be trapped, as well as some special tuning conditions for the repumping light. Some preliminary results also show that the temperature of those sample might be lower than the usual dark SPOT, but to understand such effect a more comprehensive theoretical model will be required, as well as other experimental investigations.
6 Acknowledgments
This work was developed at Center for Research in Optics and Photonics, CePOF, and it was supported by FAPESP, though the program CEPID. It also had support from the Brazilian national funding agency, CNPq.
References
- [1] See, for instance, the collection of selected papers on ultracold matter, in Nature 416 (2002) 6877.
- [2] J. Weiner, V. S. Bagnato, S. C. Zilio and P. Julienne, Rev. Mod. Phys. 71 (1999) 1.
- [3] T. Walker, D. Sesko, and C. Wieman, Phys. Rev. Lett. 64 (1990) 408.
- [4] T. Walker, P. Feng, D. Hoffman and R. Williamson, Phys. Rev. Lett. 69 (1992) 2168; L. Marcassa, V. Bagnato, Y. Wang, C. Tsao, and J. Weiner, O. Dulieu, Y. B. Band, P. S. Julienne, Phys. Rev. A 47 (1993) R4563.
- [5] W. Ketterle, K. B. Davis, M. A. Joffe, A. Martin, and D. Pritchard, Phys. Rev. Lett. 70 (1993) 2253.
- [6] M. H. Anderson, J. R. Ensher, M. R. Matthews, C. E. Wieman and E. A. Cornell - Science 269 (1995) 198; C. Bradley, C. Sackett and R. Hulet, Phys. Rev. Lett. 75 (1995) 1687; K. B. Davis, M.-O. Mewes, M. R. Andrews, N. J. van Druten, D. S. Durfee, D. M. Kurn and W. Ketterle, Phys. Rev. Lett. 75 (1995) 3969.
- [7] V. S. Bagnato, C. Salomon, E. Marega and S. C. Zilio, J. Opt. Soc. B 8 (1991) 497.
- [8] M. Firmino, C. A. Faria, S. C. Zilio and V. S. Bagnato, Phys. Rev. A 41 (1990) 4070.
- [9] R. Napolitano, S. C. Zilio and V. S. Bagnato, Opt. Comm. 80 (1990) 110.
- [10] J. F Kelly, A. Gallagher, Rev Sci. Instrum. 58 (1987) 563.
- [11] S. G. Miranda, S. R. Muniz, G. D. Telles, L. G. Marcassa, K. Helmerson and V. S. Bagnato, Phys. Rev. A 59 (1999) 882.
- [12] S. R. Muniz, K. M. F. Magalhães, Ph. W. Courteille, M. A. Perez, L. G. Marcassa, and V. S. Bagnato, Phys. Rev. A 65 (2001) 015402; V. S. Bagnato, L. G. Marcassa, S. G. Miranda, S. R. Muniz, and A. L. de Oliveiraz, Phys. Rev. A 62 (2000) 013404.
- [13] P. M. Farrel, W. R. MacGillivray, and M. C. Standage, Phys. Rev. A 37 (1998) 4240.