physics/0401007
January 2004
The CAVES Project - Exploring Virtual Data Concepts for Data Analysis
To Dad
Abstract
The Collaborative Analysis Versioning Environment System (CAVES) project concentrates on the interactions between users performing data and/or computing intensive analyses on large data sets, as encountered in many contemporary scientific disciplines. In modern science increasingly larger groups of researchers collaborate on a given topic over extended periods of time. The logging and sharing of knowledge about how analyses are performed or how results are obtained is important throughout the lifetime of a project. Here is where virtual data concepts play a major role. The ability to seamlessly log, exchange and reproduce results and the methods, algorithms and computer programs used in obtaining them enhances in a qualitative way the level of collaboration in a group or between groups in larger organizations. It makes it easier for newcomers to start being productive almost from day one of their involvement or for referees to audit a result and gain easy access to all the relevant details. Also when scientists move on to new endeavors they can leave their expertise in a form easily utilizable by their colleagues. The same is true for archiving the knowledge accumulated in a project for reuse in future undertakings.
The CAVES project takes a pragmatic approach in assessing the needs of a community of scientists by building series of prototypes with increasing sophistication. In extending the functionality of existing data analysis packages with virtual data capabilities these prototypes provide an easy and habitual entry point for researchers to explore virtual data concepts in real life applications and to provide valuable feedback for refining the system design. The architecture is modular based on Web, Grid and other services which can be plugged in as desired. As a proof of principle we build a first system by extending the very popular data analysis framework ROOT, widely used in high energy physics and other fields, making it virtual data enabled.
I INTRODUCTION
Most data in contemporary science are the product of increasingly complex computations and procedures applied on the fast increasing flows of raw information coming from more and more sophisticated measurement devices (the “measurements”), or from growingly detailed numeric simulations - e.g. pattern recognition, calibration, selection, data mining, noise reduction, filtering, estimation of parameters etc. High energy physics and many other sciences are increasingly CPU and data intensive. In fact, many new problems can only be addressed at the high data volume frontier. In this context, not only data analysis transformations, but also the detailed log of how those transformations were applied, become a vital intellectual resource of the scientific community. The collaborative processes of these ever-larger groups require new approaches and tools enabling the efficient sharing of knowledge and data across a geographically distributed and diverse environment.
Here is where the concept of virtual data is bound to play a central role in the scientific analysis process. We will explore this concept using as a case study the coming generation of high energy physics (HEP) experiments at the Large Hadron Collider (LHC), under construction at the European Laboratory for Particle Physics CERN close to Geneva, Switzerland. This choice is motivated by the unprecedented amount of data (from petabytes to exabytes) and the scale of the collaborations that will analyze it (four worldwide collaborations, the biggest two with more than two thousand scientists each). At the same time, the problems to be solved are general and will promote scientific discoveries in different disciplines, enhance business processes and improve security. The challenge facing HEP is a major driving force for new developments in computing, e.g. the Grid gridblueprint ; gridanatomy . The computing landscape today is marked by the rise of Grid gridphysiology and Web services w3cwebserv and service oriented architectures (SOA) soa . An event-driven SOA is well suited for data analysis and very adaptable to evolution and change over time. In our project we will explore and adopt service oriented solutions as they mature and provide the performance needed to meet mission-critical requirements.
This paper is organized as follows: in the next section we introduce the concept of virtual data, than we discuss the issues arising when dealing with data equivalence, describe how data analysis is done in HEP, digress with a metaphor, elucidate the ideas driving the CAVES project, continue with a detailed treatment of the CAVES architecture, sketch the first implementation, discuss the relationship with other Grid projects, and conclude with an outlook.
II VIRTUAL DATA
The scientific analysis process demands the precise tracking of how data products are to be derived, in order to be able to create and/or recreate them on demand. In this context virtual data are data products with a well defined method of production or reproduction. The concept of “virtuality” with respect to existence means that we can define data products that may be produced in the future, as well as record the “history” of products that exist now or have existed at some point in the past.
The virtual data paradigm logs data provenance by tracking how new data is derived from transformations on other data chimera ; chimera2 . Data provenance is the exact history of any existing (or virtual) data product. Often the data products are large datasets, and the management of dataset transformations is critical to the scientific analysis process.
We need a “virtual data management” tool that can “re-materialize” data products that were deleted, generate data products that were defined but never created, regenerate data when data dependencies or algorithms change, and/or create replicas at remote locations when recreation is more efficient than data transfer.
From the scientist’s point of view, data trackability and result auditability are crucial, as the reproducibility of results is fundamental to the nature of science. To support this need we require and envision something like a “virtual logbook” that provides the following capabilities:
-
•
easy sharing of tools and data to facilitate collaboration - all data comes complete with a “recipe” on how to produce or reproduce it;
-
•
individuals can discover in a fast and well defined way other scientists’ work and build from it;
-
•
different teams can work in a modular, semi-autonomous fashion; they can reuse previous data/code/results or entire analysis chains;
-
•
on a higher level, systems can be designed for workflow management and performance optimization, including the tedious processes of staging in data from a remote site or recreating it locally on demand (transparency with respect to location and existence of the data).
III DATA EQUIVALENCE
If we delete or accidentally loose a piece of data, having a log of how it came into existence will come in handy. Immediately the question arises: is the “new” chunk of data after reproduction identical to the “old” one? There are two extreme answers to this question:
-
•
the two pieces of data are identical bitwise - we are done;
-
•
not only are the two pieces of data not identical bitwise, but they contain different information from the viewpoint of the application using them.
The second point needs discussion: clearly two chunks of data can be “identical enough” for some types of applications and different for other types. Each application has to define some “distance” measure between chunks of data and specify some “minimal” distance between chunks below which the pieces are considered identical. In this language bitwise sameness would correspond to zero distance.
Let us illustrate this with two examples. In an ideal world, if we generate events with the Monte Carlo method, starting from the same seeds and using portable random number generators, we should get the same sequence of events everywhere. Or if we do Monte Carlo integration, we should get exactly the same result. In practice, due to floating point rounding errors, even on systems with processors with the same word length simulations tend to go down different branches, diverging pretty soon. So the results are not guaranteed to be identical bitwise. Usually this is not a problem: two Monte Carlo integrations within the statistical uncertainty are certainly acceptable. And even two different sequences of events, when their attributes are statistically equivalent (e.g. histograms of all variables, correlations etc.), are good enough for many practical purposes. There are exceptions though: if our code crashes at event 10583, we would like to be able to reproduce it bitwise. One way to proceed in such a situation is to store the initial random seeds for each event along with the how-to (i.e. the algorithm and code for producing events). Then any single divergence will affect at most one event.
The second example is analysis of real data. If we are interested in statistical distributions (histograms, scatter plots, pie charts etc.), a “weak” equivalence in the statistical sense can be enough. If we are selecting e.g. rare events in a search for new particles, we would like to isolate the same sample each time we run a particular selection on the same input (“strong” equivalence). One way to proceed here is to keep the list of selected events along with the how-to of the selection for future verifications. As long as the input sample is available, we will have reproducibility of the selection even if portability is not guaranteed.
To sum it up - each application has to define criteria establishing the equivalence of data for its domain. Good choice of metadata about a chunk of data (e.g. a dataset) can be very useful later when trying to decide if your reproduction is good enough. For instance, if we kept the moments like mean value and standard deviation with their statistical uncertainties from a distribution with millions of events, it will help in determining if our replica is statistically equivalent later.
Last but not least, an important aspect in recording the data provenance is the level of detail. The result of the execution of the same algorithm with the same input in today’s complex software world may depend on environment variables, linked libraries containing different versions of supporting applications, different compilers or levels of optimization etc. When these factors are important, they have to be included in the data provenance log for future use.
IV DATA ANALYSIS IN HEP
The high energy physics field is sociologically very interesting. The experimental collaborations have grown from being counted on the fingers of one or two hands in the sixties to around five hundred in the nineties and two thousand today. Even in theoretical physics collaborations are growing with time. That explains why the field was always in the forefront of developing and/or adopting early new collaborative tools, the best known example being of course the invention of the World Wide Web at CERN. At present, the LHC experiments are heavily involved in Grid efforts, continuing the tradition, see e.g. griphyn ; ppdg ; eudatagrid ; ivdgl ; lcg ; egee .
After a high energy physics detector is triggered, the information from the different systems is read and ultimately recorded (possibly after cleaning, filtering and initial reconstruction) to mass storage. The high intensity of the LHC beams usually results in more than one interaction taking place simultaneously, so a trigger records the combined response to all particles traversing the detector in the time window when the system is open. The first stages in the data processing are well defined and usually tightly controlled by the teams responsible for reconstruction, calibration, alignment, “official” simulation etc. The application of virtual data concepts in this area is discussed e.g. in cmsprod .
Here we are interested in the later stages of data processing and analysis, when various teams and individual scientists look at the data from many different angles - refining algorithms, updating calibrations or trying out new approaches, selecting and analyzing a particular data set, estimating parameters etc., and ultimately producing and publishing physics results. Even in today’s large collaborations this is a decentralized, ”chaotic” activity, and is expected to grow substantially in complexity and scale for the LHC experiments. Decentralization does not mean lack of organization - on the contrary, this will be one of the keys for building successful structures, both from the social and technical points of view. Clearly flexible enough systems, able to accommodate a large user base, and use cases not all of which can be foreseen in advance, are needed. Many users should be able to work and share their results in parallel, without stepping on each other’s toes. Here we explore the benefits that a virtual data system can bring in this vast and dynamic field.
Moving from production to analysis, the complexity grows fast with the number of users while the average wall and CPU time to complete a typical task goes down, as illustrated in Figure 1.
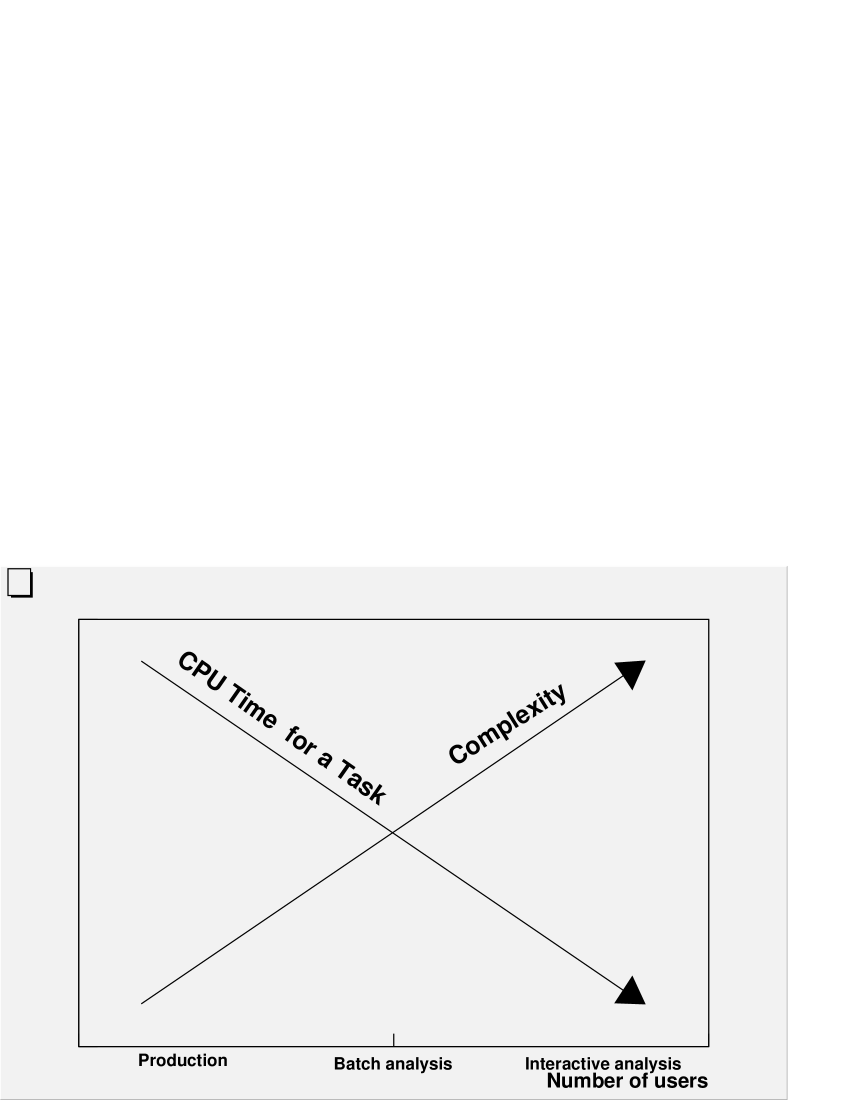
An intermediate phase are large analysis tasks which require batch mode. The ultimate challenge comes from interactive analyses, where users change their minds often and need fast response times to stay productive. The latency of the underlying systems at this stage is critical. There should be no single point of failure and the system should re-route requests automatically to the next available service. The redundancy should be accompanied by efficient synchronization, so that new results are published fast and made accessible for all interested parties regardless of their geographical location.
An important feature of analysis systems is the ability to build scripts and/or executables “on the fly”, including user supplied code and parameters. On the contrary, production systems often rely on pre-build applications, distributed in a centralized way from “officially controlled” repositories. The user should be in position to modify the inputs on her/his desk(lap)top and request a derived data product, possibly linking with preinstalled libraries on the execution sites. A grid-type system can store large volumes of data at geographically remote locations and provide the necessary computing power for larger tasks. The results are returned to the user or stored and published from the remote site(s). An example of this vision is presented in Arbree:2003wh . At each stage in the analysis interesting events can be visualized and plots for all quantities of interest can be produced.
What will a virtual data system bring to this picture? I have in my office a large collection of paper folders for different analyses performed working on various tasks, stored in varied ways. They match with codes stored and archived on different systems. So when a colleague comes in and asks me how I obtained that plot three months ago, I have to sift for some time (depending on my organization) through my folders, make a photocopy, then find the corresponding code, make sure it is the “historically” right version, and that I wrote down which version of the pattern recognition was used at the time etc. Or if I go to my colleague, she will go through similar steps, but her organization will be different and we will possibly exchange information in a different format. Or if one of us is on leave things will slow down. So we are recording data provenance, but manually, very often incomplete, and not easily accessible. And clearly this scales poorly for larger and geographically distributed collaborating groups.
In a “virtual logbook” all steps of an analysis, even the blind alleys, can be recorded and retrieved automatically. Let us assume that a new member joins the group. Even without bugging one’s colleagues too often, it will be quite easy to discover exactly what has been done so far for a particular analysis branch, to validate how it was done, and to refine the analysis. A scientist wanting to dig deeper can add a new derived data branch by, for example, applying a more sophisticated selection, and continuing to investigate down the new road. Of course, the results of the group can be shared easily with other teams and individuals in the collaboration, working on similar topics, providing or re-using better algorithms etc. The starting of new subjects will profit from the availability of the accumulated experience. At publication time it will be much easier to perform an accurate audit of the results, and to work with internal referees who may require details of the analysis or additional checks.
V A METAPHOR
At the beginning of a new project, a suitable metaphor can be helpful. As we would like to make our “virtual data logbooks” persistent, distributed and secure, the following analogy came quite naturally:
-
•
A cave is a secure place to store stuff.
-
•
Usually you need a key to enter.
-
•
Stuff can be retrieved when needed (and if the temperature is kept constant, usually in good shape).
-
•
Small caves can be private, larger ones are usually owned by cooperatives.
-
•
When a cave is full, a new one is build.
-
•
To get something, one starts at the local caves and, if needed, widens the search …
We can go on, but, as we will see in a moment, these are striking similarities with the goals of our project, so CAVES seemed a peculiarly apt name. The use of metaphors is inspired from the adoption of extreme programming techniques beck in our project. For their relationship to the programming style in HEP see carmin .
VI CAVES PROJECT
The Collaborative Analysis Versioning Environment System (CAVES) project concentrates on the interactions between users performing data and/or computing intensive analyses on large data sets, as encountered in many contemporary scientific disciplines. In modern science increasingly larger groups of researchers collaborate on a given topic over extended periods of time. The logging and sharing of knowledge about how analyses are performed or how results are obtained is important throughout the lifetime of a project. Here is where virtual data concepts play a major role. The ability to seamlessly log, exchange and reproduce results and the methods, algorithms and computer programs used in obtaining them enhances in a qualitative way the level of collaboration in a group or between groups in larger organizations.
It makes it easier for newcomers to start being productive almost from day one of their involvement or for referees to audit a result and gain easy access to all the relevant details. Also when scientists move on to new endeavors they can leave their expertise in a form easily utilizable by their colleagues. The same is true for archiving the knowledge accumulated in a project for reuse in future undertakings.
The CAVES project takes a pragmatic approach in assessing the needs of a community of scientists by building series of prototypes with increasing sophistication. Our goal is to stay close to the end users and listen carefully to their needs at all stages of an analysis task. In this way we can develop an architecture able to satisfy the varied requirements of a diverse group of researchers.
Our main line of development draws on the needs of, but is not limited to, high energy physics experiments, especially the CMS collaboration cms ; cmssoft ; cmsweb , planning to begin data taking in 2007 at the Large Hadron Collider. The CMS experiment will produce large amounts of simulated and real data, reaching tens and hundreds of petabytes. The analysis of datasets of this size, with its distributed nature, by a large community of users is a very challenging task and one of the strongest driving forces for Grid computing. The CAVES project explores and develops these emerging technologies to facilitate the analysis of real and simulated data. We start by analyzing the simulated data from the data challenges of the CMS experiment, which will grow in scale and complexity approaching the situation when real data will start to flow.
In extending the functionality of existing data analysis packages with virtual data capabilities, we build functioning analysis suites, providing an easy and habitual entry point for researchers to explore virtual data concepts in real life applications, and hence give valuable feedback about their needs, helping to guide the most useful directions for refining the system design. By just adding capabilities in a plug-in style we facilitate the acceptance and ease of use, and thus hope to attract a critical mass of users from different fields in a short time. There is no need to learn yet another programming language, and our goal is simplicity of design, keeping the number of commands and their parameters to the bare minimum needed for rich and useful functionality.
The architecture is modular based on Web, Grid and other services which can be plugged in as desired. In addition to working in ways considered standard today the scientists are able to log or checkpoint their work throughout the lifetime of an analysis task. We envisage the ability to create private “checkpoints” which can be stored on a local machine and/or on a secure remote server. When an user wants to share some work, he can store the relevant know-how on the group servers accessible to the members of a group working on a given task. This could be a geographically distributed virtual organization. In the case of collaboration between groups or with internal or external referees portions of this know-how can be made accessible to authorized users, or a shared system of servers can be created as needed. The provenance of results can be recorded at different levels of detail as decided by the users and augmented by annotations. Along with the knowledge of how analyses are performed, selected results and their annotations can be stored in the same system. They can be browsed by the members of a group, thus enhancing the analysis experience both for experts and newcomers. When desirable, information from different phases of an analysis can easily be shared with other groups or peers.
We stressed already the value of complete logs. In the heat of an active analysis session, when there is no time or need to be pedantical, users may see merit in storing sometimes also partial logs, a classical example being a program with hidden dependencies, e.g. the calling of a program or reading of a file within a program, not exposed externally. In this case, the data product is not reproducible, but at least the log will point what is missing. Or the users may even store a non-functional sequence of actions in the debugging phase for additional work later, even without producing a virtual data product. Our system should be able to support partial logging, provided that the users are aware of the limitations and risks of this approach.
An important point is how groups will structure their analyses. Each virtual data product needs an unique identifier, which may be provided by the users or appended automatically by the system with e.g. project id, user id and date to render it unique. For smaller tasks, all identifiers and logs can be located in a single place, like a big barrel in a cave. Then the group will benefit from adopting a policy for meaningful selection of identifiers, making subsequent browsing and finding of information easy. For larger projects the virtual data space can be structured in chunks corresponding to subtasks, like many barrels in a large cave. Then at the beginning of a session the user will select the barrel to be opened for that session. When needed, information from related (linked) barrels can be retrieved. In principal there are no restrictions on how deep the hierarchy can be, only the practical needs will determine it.
We base our first functional system on popular and well established data analysis frameworks and programming tools, making them virtual data enabled. In the course of our project we will leverage best-of-breed existing technologies (e.g. databases, code management systems, Web services), as well as the developments in forward-looking Grid enabled projects, e.g. the virtual data system CHIMERA chimera ; chimera2 , the CLARENS server clarens for secure remote dataset access, the Condor condor , PEGASUS pegasus and SPHINX sphinx schedulers for executing tasks in a Grid environment. Further down the road we envisage building distributed systems capable of analyzing the datasets used in the CMS collaboration at all stages of data analysis, starting from Monte Carlo generation and simulation of events through reconstruction and selection all the way to producing results for publication. We plan to use the Grid test bed of the Grid Physics Network (GriPhyN) project griphyn for Grid enabling the collaborative services. The GriPhyN Project is developing Grid technologies for scientific and engineering projects that will collect and analyze distributed, petabyte-scale datasets. GriPhyN research will enable the development of Petascale Virtual Data Grids (PVDGs) through its Virtual Data Toolkit (VDT vdt ).
VII CAVES ARCHITECTURE
The CAVES system can be used as a building block for a collaborative analysis environment, providing “virtual data logbook” capabilities and the ability to explore the metadata associated with different data products.
Our first functioning system extends the very popular object-oriented data analysis framework ROOT root , widely used in high energy physics and other fields, making it virtual data enabled. The ROOT framework provides a rich set of data analysis tools and excellent graphical capabilities, able to produce publication-ready pictures. It is easy to execute user code, written in C++, and to extend the framework in a plug-in style. New systems can be developed by subclassing the existing ROOT classes. And the CINT cint interpreter runs the user code “on-the-fly”, facilitating fast development and prototyping. All this is very helpful in the early phases of a new project. In addition, ROOT has a large and lively user base, so we plan to release early and often and to have a development driven largely by user feedback. Last but not least, ROOT is easy to install and very portable. Versions for many flavors of LINUX and UNIX and for Windows are available.
We leverage a well established source code management system - the Concurrent Versions System CVS cvs . It is well suited to provide version control for a rapid development by a large team and to store, by the mechanism of tagging releases, many versions so that they can be extracted in exactly the same form even if modified, added or deleted since that time. The CVS tags assume the role of unique identifiers for virtual data products. CVS can keep track of the contributions of different users. The locking mechanism makes it possible for two or more people to modify a file at the same time, important for a team of people working on large projects. The system has useful self-documenting capabilities. Besides the traditional command line interface several products provide Web frontends which can be used when implementing Web services. All these features of CVS make it a good match for our system. Nowadays CVS is already installed by default on most UNIX and LINUX systems and a Windows port is available. In this way, our system can be used both from UNIX and Windows clients, making it easy for users at all levels to reproduce results.
A key aspect of the project is the distributed nature of the input data, the analysis process and the user base. This has to be addressed from the earliest stages. Our system should be fully functional both in local and remote modes, provided that the necessary repositories are operational and the datasets available. This allows the users to work on their laptops (maybe handhelds tomorrow) even without a network connection, or just to store intermediate steps in the course of an active analysis session for their private consumption, only publishing a sufficiently polished result. This design has the additional benefit of utilizing efficiently the local CPU and storage resources of the users, reducing the load on the distributed services (e.g. Grid) system. The users will have the ability to replicate, move, archive and delete data provenance logs. Gaining experience in running the system will help to strike the right balance between local and remote usage. More details about the distribution of services is given in the next section.
The architecture of CAVES builds upon the concept of sandbox programming. By sandbox programming we mean users work on per session basis, creating a new sandbox for a given session. All the changes or modifications and work the user does in a session between checkpoints is logged into a temporary logfile, which can be checked in the CVS repository with a unique tag. The system checks if the user executed external programs (in the ROOT case these are typically C++ programs) and logs them automatically with the same tag. Here an interesting point arises: a possible scenario is that a user runs the same program many times, just varying the inputs. In this case CVS will do the right thing: store the program only once, avoiding duplication of code, and tagging it many times with different tags, reflecting the fact that the program was executed several times to produce distinct data products. Or the user can choose during the same session to browse through the tags of other users to see what work was done, and select the log/session of interest by extracting the peers log with the tag used to log the corresponding session activities. Here two modes of operation are possible: the user may want to reproduce a result by extracting and executing the commands and programs associated with a selected tag, or just extract the history of a given data product in order to inspect it, possibly modify the code or the inputs and produce new results.
We also have the concept that users can log annotations or results in the repository along with the data provenance, storing useful metadata about a data product for future use (see the discussion in the data equivalence section). It is possible to record the metadata in relational databases too, e.g. in popular open source products like MySQL MySQL , so that another user first queries the database to retrieve the annotations or condensed logs of what other users have done already. This approach will ensure scalability for large groups of researchers accumulating large repositories, and will reduce the load on the CVS servers, improving the latency of the overall system. In this case the searching of a database is expected to be faster than the direct search for a given tag among a large number of stored tags. This will be investigated by building functional systems and monitoring their performance. The additional burden of synchronizing the information between the databases and the repositories is worthwhile only if we can improve the overall performance and scalability of the system. A further enhancement can come from retrieving first the metadata, and only if the user is interested, the complete log about a particular data product.
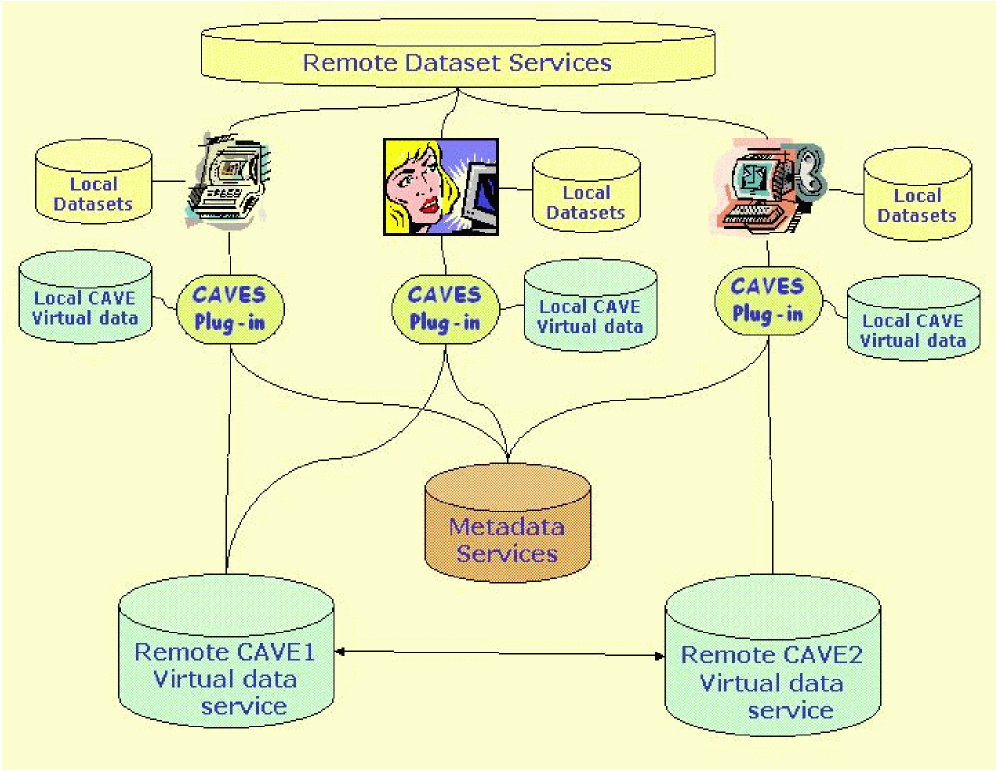
The architecture is shown in graphical form in Figure 2.
Let us discuss now some possible scenarios, which can take place in our architecture.
Case1: Simple
User 1 : Does some analysis and produces a result with tag
projectX-stepY-user1.
User 2: Browses all current tags in the repository and fetches
the session stored with tag projectX-stepY-user1.
Case2: Complex
User 1 : Does some analysis and produces a result with tag
projectX-stepY-user1.
User 2: Browses all current tags in the repository and fetches
the session stored with tag projectX-stepY-user1.
User 2: Does some modifications in the code files, which
were obtained from the session of user1, runs again and stores the changes
along with the logfile with a new tag
projectX-stepY-modcode-user2.
User 1: Browses the repository and discovers that the previous
session was used and contains modified or new code files, so decides
to extract that session using the new tag
projectX-stepY-modcode-user2 and possibly reuse it to
produce the next step and so on.
This scenario can be extended to include an arbitrary number of steps and users
in a working group or groups in a collaboration.
Based on our work so far, the following set of commands emerges as useful:
-
1.
Session commands:
-
•
open : authentication and authorization, connection, selection of CVS services, local or remote mode, the barrel to be opened etc.
-
•
close : save opened sessions, clean-up etc.
-
•
-
2.
During analysis:
-
•
help : get help for a command or list of commands
-
•
browse : browse all tags in (a part of) a repository, subsets of tags beginning or containing a string etc; possibly browse the metadata about a specific virtual data product e.g. by clicking on a selected tag from a list displayed in a graphical user interface
-
•
startlog : define the starting checkpoint for a log (part of a session between user-defined points), which will be closed by a log command
-
•
log : log (part of) a session between user-defined checkpoints together with all programs executed in the session; this may be a complete or optionally a partial log with user-defined level of detail
-
•
annotate : store user-supplied notes (metadata) about the work being done, preferably in a concise and meaningful manner; optionally, selected results can be stored along with the annotations e.g. a summary plot, subject of course to space considerations; this can be a separate command or part of the log command e.g. the user may select to be prompted to provide annotations when logging a tag
-
•
inspect : get a condense (annotations plus user commands, in a sense something like header files), or the complete log for a tag including the programs executed, but do not reproduce the data product; useful for reusing analysis work
-
•
extract : in addition to inspect, reproduce the virtual data product
-
•
-
3.
Administrative tasks:
-
•
copy : clone a log to a new repository
-
•
move : as you expect
-
•
delete : remove a log; CVS has the nice feature of storing such files in the Attic, so it is similar to moving a file in the Trash can without emptying it
-
•
archive : store in an archive (e.g. a mass storage system)
-
•
retrieve : retrieve from an archive (for whole repositories normal CVS techniques can be used).
-
•
Our first release is based on the minimal scope of commands providing interesting functionality. Future developments will be guided by the value users put on different options. As we want a fast release cycle this limits the number of features introduced and tested in any new version. The command set is extensible and new commands may be introduced as needed.
VIII FIRST IMPLEMENTATION
In this section we sketch the process of building the first CAVES release as prototype of a real analysis system, and examine some of the issues that arise. The first prototype has been demonstrated at the Supercomputing conference in Phoenix, Arizona, in November 2003, and the first release was made public on December 12, 2003. More details can be found in cavestalk01 , and an in-depth technical description about the virtual data enabled ROOT client and the remote services is in preparation caves01 .
We limit the scope to the most basic commands described in the previous section:
-
•
open : sets the CVS service (default or user choice)
-
•
help: short help about the commands below
-
•
browse : browse tags in the repository
-
•
log : log part of a session between user-defined checkpoints
-
•
extract : reproduce a virtual data product.
These commands are implemented by subclassing basic ROOT classes. Commands not recognized by our system are delegated to ROOT for execution or catching exceptions.
The ROOT framework provides the ability to access both local and remote files and datasets. One way to realize the second option is to store datasets on APACHE apache servers which are ROOT-enabled with a plug-in provided by the ROOT team. In this way we implement a remote data service from Web servers.
The CVS system also is able to access both local and remote repositories. One way to realize the second option is to use the CVS pserver. Contrary to some opinions it can be configured in quite a secure and efficient way as follows: the remote users need just CVS accounts with password authentication, they never get UNIX accounts on the server. A dedicated CVS user (or several for different groups) acts on their behalf on the server. The mapping is done by a special CVS administrative file. Similar design was adopted by the Globus globus toolkit with the grid mapfiles to control user access to remote sites, the only difference being the use of certificates in place of passwords, thus enhancing the security and providing a temporarily limited single sign-on to a Grid. The virtual organization tools developed by Globus can be used also for CVS services. In addition, we implement access control lists per CVS user for reading of the repository or writing to specific directories only for authorized users. This makes the server secure: even compromising the password a normal user can not modify administrative files and thus can not run shell commands on the server. Only the administrator needs an UNIX server account. Adding and managing CVS users is undoubtedly much simpler, safer and more scalable compared to dealing with UNIX accounts, not to talk about the dreaded group variety. A single server can handle multiple repositories, making it easy to “fine structure” projects.
To test the functionality after each modification we have a test suite: we use events generated with PYTHIA pitia (or the CMS PYTHIA implementation in CMKIN), and analyze, histogram and visualize them with code pythview (for results obtained with this code see e.g. Bourilkov:2003kj ; Bourilkov:2003kk ) built on top of the object-oriented data analysis framework ROOT root . To conclude we give a couple of snapshots of the first CAVES system in action:
START a virtual data enabled ROOT client: rltest

rltest

*************************************************************************
*                        Welcome To CAVES                               *
*       Collaborative Analysis Versioning Environment System            *
*                                                                       *
*                  Dimitri Bourilkov & Mandar Kulkarni                  *
*                       University of Florida                           *
*                         Gainesville, USA                              *
*                                                                       *
*                  You are Welcome to visit our website                 *
*                       cern.ch/bourilkov/caves.html                    *
*************************************************************************

 Please set the cvs pserver OR hit enter for default

CAVES:

 Pserver for this session:  :pserver:test@ufgrid02.phys.ufl.edu:/home/caves

*************************************************************************
*                        TO GET STARTED:                                *
*                  just type  help  at the command prompt               *
*                                                                       *
*            commands beginning with ’.’ are delegated to ROOT          *
*************************************************************************
CAVES: help

List of commands and how to use them:

  === help : to get this help

    help

  === browse : to list all existing tags or a subset beginning with string
  ===>       de facto the content of the virtual data catalog is displayed

    browse
    browse <prefix-string-of-tag>

  === log : to store all command line activities of the user labeling them with a tag
  ===         the actions after the last log command OR
  ===         from the beginning of the session are stored
  ===
  ===         <tag> must be CVS compliant i.e. start with uppercase or lowercase letter
  ===         and contain uppercase and lowercase letters, digits, ’-’ and ’_’
  ===         HINT: this a powerful tool to structure your project
  ===
  ===>      in effect this logs how a chunk of virtual data was produced
  ===>      and can be (re)produced later; the macro files executed by the user
  ===>      are stored in their entirety along with the command line activities
  ===>      creating a complete log

    log <tag>

  === extract : to produce a chunk of virtual data identified by a tag
  ===>      the necessary macro files are downloaded automatically to the client
  ===>      and can be reused and modified for new analyses

    extract <tag>

CAVES: browse
higgs-ww-plotpxpypz-500  Ψ(revision: 1.5)

higgs-ww-plotpxpypz-100  Ψ(revision: 1.4)


CAVES: extract higgs-ww-plotpxpypz-500
********************Storing data for usage....*********************
ROOT Command is :.x
Macro is :dbpit1web.C
Macro is :dbpit1web.C
U data/dbpit1web.C
You have [0] altered files in this repository.
Are you sure you want to release (and delete) directory ‘data’: y
Argument is 500
Argument is input "http://ufgrid02.phys.ufl.edu/~bourilkov/higgs.root"
Argument is output "higgs-ww-plotpxpypz-500"
Command is :.x dbpit1web.C(500,"http://ufgrid02.phys.ufl.edu/~bourilkov/higgs.root",
"higgs-ww-plotpxpypz-500")
TFile**ΨΨhiggs-ww-plotpxpypz-500.rootΨ
 TFile*ΨΨhiggs-ww-plotpxpypz-500.rootΨ
  KEY: TCanvasΨcanv2;1ΨROOT PYTHIA Plotter  D.Bourilkov  University of Florida
.x dbpit1web.C(500,"http://ufgrid02.phys.ufl.edu/~bourilkov/higgs.root",
"higgs-ww-plotpxpypz-500")

**************************End****************************
You have [0] altered files in this repository.
Are you sure you want to release (and delete) directory ‘v01’: y
CAVES: .q
.q
The running of this example produces the following plot from five hundred simulated input events, as illustrated in Figure 3.
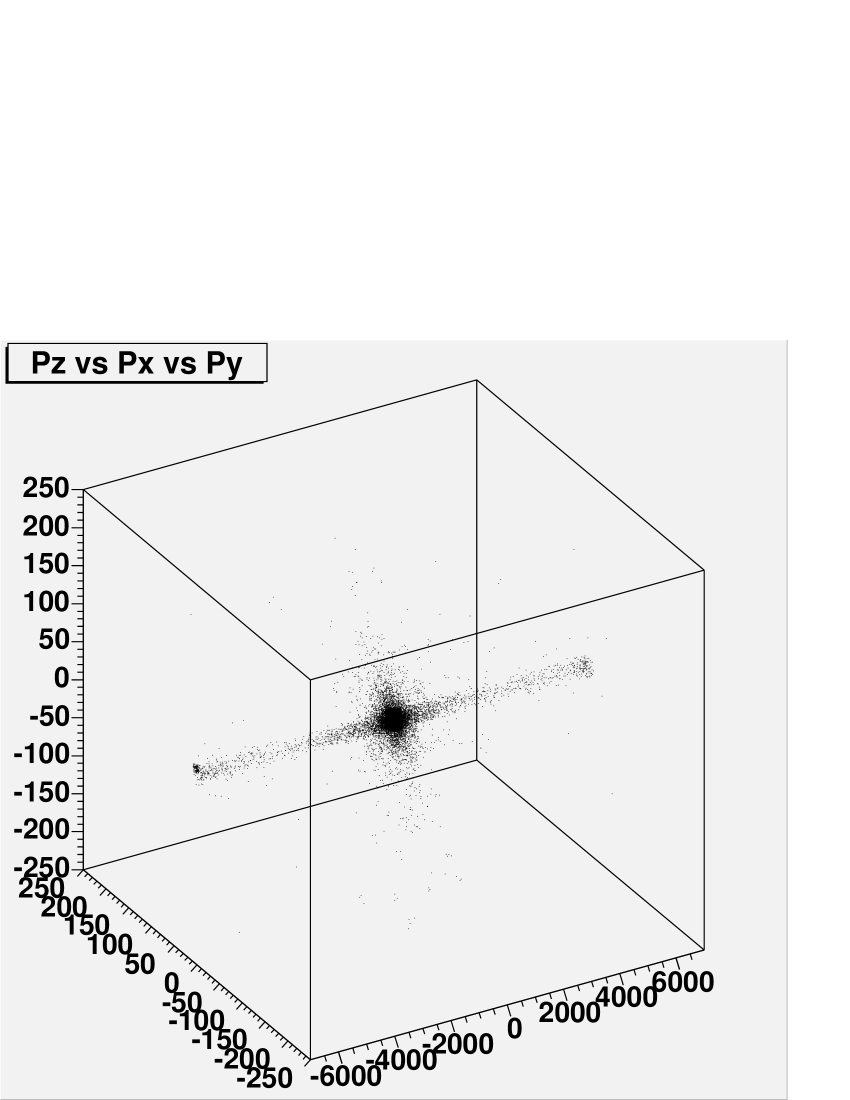
It is worth mentioning that the plot materializes on the client machine out of “thin air”. The user can first download the CAVES code from our remote repository and needs just ROOT and CVS to build the client in no time. Then the remote logs are browsed, one is selected for extraction, the corresponding commands and programs are downloaded, built on the fly and executed on the client machine, the input data are accessed from our remote Web data server, “et voilà”, the plot pops up on the client’s machine.
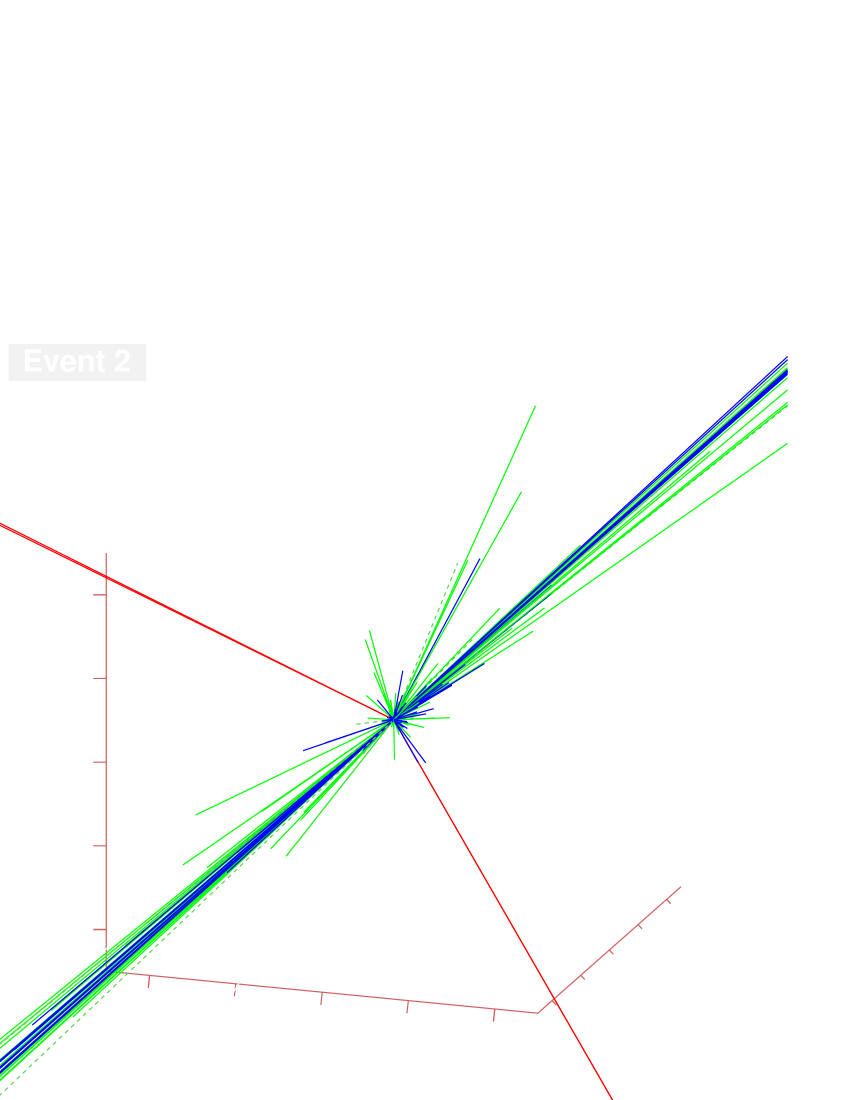
An example of our event display built also on top of ROOT is shown in Figure 4.
IX RELATIONSHIP WITH OTHER GRID PROJECTS
We envisage extending the service oriented architecture by encompassing Grid and Web services as they mature and provide the performance needed to meet mission-critical requirements. Our system will benefit from developments like the Globus authentication system, enhancing the security and providing a temporarily limited single sign-on to Grid services, the GriPhyN Virtual Data Toolkit for job executions on Grids, possibly augmented by Grid schedulers like SPHINX or PEGASUS. Other promising developments are remote data services e.g. CLARENS, which can possibly be used also with our set of CVS services to provide a Globus Security Infrastructure, distributed databases etc. Another closely watched development is the GriPhyN virtual data system Chimera, which evolves a virtual data language. Our “virtual data logbooks” in the first implementation are formatted as standard ASCII files, in future versions we might use also a more structured format e.g. XML, which is well suited for Web services. Chimera also converts the virtual data transformations and derivations to XML and further to directed acyclic graphs. It is a challenging research question if all analysis activities can be expressed easily in the present Chimera language. With the developments of both projects it may be possible to generate automatically virtual data language derivations from our logs of interactive ROOT sessions for execution on a Grid or storage in a Chimera virtual data catalog.
Another promising path is integration with the ROOT/PROOF Ballintijn:2003yt system for parallel analysis of large data sets.
CAVES can be used as a building block for a collaborative analysis environment in a Web and Grid services oriented architecture, important at a time when Web and Grid services are gaining in prominence. We are monitoring closely the evolving architecture and use cases of projects like CAIGEE caigee , HEPCAL hepcal , ARDA arda and collaborative workflows workflow , and are starting useful collaborations. Besides the ROOT-based client a Web browser executing commands on a remote ROOT or CLARENS server is a possible development for “ultralight” clients.
X OUTLOOK
In this white paper we have developed the main ideas driving the CAVES project for exploring virtual data concepts for data analysis. The decomposition of typical analysis tasks shows that the virtual data approach bears great promise for qualitatively enhancing the collaborative work of research groups and the accumulation and sharing of knowledge in todays complex and large scale scientific environments. The confidence in results and their discovery and reuse grows with the ability to automatically log and reproduce them on demand.
We have built a first functional system providing automatic
data provenance in a typical analysis session. The system has been demonstrated
successfully at Supercomputing 2003 and a first public release is available
for interested users, which are encouraged to visit our Web pages, currently
located at the following URL:
http://cern.ch/bourilkov/caves.html
Acknowledgements.
In the process of shaping and launching the project the author enjoyed discussions with Paul Avery, Rene Brun, Federico Carminati, Harwey Newman, Lothar Bauerdick, David Stickland, Stephan Wynhoff, Torre Wenaus, Rob Gardner, Fons Rademakers, Richard Cavanaugh, John Yelton, Darin Acosta, Mike Wilde, Jens Vöckler, Conrad Steenberg, Julian Bunn, Predrag Buncic and Martin Ballantijn. The coffee pauses with Jorge Rodriguez were always stimulating. The first prototype and first release are coded by Mandar Kulkarni and myself, the members of the CAVES team at present. This work is supported in part by the United States National Science Foundation under grants NSF ITR-0086044 (GriPhyN) and NSF PHY-0122557 (iVDGL).References
- (1) “The Grid: Blueprint for a New Computing Infrastructure”, Edited by Ian Foster and Carl Kesselman, July 1998, ISBN 0-97028-467-5.
- (2) I. Foster, C. Kesselman, S. Tuecke, “The Anatomy of the Grid: Enabling Scalable Virtual Organizations”, International J. Supercomputer Applications, 15(3), 2001.
- (3) I. Foster, C. Kesselman, J. Nick, S. Tuecke, “The Physiology of the Grid: An Open Grid Services Architecture for Distributed Systems Integration”, Open Grid Service Infrastructure WG, Global Grid Forum, June 22, 2002.
- (4) World Wide Web Consortium (W3C), http://www.w3.org/2002/ws/ .
- (5) See e.g. Beth Gold-Bernstein, “Making SOA A Reality ? An Appeal To Software Vendors And Developers”, November 2003, http://www.ebizq.net/topics/soa/features/3142.html?related .
- (6) I. Foster et al., “Chimera: A Virtual Data System for Representing, Querying, and Automating Data Derivation”, presented at the 14th International Conference on Scientific and Statistical Database Management (SSDBM 2002), Edinburgh, 2002; GriPhyN Technical Report 2002-7, 2002.
- (7) I. Foster et al., “The Virtual Data Grid: A New Paradigm and Architecture for Data Intensive Collaboration”, Proceedings of CIDR 2003 - Conference on Innovative Data Research; GriPhyN Technical Report 2002-18, 2002.
- (8) P. Avery, I. Foster, “The GriPhyN Project: Towards Petascale Virtual-Data Grids”, GriPhyN Technical Report 2001-14, 2001; http://www.griphyn.org/index.php .
- (9) The Particle Physics Data Grid, http://www.ppdg.net/ .
- (10) The European Union DataGrid Project, http://eu-datagrid.web.cern.ch/eu-datagrid/ .
- (11) P. Avery, I. Foster, R. Gardner, H. Newman, A. Szalay, “An International Virtual-Data Grid Laboratory for Data Intensive Science”, GriPhyN Technical Report 2001-2, 2001; http://www.ivdgl.org/ .
- (12) The LHC Computing Grid Project, http://lcg.web.cern.ch/LCG/ .
-
(13)
The Enabling Grids for E-science in Europe project,
http://egee-intranet.web.cern.ch/egee-intranet/gateway.html . - (14) A. Arbree et al., “Virtual Data in CMS Production”, Computing in High-Energy and Nuclear Physics (CHEP 03), La Jolla, California, 24-28 Mar 2003; Published in eConf C0303241:TUAT011, 2003; e-Print Archive: cs.dc/0306009 .
- (15) A. Arbree, P. Avery, D. Bourilkov et al., “Virtual Data in CMS Analysis”, Computing in High-Energy and Nuclear Physics (CHEP 03), La Jolla, California, 24-28 Mar 2003; FERMILAB-CONF-03-275, GRIPHYN-REPORT-2003-16, CMS-CR-2003-015; Published in eConf C0303241:TUAT010, 2003; [arXiv:physics/0306008].
- (16) K. Beck, “Extreme Programming Explained - Embrace Change”, Addison-Wesley, 2000, ISBN 0201616416.
- (17) R. Brun, F. Carminati et al., “Software development in HEP”, Computing in High-Energy and Nuclear Physics (CHEP 03), La Jolla, California, 24-28 Mar 2003; http://www.slac.stanford.edu/econf/C0303241/proc/pres/10006.PPT .
- (18) The CMS collaboration, “The Compact Muon Solenoid - Technical Proposal”, CERN/LHCC 94-38, CERN, Geneva, 1994.
- (19) V. Innocente, L. Silvestris, D. Stickland, “CMS Software Architecture Software framework, Services and Persistency in High Level Trigger, Reconstruction and Analysis” CMS NOTE-2000/047, CERN, 2000.
- (20) http://cms-project-ccs.web.cern.ch/cms-project-ccs/ .
- (21) C. Steenberg et al., “ The Clarens Web Services Architecture”, Computing in High-Energy and Nuclear Physics (CHEP 03), La Jolla, California, 24-28 Mar 2003; Published in eConf C0303241:MONT008, 2003; e-Print Archive: cs.dc/0306002; http://clarens.sourceforge.net/ .
- (22) The Condor Project, http://www.cs.wisc.edu/condor .
- (23) E. Deelman, J. Blythe, Y. Gil, C. Kesselman, “Pegasus: Planning for Execution in Grids”, GriPhyN Technical Report 2002-20, 2003.
- (24) J. In et al., “Policy Based Scheduling for Simple Quality of Service in Grid Computing”, GriPhyN Technical Report 2003-32, 2003.
- (25) The GriPhyN Virtual Data Toolkit, http://www.lsc-group.phys.uwm.edu/vdt/ .
- (26) Rene Brun and Fons Rademakers, “ROOT - An Object Oriented Data Analysis Framework”, Proceedings AIHENP’96 Workshop, Lausanne, Sep. 1996, Nucl. Inst. & Meth. in Phys. Res. A 389 (1997) 81-86; See also http://root.cern.ch/ .
- (27) Masaharu Goto, “C++ Interpreter - CINT” CQ publishing, ISBN4-789-3085-3 (Japanese).
- (28) The Concurrent Versions System CVS, http://www.cvshome.org/ .
- (29) The MySQL database, http://www.mysql.com/ .
- (30) D. Bourilkov and M. Kulkarni, “The CAVES Project - Collaborative Analysis Versioning Environment System”, Presented at PPDG Collaboration Meeting, Berkeley Lab, December 15-16, 2003; http://www.ppdg.net/archives/talks/2003/bin00010.bin .
- (31) D. Bourilkov and M. Kulkarni, in preparation, to be presented at the ROOT 2004 Users Workshop.
- (32) Apache Web Server, Apache Software Foundation, http://www.apache.org/ .
- (33) The Globus Alliance, http://www.globus.org/ .
- (34) T. Sjöstrand et al., “High-energy-physics event generation with PYTHIA 6.1” Comp. Phys. Commun. 135 (2001) 238.
-
(35)
PYTHIA and CMKIN viewers and plotters developed by the author,
http://cern.ch/bourilkov/viewers.html . - (36) D. Bourilkov, “Sensitivity to contact interactions and extra dimensions in di-lepton and di-photon channels at future colliders”, arXiv:hep-ph/0305125.
- (37) D. Bourilkov, “Study of parton density function uncertainties with LHAPDF and PYTHIA at LHC”, arXiv:hep-ph/0305126.
- (38) M. Ballintijn, R. Brun, F. Rademakers and G. Roland, “The PROOF distributed parallel analysis framework based on ROOT”, eConf C0303241, TUCT004 (2003), eConf C0303241, TULT003 (2003), [arXiv:physics/0306110].
-
(39)
The CAIGEE project and Grid Enabled Analysis (GAE),
http://pcbunn.cithep.caltech.edu/GAE/CAIGEE/default.htm ,
http://pcbunn.cithep.caltech.edu/GAE/GAE.htm . - (40) HEP Common Grid Applications Layer Use Cases - HEPCAL II document (LCG-SC2-2003-032), http://lcg.web.cern.ch/LCG/SC2/GAG/HEPCAL-II.doc .
-
(41)
RTAG11: An Architectural Roadmap towards Distributed Analysis (ARDA),
http://www.uscms.org/s&c/lcg/ARDA/ . -
(42)
http://www.griphyn.org/documents/document_server/
show_docs.php?series=ivdgl&category=talks&id=691