SLAC-PUB-10289
UMS-HEP-2003-027
November 2003
Absolute Energy Calibration with the
Neutron-Activated
Liquid-Source System
at BABAR’s CsI(Tl)
Calorimeter***Work supported by Department of Energy contract
DE–AC03–76SF00515 and Department of Energy grant DE-FG05-91ER40622.
J. M. Bauer
Department of Physics and Astronomy
University of Mississippi,
University, MS 38677, USA
for the EMC group of the BABAR Collaboration
Stanford Linear Accelerator Center
Stanford University
Stanford, CA 94309, USA
Abstract
The electro-magnetic calorimeter at the BABAR detector, part of the asymmetric B Factory at SLAC, measures photons in the energy range from 20 MeV to 8 GeV with good resolution. The calorimeter is calibrated at the low energy end with 6.13 MeV photons obtained from a liquid source system. During the calibration, a fluorine-rich liquid is activated via a neutron generator and pumped past the front of the calorimeter’s crystals. Decays that occur in front of the crystals emit photons of well-defined energy, which are detected in the crystals with the regular data acquisition system. The liquid source system adds only very little material in front of the calorimeter, needs nearly no maintenance, and allows operation at the switch of a key with minimal safety hazards. The report describes the system, presents calibration results obtained from its operation since 1999, shows the crystals’ loss of light yield due to radiation damage, and shares experiences gained over the years.
Presented at the 2003 IEEE Nuclear Science Symposium and Medical Imaging Conference
Portland, OR, USA
October 19, 2003 – October 25, 2003
Submitted to IEEE Transactions on Nuclear Science
Absolute Energy Calibration with the
Neutron-Activated
Liquid-Source System
at BABAR’s CsI(Tl) Calorimeter
Abstract
The electro-magnetic calorimeter at the BABAR detector, part of the asymmetric B Factory at SLAC, measures photons in the energy range from 20 MeV to 8 GeV with good resolution. The calorimeter is calibrated at the low energy end with 6.13 MeV photons obtained from a liquid source system. During the calibration, a fluorine-rich liquid is activated via a neutron generator and pumped past the front of the calorimeter’s crystals. Decays that occur in front of the crystals emit photons of well-defined energy, which are detected in the crystals with the regular data acquisition system. The liquid source system adds only very little material in front of the calorimeter, needs nearly no maintenance, and allows operation at the switch of a key with minimal safety hazards. The report describes the system, presents calibration results obtained from its operation since 1999, shows the crystals’ loss of light yield due to radiation damage, and shares experiences gained over the years.
Index Terms:
CsI(Tl), calorimeter, calibration, neutron sources, radiation damage.I Introduction
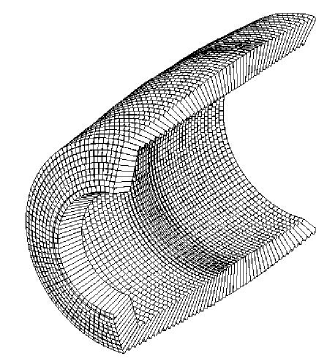
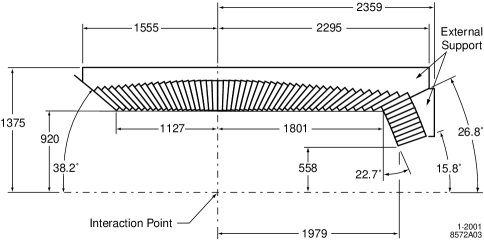
Since 1999, the asymmetric Factory at the Stanford Linear Accelerator Center (SLAC) has been collecting data from collisions of 9 GeV electrons and 3.1 GeV positrons. The mesons that are created at this 10.58 GeV center-of-mass energy are the major topic of the physics studies at the BABAR detector [1] which records the decay products of the mesons. The detection of photons and mesons, which mainly decay into photon pairs, with high efficiency and good energy resolution is of utmost importance to the physics program [2] [3]. This task is handled by the electro-magnetic calorimeter (EMC) of the BABAR detector, designed for the detection of photons in the energy range from 20 MeV to 8 GeV. The detector consists of 5760 CsI(Tl) crystals arranged cylindrically in 48 rows along the polar angle (the so-called “barrel”), and 820 CsI(Tl) crystals arranged in 8 rows at the forward end of the detector (“endcap”), as illustrated in Figs. 2 and 2. Each crystal is of trapezoidal shape with a front face area of approximately 47 mm mm and a length of 297.6 mm to 325.5 mm (16.0 to 17.5 radiation lengths).
II Requirements
In order to reach good energy resolution in the calorimeter, accurate calibration of the crystals over the full energy range is essential. Because radiation from the beams damages the crystals over time, frequent calibrations are necessary to avoid a drop in energy resolution. For lowest energies, this calibration is achieved through the neutron-activated liquid-source system that is the subject of this report. A calibration accuracy of 0.5% was required for the liquid source calibration system. For comparison, we list here the measured energy resolution of the calorimeter (first error statistical, second error systematic) [4]:
| (1) |
III Apparatus and Calibration Procedure
III-A The Neutron Generator
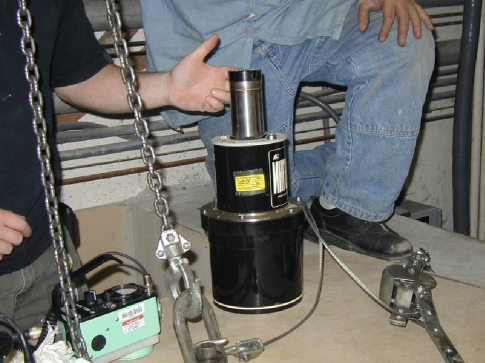
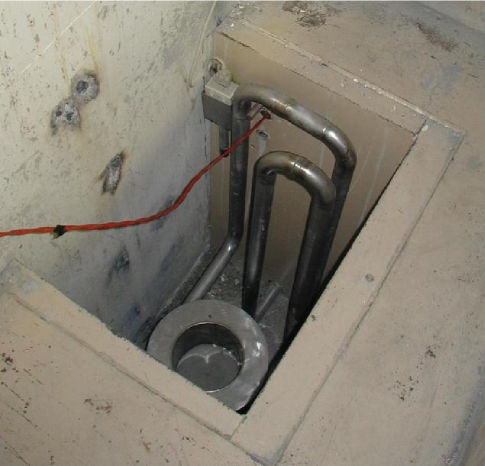
The calibration relies on the reaction and the subsequent decay of () via 16O∗ into and a 6.13 MeV photon. The neutrons originate from a deuterium-tritium neutron generator ([5], Fig. 3) located in a concrete bunker with approximately 0.8 m thick walls adjacent to the BABAR detector. It provides 14 MeV neutrons with a continuous flux of up to n/s when its high voltage is turned on remotely. A bath (Fig. 4) surrounding the generator holds Fluorinert™ FC-77 [6], an inert fluid rich in fluorine that the neutrons activate to .
III-B The Tube System
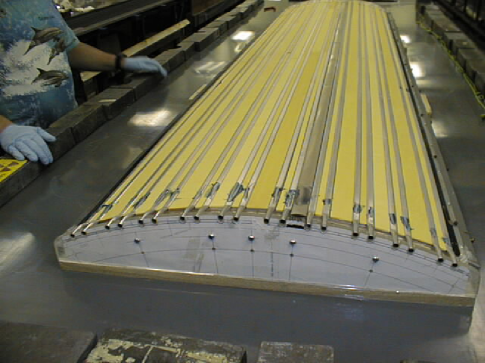
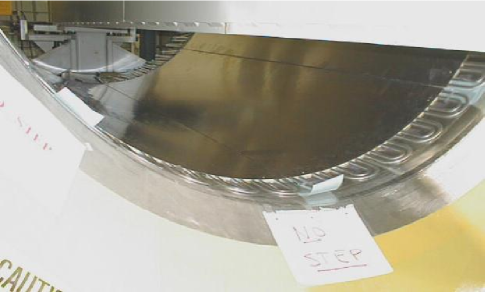
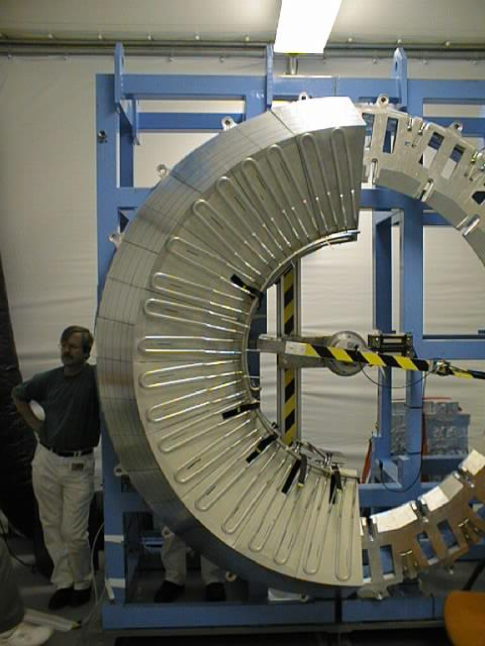
A pump with a supply pressure of around kPa transports the activated liquid at a rate of 150 L/min, from the neutron generator and bath, through pipes into the BABAR detector, forces it through thin-walled aluminum tubes in front of the crystals, and leads it back to the bath in a continuous loop. Since only a 15 mm gap was available between the inside of the calorimeter and the next subsystem, the panels sliding into this gap were allowed to have a thickness of maximal 5 mm. Fig. 5 shows one such panel in production. Round aluminum tubes of 10 mm diameter with 0.5 mm wall thickness were flattened to a 3 mm height, embedded in polyurethane and covered with 0.4 mm thick aluminum sheets on both sides. Fig. 6 shows barrel panels at their installation location at the inside of the calorimeter. The design was different for the endcap, as can be seen in Fig. 7.
III-C The Data Acquisition
Photons emitted in the decay of enter the crystals of the calorimeter at a typical rate of 40 Hz per crystal. According to Monte Carlo simulations, about 30% of them deposit at least 3 MeV in an individual crystal. The energies are measured through the regular data acquisition system, starting with the detection of the scintillation light by a pair of photo diodes. The signal from the photo diodes passes through an analog amplifier mounted at the back of the crystal, then to a 3.7 MHz digitizer at the side of the detector. Via optical fiber the signal arrives in Versa Module Europa (VME) crates at readout modules (ROMs) with embedded processors running VxWorks. Since the data acquisition system is designed for the triggered collection of colliding beam events, not for random photons from the source calibration system, a pulse generator provides triggers of about 20 kHz to begin the data acquisition sequence.
The ROMs select 128 samples of the wave form that arrives from each crystal. Since the decay time of CsI(Tl) is quite long (several hundred nanoseconds) and since the samples are taken every 270 ns, the signal spreads over several samples of the wave form. If at least one of these samples is above a pre-defined threshold of the crystal, the wave form is sent to a digital filter. The filter is based on weights optimized for the background conditions of the source calibration and is able to reduce the electronics noise. Then the peak height is determined with a parabolic fit to the peak of the filtered wave form. If the peak is still above the threshold of the crystal, its value in ADC counts is accumulated into an energy spectrum as shown in Fig. 8. At the end of the source calibration run, each ROM writes the spectra to a file.
Since data are taken at a trigger rate of about 20 kHz and since each wave form has an effective time window of 26s, a live-time of about 50% is reached. Noisy channels can decrease the performance of the data acquisition, and they are therefore masked out as well as possible by raising their thresholds for the data acquisition.

III-D Fitting the Energy Spectra
The energy spectra are fitted off-line to three Gaussians centered around the 6.13 MeV peak and two escape peaks and to a parameterization of the Compton background and electronics noise. Other lines from the decay of 16N are negligible at the present energy resolution. Since the energy of the peaks is well-known, the fit returns the overall gain (number of ADC counts per MeV) as well as the resolution, defined here as the widths of each of the three Gaussian peaks. Since digital filtering reduces the electronics noise to about 230 keV, an average energy resolution of about 300 keV is reached (Fig. 9). This resolution is better than expected from (1) because no beams are present during the source calibration, the digital filter weights are optimized for this no-beam situation, and because the photons originate right in front of the crystals and reach the crystals after passing through only a small amount of material. The systematic error of the measurement is estimated to be not more than 0.1%.

III-E Applying the Constants in Data Analysis
After each calibration run, the calibration constants of each crystal are recorded into a database. When data collected during normal collisions are processed, the energy measured in each crystal is adjusted via an interpolation between the low-energy source calibration constants and high-energy calibration constants from Bhabha events [1].
IV Operational and Safety Issues
The liquid source system is able to measure the light yield to high precision in runs that last 15 to 30 minutes. The runs are performed every ten days, on average, at times when no or beams are present in the collider rings. The aluminum panels with flattened tubes and liquid add only about 2% in radiation length to the material in front of the calorimeter and therefore affect the physics data in only a minimal way. The system requires nearly no maintenance, and safety hazards are minimal. The neutron generator is located safely inside a locked radiation-shielding bunker and only generates neutrons when its high voltage is turned on. The hazard of Fluorinert™ is negligible, even to the crystals, and the short life-time of the activated fluid minimizes any radiation exposure in case of an accidental spill.
V Results
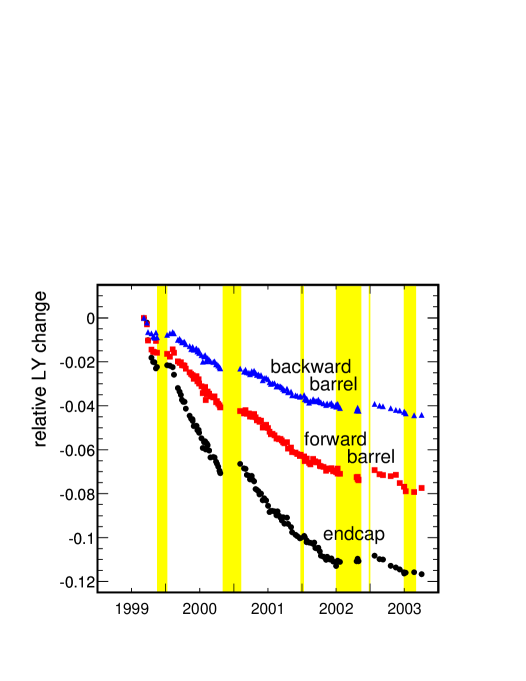
Calibration runs started in 1999 when the asymmetric Factory began its operation. Fig. 10 illustrates how the average light yield of the crystals dropped over time for the endcap, the forward barrel, and the backward barrel. The largest drop is seen in the forward endcap (), while the smallest drop is found in the backward barrel (). The shaded areas in Fig. 10 mark major durations without beams.
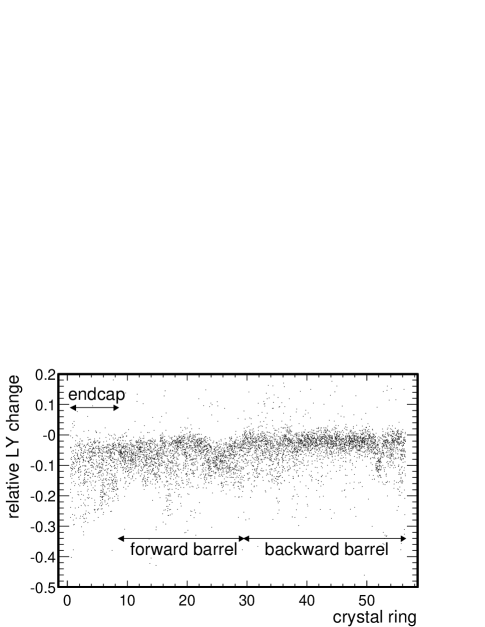
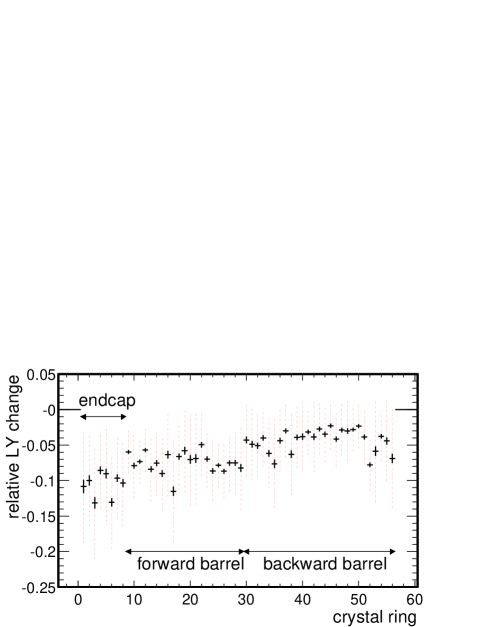
Each point in Fig. 10 is an average over crystals from different manufacturers, located in different places within the calorimeter, and receiving different radiation doses. To illustrate the spread of these measurements, Fig. 11 presents the light yield change from September 1999 to October 2003 versus the 56 crystal ring. The crystal ring number corresponds to the order in polar angle as shown in, e.g., Fig. 2. The endcap ranges from ring 1 to ring 8, which is adjacent to the forward barrel (rings 9 to 29), followed by the backward barrel (rings 30 to 56). In the average, a larger change is seen toward the forward end (low crystal ring numbers), and smaller changes at the backward end, but within each crystal ring the crystals show quite some spread. The same data are plotted in Fig. 12 with the mean and its error (solid line) and the spread (dotted line). One clearly sees several rings with larger light yield changes than their neighbors, like crystal rings 23 to 27 and ring 52. Since those crystals were obtained from a different manufacturer than the surrounding crystals, the dependency of the light yield change on the crystal manufacturer is studied more below.
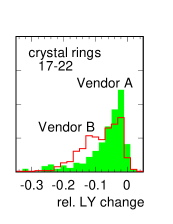
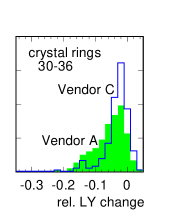
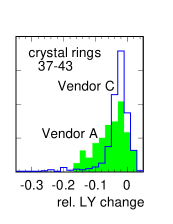
Each plot in Fig. 13 shows the distribution of the light yield change for a certain range of crystal rings for two manufacturers. Clearly the light yield change is less for the solid histogram in the left plot (Vendor A) than for the open histogram (Vendor B). In the next two plots, the crystals from Vendor C (open histograms) show even less change than the crystals from Vendor A. By restricting each plot in Fig. 13 to few crystal rings, the crystal that are compared are ensured to have received similar radiation doses.
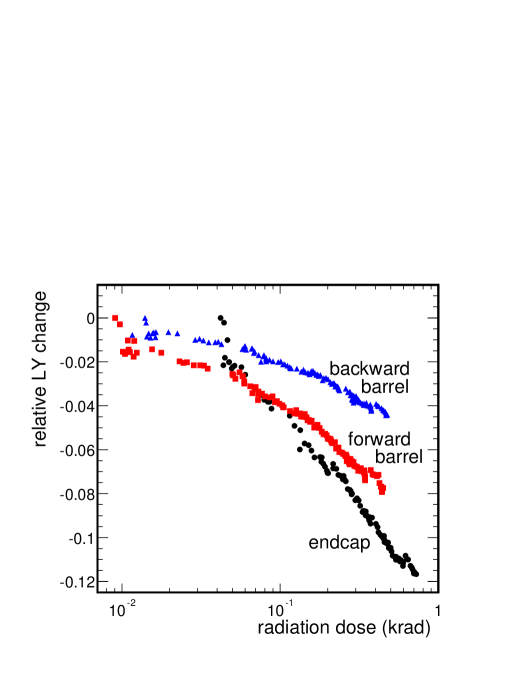
The radiation received by the calorimeter is also monitored by 116 special Field Effect Transistors (RadFET) mounted at the front of the crystals [7]. Although their measurements might not be completely representative for the dose received by the crystals because they are based on different physical principles, important conclusions may still be drawn. The measurements indicate that the radiation dose inside the barrel is not varying widely, so that the difference in the light yield changes seen from the source calibration runs might be mainly due to crystals originating from different vendors. The radiation dose to the endcap, however, is larger than to the barrel. The endcap is thought to receive additional radiation at the rear of the crystals from beam background originating from the beam line, and not only radiation from the front. Similar conclusions on the radiation dose are also reached from studies of the change in the leakage current of the crystals’ photo diodes [8]. In Fig. 14, the light yield changes are plotted versus the radiation dose as measured by the RadFET at the time of the source calibration runs. Since RadFET measurements are available from May 1999 onward, when beams started to pass through the BABAR detector, the data points in Fig. 14 are offset horizontally, especially for the endcap. Many factors may affect the quantities shown in this plot, for example, the beam conditions that were changing over time, and care must be taken when interpreting the plot.
At the time of construction, the specifications for the crystals required that their light yield response was uniform along the length of the crystal. But since during operation many more low-energy photons hit the crystals in the front than in the rear (especially in the barrel), it is possible that the front of the crystals is being damaged more than the rear of the crystals. So far the drop in light yield appears to be similar when comparing the results from the low-energy liquid source calibration and the high-energy Bhabha calibration [8]. Changes in light yield uniformity are further studied in [9].
VI Conclusion
Operating with minimal maintenance requirements and minimal safety hazards, the liquid source calibration system at BABAR is frequently measuring the light yield of the crystals at low energy to the 0.5% accuracy that it was designed for. By monitoring the light yield changes, the system corrects for the effects of radiation damage caused to the crystals over time and allows the resolution of the calorimeter to remain optimal. The liquid source system therefore serves the need of the electro-magnetic calorimeter very well.
Acknowledgment
The author would like to thank the BABAR EMC group for all their contributions to the calorimeter and the liquid source system, making possible and very worthwhile the calibrations described in this report. He would also like to congratulate and extend his gratitude to the whole BABAR Collaboration and the PEP-II accelerator group for their tremendous accomplishments.
References
- [1] BABAR Collaboration, B. Aubert, A. Bazan, A. Boucham, D. Boutigny, I. De Bonis, J. Favier et al., “The BABAR detector,” Nucl. Instr. and Methods A 479, 1 (2002).
- [2] BABAR Collaboration, B. Aubert, R. Barate, D. Boutigny, J.-M. Gaillard, A. Hicheur, Y. Karyotakis et al., “Observation of the decay ,” hep-ex/0308012, submitted to Phys. Rev. Lett.
- [3] BABAR Collaboration, B. Aubert, R. Barate, D. Boutigny, J.-M. Gaillard, A. Hicheur, Y. Karyotakis et al., “Observation of a narrow meson decaying to at a mass of 2.32,” Phys. Rev. Lett 90, 242001 (2003).
- [4] M. Kocian, “Performance and calibration of the crystal calorimeter of the BABAR detector,” in Proceedings of the Tenth International Conference on Calorimetry in Particle Physics (CALOR 2002), Pasadena, CA, USA, 2002, pp. 167-174.
- [5] Model ING-07, All-Russian Research Institute of Automatics (VNIIA), Moscow, Russia.
- [6] 3M Corporation, St. Paul, MN, USA.
- [7] B. Camanzi, H. B. Crawley, A. Holmes-Siedle, R. L. McKay, A. McKemey, W. T. Meyer et al., “The BABAR RadFET monitoring board,” IEEE Trans. Nucl. Sci. vol. 44, no. 3, pp. 1275-1280, June 2002.
- [8] T. Hryn’ova, “A systematic study of radiation damage to large crystals of CsI(Tl) in the BABAR detector,” in Proceedings of the Tenth International Conference on Calorimetry in Particle Physics (CALOR 2002), Pasadena, CA, USA, 2002, pp. 175-181.
- [9] T. Hryn’ova, “A systematic study of radiation damage to large crystals of CsI(Tl) for the BABAR detector”, IEEE Nuclear Science Symposium and Medical Imaging Conference, Portland, OR, USA, October 2003.