Phasor analysis of atom diffraction from a rotated material grating
Abstract
The strength of an atom-surface interaction is determined by studying atom diffraction from a rotated material grating. A phasor diagram is developed to interpret why diffraction orders are never completely suppressed when a complex transmission function due to the van der Waals interaction is present. We also show that atom-surface interactions can produce asymmetric diffraction patterns. Our conceptual discussion is supported by experimental observations with a sodium atom beam.
pacs:
03.75.-b, 03.75.BeAtom diffraction from a material grating has recently been used to measure the strength of van der Waals interactions between atoms and the grating. This was possible in Grisenti et al. (1999, 2000); Bruhl et al. (2002) because atom-surface interactions modify the intensity in each diffraction order as a function of atomic . In this paper we measure van der Waals interactions by studying diffraction as a function of incidence . We also demonstrate an asymmetric atom diffraction pattern from a fabricated material grating.
Historically, a graphical analysis in the complex plane has been useful to understand optical diffraction. This is especially true for the Fresnel integrals for which no closed form analytical solutions have been found, yet the Cornu spiral permits a physical interpretation Hecht (1990). We have adapted this approach to our current problem in atom optics. Even the far-field limit, van der Waals interactions modify atom diffraction such that no closed form analytical solution has been found. Hence we developed a phasor diagram similar to the Cornu spiral to interpret our atom diffraction data.
In particular, we prove that no combination of grating geometry and van der Waals interaction strength can cause diffraction orders to disappear. This is proved using a phasor diagram, and confirmed experimentally by rotating a diffraction grating about an axis parallel to the grating bars while measuring the flux in each diffraction order.
In the standard optical theory of diffraction from a Ronchi-ruling, i.e. a square-wave absorbing grating, a missing order is obtained when
| (1) |
where is the diffraction order, is an integer greater than zero, and is the open fraction defined as window size divided by grating period. For example, a open fraction suppresses all the even orders.
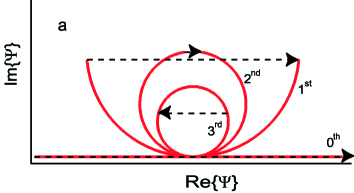
The origin of missing orders in the optical theory can be explained with a phasor plot often referred to as a vibration curve Halliday et al. (2002) and shown in Figure 1a. In this approach a complex amplitude-phase diagram is used to visualize the amplitude and phase of the field in each diffraction order. Specifically, we consider the field associated with the diffraction order in the Fraunhauffer approximation due to a periodic array of apertures illuminated by a plane wave . The slit width and grating period determine the diffraction envelope so the amplitude and phase of each order is given by:
| (2) |
where is the incident wave amplitude, is the spatial coordinate inside an aperture, and with being the grating wavenumber.
This integral can be visualized by adding phasors of length and phase in the complex plane. Curves generated this way are the real vs imaginary parts of the cumulative integral of given by Equation 2. The magnitude and phase of a resultant vector (from start to end of such a curve) correspond to the complex amplitude as shown in Figure 1. A resultant of zero magnitude represents a missing order.
Before including phase shifts due to atom-surface interactions, this integral can be computed analytically:
| (3) |
For comparison with experiment, intensity is given by .
In the WKB approximation, to leading order in , van der Waals interactions cause a phase shift given by
| (4) |
where is the van der Waals potential for atoms interacting with a surface, is the distance the atom propagates in the potential, is the atomic velocity, and is Planck’s constant divided by . Near a surface the potential is known to be
| (5) |
where is the atom-surface distance Milonni (1994). For simplicity, as in Grisenti et al. (1999, 2000); Bruhl et al. (2002) is approximated by equation 5 inside a grating window with finite thickness , and approximated by zero outside the grating window.
Van der Waals interactions with the bars on either side of the slot thus modify the phase of each point on the phasor diagram. This phase is described by:
| (6) |
where is due to the diffraction angle, is due to van der Waals interactions with surfaces located at , and is a constant added for reasons that will be discussed:
| (7) | |||||
| (8) | |||||
| (9) |
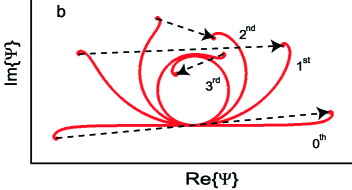
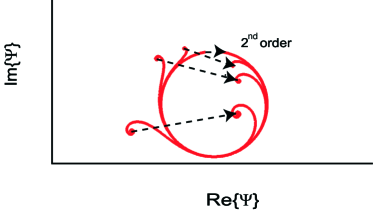
Examples of phasor diagrams modified by atom-surface interactions are shown in Figure 1b, and for a range of van der Waals interaction strengths are shown again in Figure 2.
The constant is not physical but is chosen to be as a convenience to compare the shape of the phasor curves for arbitrary van der Waals constant . This phase offset does not change the norm of the resultant amplitudes, hence it will not affect the proof regarding missing orders. It simply rotates the spiral such that independent of .
For the phasor curves are simple circles because the curvature is constant. The phase spans an angle , and the arc length of the curve is given by the window size . Thus the radius of the circle is and it is centered at the location . When the curve is an integral number of full circles, the endpoints overlap and the resultant field has zero magnitude. This corresponds to a missing order.
The additional phase due to van der Waals interactions makes the phasor curve deviate from a circle. One end of the spiral will always be the circle defined by and the other end must be . This is true because the curvature increases monotonically as goes from 0 to /2 and decreases monotonically as goes from 0 to -/2 (and the curvature equals at ). Hence, the two ends of the spiral will never coincide and the resultant field will never have zero magnitude.
We have now proved regardless of the physical open fraction, there are never missing orders in atom diffraction from a material structure unless . In addition, the diffraction envelope is no longer described by a function as would be the case if the diffraction were described by a real-valued effective open fraction.
Our phasor diagram analysis also provides a method to bound the error on numerically computed amplitudes. If the limits of integration in Equation 2 are replaced by , the maximum error in resultant amplitude is given by the radius of a circle with the curvature of the phasor diagram at , i.e. error in is less than where .

To confirm this theoretical description, we present atom diffraction data using a sodium atom beam and a silicon nitride grating with a period of 100 nm. We call rotation about a grating bar as shown in Figure 3. Normal incidence defines zero twist. Diffraction patterns shown in Figure 4 were obtained with the grating held at a twist of 0, 12, and then 22 degrees, by scanning the position of the hot wire detector. Twist foreshortens the grating period and therefore slightly increases the diffraction angle. However, the and diffraction orders are nearly equally deflected because the atomic de Broglie wavelength is small compared to the grating spatial period.
The feature explored in this study is the relative intensity in each order, which changes considerably as the grating is twisted. Atom flux diffracted into the zeroth order decreases when the grating is twisted, but flux into the second and third orders first increases. Figure 4 shows that the second order intensity is largest for an intermediate twist. Variation in the relative intensity among diffraction orders is expected because the projection of the grating viewed from the incident atom beam changes with twist. However, a model based on absorptive atom optics is not sufficient to explain our data. Phase shifts due to van der Waals interactions must be included, as discussed earlier.

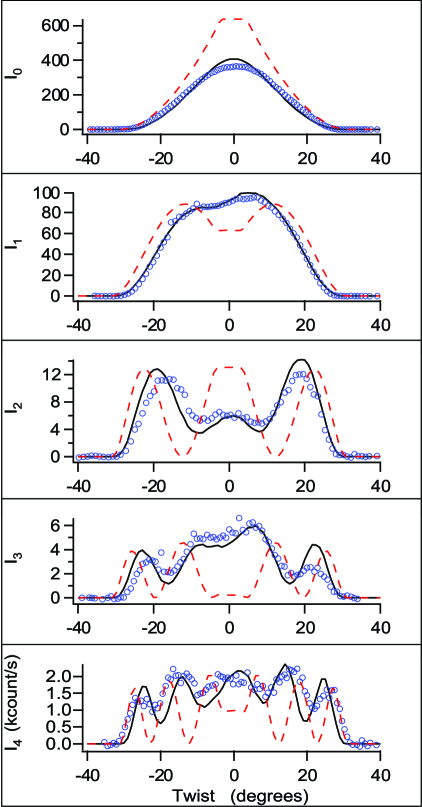
We also present data obtained while scanning the grating twist and leaving the detector at one position (Figure 5). In the latter experiment we have measured for each n=[0,4] while continuously changing the projected open fraction. This technique is well suited to the task of searching for missing orders, because the projected open fraction can be scanned through , , , i.e. values that would make missing orders according to the optical theory.
For a perfectly thin grating, twist would not affect the open fraction. For our gratings, with a geometry shown in Figure 6, twist does in fact modify the projected open fraction. Furthermore, due to trapezoidal grating bars, van der Waals phase shifts must be carefully analyzed. With reference to Figure 6, twisting the grating by angle causes slots to appear narrower so the resulting open fraction is:
| (10) |
where is the slot width viewed at normal incidence, is the thickness of the grating, is the wedge angle of the bars, is the twist, is the maximum twist at which any flux is transmitted, and is the grating period viewed at normal incidence. The intensity in different diffraction orders then depends on twist as:
| (11) |
This model without an allowance for atom-surface interactions was used to predict intensity in the first five orders as a function of twist shown in Figure 5 (dashed lines), and compares poorly with the data.

Two features of this model are familiar from standard diffraction theory. First, in the limit of small open fraction the intensity of each order becomes equal. This happens at large twist. Second, the orders are completely suppressed at certain angles for which , i.e. missing orders are predicted. However, the atom beam flux is never entirely suppressed until the projected open fraction is zero, i.e. there are no missing orders in the data.
Several of the grating geometry parameters are known from the manufacturing process and SEM images Savas et al. (1996). The period is = 100 nm and the window size is = 67 nm, so at normal incidence the open fraction is approximately 67%. The only physical grating parameters left in the optical model are the thickness, , and wedge angle, . These are constrained by measuring the maximum twist at which any flux is transmitted, and must satisfy the condition . The data show . With this constraint, there is only one free parameter in the optical model, i.e. .
The relative intensity for each order is determined in the optical model by Eq 11, and can be compared to the data that were recorded without changing the detector gain or incident beam flux. However, the velocity distribution of the beam broadens the higher order diffraction peaks. Each diffraction order has a HWHM in the detector plane given approximately by where is the HWHM of the zeroth order, is the distance between the grating and the detector, is the ratio of the HWHM spread in velocity to the average velocity, and is the diffraction angle Grisenti et al. (2000). The velocity ratio is 1/15 and the average velocity is 1000 m/s. To allow for the velocity distribution, the relative intensity of each diffraction order is multiplied by in the model. We have not accounted for the change in with twist, that has the effect of further reducing the recorded intensity of the higher orders at large twist.
To include the van der Waals interactions with the twisted grating, the model must take account for the varying distance to the surface as atoms pass through the slots as shown in Figure 6, i.e. the transverse coordinate in the grating now depends on the longitudinal position . The potential due to each interior wall is approximated by the van der Waals potential for an infinite surface when the atoms are inside the grating slots, and zero elsewhere. Then the phase shift due to one wall of a twisted grating is:
| (12) |
where with the sign depending on whether the classical paths get closer or farther from the grating wall as a function of . Changing the sign of describes the phase shift from the other wall. As before, the field amplitude in order diffraction is given by an integral, but now the limits of integration depend on grating twist as shown in Equation 10 as does given by Equation 12:
| (13) |
Equation 13 can now be used to describe intensity in each order as a function of van der Waals coefficient, atom velocity, and grating twist: . When is zero, the expression for the intensities reduces to Equation 11. In comparison, when is not zero the model predicts no missing orders and agrees qualitatively with the data in Figure 5 (this model is shown with solid lines). We note the van der Waals interaction diverts flux from the zeroth order into the higher orders, and tends to smooth the features given by Equation 11. Even the slight asymmetry in intensity as a function of twist is reproduced. To our knowledge this is the first hint of a fabricated structure acting as a blazed grating for atom waves.
When used to measure the strength of for sodium atoms and a grating made of silicon nitride, we determine a value for eV. Further work on the precise shape of the grating, and the van der Waals potential in all space due to the structure is needed to reduce this uncertainty.
The maximum asymmetry we observe in the first order occurs at a twist of and is . In simulations with a larger wedge angle and larger , the asymmetry can be as large as 1.5. An asymmetric distribution of intensity between the and orders, as this implies, would be useful for atom interferometers that only employ the and diffraction orders.
Even at normal incidence the van der Waals interaction has reduced the intensity of the zeroth order diffraction by a factor of 0.65 compared to the zeroth order flux predicted with . As an extrapolation, if we could obtain similar gratings with a 20 nm period, the flux transmitted into the zeroth order will be reduced to 0.06 of the flux predicted with . Hence, van der Waals interactions pose a significant problem for sub-100-nanometer scale atom optics.
In conclusion, a novel way to measure the atom-surface interaction potential was presented. By twisting a 100 nm period diffraction grating, we show that atom-surface interactions prevent missing orders, and cause asymmetric diffraction patterns. Both observations are explained by a complex transmission function and a phasor analysis similar to the Cornu spiral.
We are indebted to T. Savas and H.I. Smith for fabrication of the 100 nanometer period material gratings Savas et al. (1996). We also thank B. Anderson for a critical reading of this manuscript and both H. Uys and P. Hoerner for technical assistance.
References
- Grisenti et al. (1999) R. E. Grisenti, W. Schollkopf, J. P. Toennies, G. C. Hergerfeldt, and T. Kohler, Phys. Rev. Lett. 83, 1755 (1999).
- Grisenti et al. (2000) R. E. Grisenti, W. Schollkopf, J. P. Toennies, J. R. Manson, T. A. Savas, and H. I. Smith, Phys. Rev. A 61, 033608 (2000).
- Bruhl et al. (2002) R. Bruhl, P. Fouquet, R. E. Grisenti, J. P. Toennies, G. C. Hergerfeldt, T. Kohler, M. Stoll, and D. Walter, Europhys. Lett. 59, 357 (2002).
- Hecht (1990) E. Hecht, Optics (Addison Wesley, 1990).
- Halliday et al. (2002) Halliday, Resnick, and Krane, Physics (Wiley, 2002).
- Milonni (1994) P. W. Milonni, The Quantum Vacuum (Academic Press, 1994).
- Savas et al. (1996) T. A. Savas, M. L. Schattenburg, J. M. Carter, and H. I. Smith, J. Vac. Sci. Tech. B 14, 4167 (1996).