Dynamics of drag and force distributions for projectile impact in a granular medium
Abstract
Our experiments and molecular dynamics simulations on a projectile penetrating a two-dimensional granular medium reveal that the mean deceleration of the projectile is constant and proportional to the impact velocity. Thus, the time taken for a projectile to decelerate to a stop is independent of its impact velocity. The simulations show that the probability distribution function of forces on grains is time-independent during a projectile’s deceleration in the medium. At all times the force distribution function decreases exponentially for large forces.
pacs:
45.70.-n, 45.50.-j , 89.75.Da, 96.35.GtCraters on the earth and moon are similar to craters formed in laboratory experiments at much lower energies by using projectiles and explosives Roddy et al. (1977); Mizutani et al. (1983); Melosh (1989). In laboratory experiments at large impact energies, narrow jets have been observed to rise even higher than the initial height of the projectile Thoroddsen and Shen (2001); Mikkelsen et al. (2002). Recent experiments have determined how the shape, depth, and width of craters formed in granular media depend on the energy of the impact projectile Uehara et al. (2003); Walsh et al. (2003), but there is little known about the dynamics of a projectile during crater formation.
We have studied the time evolution of projectile motion. Our experiments and molecular dynamics simulations on a two-dimensional granular medium yield the time dependence of the drag force on projectiles. Simulations for the same conditions are in accord with the experiment and also yield the time evolution of the forces on all of the particles; hence, we can study the time dependence of the force probability distribution function at different stages of the projectile motion.
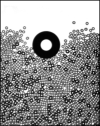
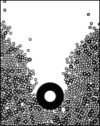
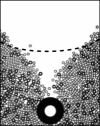
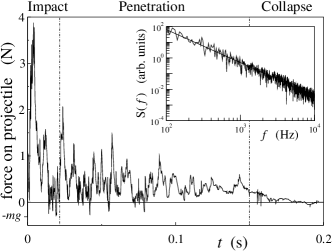
Our observations and simulations reveal three distinct regimes of the motion, as illustrated in Fig. 1: impact, where the projectile first hits the granular medium; penetration, where a transient crater forms and grains in front of the projectile are fluidized; collapse, where the projectile has almost stopped and the deep transient crater collapses, forming a static crater that remains visible on the surface.
| Impact | Penetration | Collapse | |
|
Experiment |
 |
 |
 |
|---|---|---|---|
|
Simulation |
 |
 |
 |
| s | s | s |
Methods — In the experiment, a projectile of diameter cm and mass g was dropped into a bed of small particles (cylinders) contained between two glass plates with a separation times the length of the cylinders. The initial projectile heights ( cm) correspond to impact velocities up to cm/s. To reduce crystallization, two sizes of small particles were used: 12600 particles (84% of the total number) had diameter cm (mass g) and 2400 particles had diameter cm (mass g). To obtain a uniform granular bed with a reproducible area fraction before each drop of the projectile, the bed was fluidized with air flow that was slowly reduced to zero, yielding the same bed height (65) and area fraction (%) for each projectile drop. The bed width was 225. The position of the projectile, , defined as the distance between the bottom of the projectile and the initial height of the bed, was determined with a high speed camera and a center of mass particle tracking algorithm Crocker and Grier (1995).
We modelled the system with a soft-core molecular dynamics (MD) simulation that used disks that had the same sizes and area fraction as the experiment. Any two disks (one of which can be the projectile) exert the following normal and tangential forces on one another:
| (1) | |||
| (2) |
where is the length of overlap Buchholtz and Pöschel (1998); Brilliantov et al. (1996), and and are the normal and tangential components of the surface velocity ( and are unit vectors parallel to and ). The four parameters of the model were found empirically for one impact velocity and the same parameters were used for all other simulations: kg s-2 ft (1); Silbert et al. (2001); Rapaport (2002); Landry et al. (2003) is proportional to Young’s modulus, s-1 and s-1 are viscoelastic constants, and is the static friction coefficient. is the reduced mass ( for two particles A and B). The Heaviside function in models an elastic-plastic interaction (e.g., see Fig. 8 of Labous et al. (1997)); the use of the Heaviside function distinguishes our force model from previous soft-core MD simulations Buchholtz and Pöschel (1998); Landry et al. (2003). Simulations with a more realistic form for Cundall and Strack (1979) yielded results not significantly different from our simple form, which is computationally more efficient. A comparison of the simulation output using time steps shorter than s did not yield different results; a s time step was used in the results presented here.
 |
|
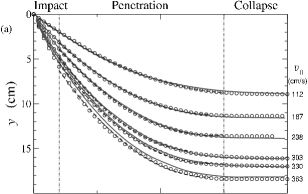
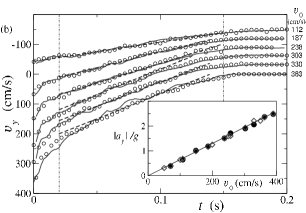
Results — The simulation results agree remarkably well with the laboratory observations, as Fig. 2 illustrates. Both experiment and simulation reveal that the time taken for a projectile to slow to a stop in the granular medium is independent of its velocity at impact. The large deceleration of the projectile at impact (see Fig. 3) is similar to that of a projectile incident on a liquid. However, in contrast to the behavior of a projectile in a fluid Glaheen and McMahon (1996), in the granular medium there is a long penetration region in which the projectile’s average acceleration is constant: is described by a parabola (Fig. 2(a)), so decreases linearly in time (Fig. 2(b)). Further, the acceleration is proportional to the impact velocity, as the inset in Fig. 2(b) illustrates: , where the slope of the line gives s/cm. Thus, the projectile slows almost to a stop in a time s, independent of . The projectile does not immediately come to a complete stop; rather it then moves very slowly downward over the next few seconds as the particles in the bed make small rearrangements in response to the collapse of the transient crater.
The drag force on the projectile, while constant on the average, exhibits large fluctuations, which have a spectrum (Fig. 3).
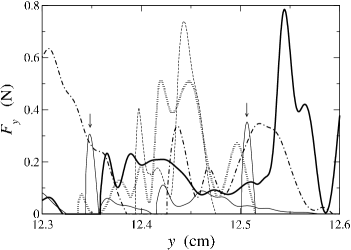
The simulation determines all of the forces on each particle at every instance of time. Every force exerted by a particle on the projectile during a short portion of its travel is shown in Fig. 4. At each point in the projectile’s trajectory only a few particles exert a significant force on the projectile. Each peak in the magnitude of the force between an individual particle and the projectile in Fig. 4 corresponds to a maximum force felt by the first particle in a force chain Albert et al. (2000) that extends downward. Each force chain consists of a string of particles in contact. The sum of the magnitudes of forces felt by each particle in this chain is much greater than the average for the particles in the bed, as can be seen in Fig. 1 (simulation), where dark chains of particles extend downward from the projectile into the particle bed.
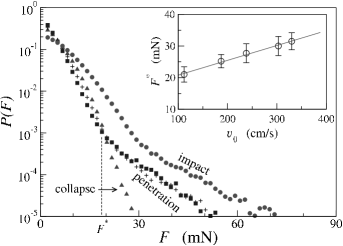
Results for the probability distribution of all normal forces between particles located in front of the projectile in a semicircular region of radius centered at the bottom-most point of the projectile are shown in Fig. 5. The distribution changes with time during impact but is time invariant during penetration: Fig. 5 shows the same distribution at times and , which are respectively early and late in the penetration regime. The presence of an inflection point in marks the beginning of exponential decay for large . The cross-over to an exponential distribution at increases linearly with , as shown in the inset of Fig. 5. After the projectile has almost stopped, the distribution is similar to that found in previous studies of equilibrium Blair et al. (2001) and near equilibrium Howell et al. (1999) force distributions .
Discussion — Our experiments and simulations show that the mean drag force on a projectile dropped into a granular medium is constant during most of the projectile’s trajectory, and this drag force is proportional to the projectile’s impact velocity. In our experiments inertia plays a major role. Interestingly, previous experiments with low constant velocities and negligible inertial effects also yielded a constant drag force in a granular mediumAlbert et al. (1999).
Since the deceleration of the projectile is proportional to the impact velocity (see inset Fig. 2(b)), the projectile penetration depth is also proportional to the impact velocity. While our results are for a two-dimensional system, the linear dependence of the penetration depth on impact velocity has recently also been observed for projectile impact in a three-dimensional granular medium de Bruyn and Walsh (2003).
The drag force on our projectile fluctuates strongly, as found also for cylinders dragged at small constant velocities in experiments ( cm/s) Albert et al. (1999) and simulations ( cm/s)Nouguier et al. (2000); ft (2); Buchholtz and Pöschel (1998). The power spectrum of the force fluctuations has a dependence, as observed in measurements of fluctuations of the stress on a slowly sheared two-dimensional granular medium Miller et al. (1996) and in measurements of the torque on a torsional pendulum in contact with a vibrofluidized granular bed D’Anna and Gremaud (2001). The dependence is explained by assuming random jumps in the drag force Miller et al. (1996). In our experiment these jumps originate from the variation of the forces exerted by the grains in contact with the projectile (Fig. 4).
Finally, our simulations have yielded the normal contact forces for all particles in the bed. The distribution function for the forces on the particles in front of the projectile rapidly evolves immediately after the projectile makes contact with the bed, and then the distribution becomes stationary as the projectile penetrates the bed. This stationary distribution decays exponentially beyond an inflection point at whose value is linearly proportional to the impact velocity. This is the first determination of the force distribution for a granular medium for an accelerating particle. During impact, our force distribution is different from that measured for static beds Blair et al. (2001), where the force distribution decayed exponentially at all times, as predicted by the -model Coppersmith et al. (1995).
Acknowledgements.
We thank John de Bruyn and W. D. McCormick for their helpful comments and suggestions. This work was supported by the Engineering Research Program of the Office of Basic Energy Sciences of the U. S. Department of Energy (Grant No. DE-FG03-93ER14312), the Texas Advanced Research Program, and the Office of Naval Research Quantum Optics Initiative. M.P.C. gratefully acknowledges support of the Italian-Fulbright commission.References
- Roddy et al. (1977) D. J. Roddy, R. O. Pepin, and R. B. Merrill, Impact and Explosion Cratering (Pergamon Press, 1977).
- Mizutani et al. (1983) H. Mizutani, S. Kawakami, Y. Takagi, M. Kato, and M. Kumazav, J. Geophys. Res. p. A835 (1983), proc. 30th lunar and planetary science conference.
- Melosh (1989) H. J. Melosh, Impact Cratering: A Geologic Process (Oxford Univesity Press, 1989).
- Thoroddsen and Shen (2001) S. T. Thoroddsen and A. Q. Shen, Phys. Fluids 13, 4 (2001).
- Mikkelsen et al. (2002) R. Mikkelsen, M. Versluis, E. Koene, G. W. Bruggert, D. vam der Meer, and D. Lohse, Phys. Fluids 14, S14 (2002).
- Uehara et al. (2003) J. S. Uehara, M. A. Ambroso, R. P. Ojha, and D. J. Durian, Phys. Rev. Lett. 90, 194301 (2003).
- Walsh et al. (2003) A. M. Walsh, K. E. Holloway, P. Habdas, and J. R. de Bruyn, Phys. Rev. Lett. 91, 104301 (2003).
- Crocker and Grier (1995) J. C. Crocker and D. G. Grier, J. Coll. Sci. 179, 298 (1995).
- Buchholtz and Pöschel (1998) V. Buchholtz and T. Pöschel, Gran. Matt. 33, 1 (1998).
- Brilliantov et al. (1996) N. V. Brilliantov, F. Spahn, J. M. Hertzsch, and T. Pöschel, Phys. Rev. E 53, 5382 (1996).
- ft (1) As in most other MD simulations of granular media with a soft core potential (e.g. Silbert et al. (2001); Rapaport (2002)), we use a value of that is far smaller than the physical value ( kg s-2 for nylon) because a higher value is computationally too expensive; the integration time must have the form for collisions to be modelled effectively Landry et al. (2003). The success of past Silbert et al. (2001); Rapaport (2002) and present MD simulations with a small value of indicates that the model, despite this flaw, captures much of the dissipative dynamics.
- Silbert et al. (2001) L. E. Silbert, D. Ertas, G. S. Grest, T. C. Halsey, D. Levine, and S. J. Plimpton, Phys. Rev. E 64, 051302 (2001).
- Rapaport (2002) D. C. Rapaport, Phys. Rev. E 65, 061306 (2002).
- Landry et al. (2003) J. W. Landry, G. S. Grest, L. E. Silbert, and S. J. Plimpton, Phys. Rev. E 67, 041303 (2003).
- Labous et al. (1997) L. Labous, A. D. Rosato, and R. N. Dave, Phys. Rev. E 56, 5717 (1997).
- Cundall and Strack (1979) P. A. Cundall and O. D. L. Strack, Geotechnique 29, 47 (1979).
- Glaheen and McMahon (1996) J. W. Glaheen and T. A. McMahon, Phys. Fluids 8, 2078 (1996).
- Albert et al. (2000) I. Albert, P. Tegzes, B. Kahng, R. Albert, J. G. Sample, M. Pfeifer, A. L. Barabási, T. Vicsek, and P. Schiffer, Phys. Rev. Lett. 84, 5122 (2000).
- Blair et al. (2001) D. L. Blair, N. W. Mueggenburg, A. H. Marshall, H. M. Jaeger, and S. R. Nagel, Phys. Rev. E 63, 041304 (2001).
- Howell et al. (1999) D. W. Howell, R. P. Behringer, and C. T. Veje, Chaos 9, 559 (1999).
- Albert et al. (1999) R. Albert, M. A. Pfeifer, A. L. Barabási, and P. Schiffer, Phys. Rev. Lett. 82, 205 (1999).
- de Bruyn and Walsh (2003) J. R. de Bruyn and A. M. Walsh, Private communication.
- Nouguier et al. (2000) C. Nouguier, C. Bohatier, J. J. Moreau, and F. Radjai, Gran. Matt. 2, 171 (2000).
- ft (2) For a projectile penetrating a dilute granular medium at high velocity ( cm/s)Buchholtz and Pöschel (1998), much smaller fluctuations than we observe have been found.
- Miller et al. (1996) B. Miller, C. O’Hern, and R. P. Behringer, Phys. Rev. Lett. 77, 3110 (1996).
- D’Anna and Gremaud (2001) G. D’Anna and G. Gremaud, Nature 413, 407 (2001).
- Coppersmith et al. (1995) S. N. Coppersmith and C. H. Liu, S. Majumdar, O. Narayan, T. A. Witten, Phys. Rev. E 53, 4673 (1995).