On the premelting features in sodium clusters
Abstract
Melting in Nan clusters described with an empirical embedded-atom potential has been reexamined in the size range with a special attention at sizes close to 130. Contrary to previous findings, premelting effects are also present at such medium sizes, and they turn out to be even stronger than the melting process itself for Na133 or Na135. These results indicate that the empirical potential is qualitatively unadequate to model sodium clusters.
Introduction
The early days of cluster thermodynamics were first mostly concerned with theoretical of numerical studies of simple rare-gas aggregates. Beyond the now generally accepted idea that melting in finite atomic clusters appears as a first-order transition rounded by size effects,labwhet it was also observed in simulations that these system can exhibit dynamical coexistence,berry a process in which the cluster fluctuates in time between its solidlike and liquidlike states.
While no experiment has yet permitted to test these predictions on the very same clusters, recent observations achieved in the group lead by Haberlandhab1 ; hab2 ; hab3 have provided valuable qualitative and quantitative information about the way sodium clusters melt, by extracting the full caloric curves from photodissociation measurements. In particular these authors reported that the melting point and the latent heat of fusion both vary strongly and nonmontonically with size.hab2 These results significantly attracted the attention of theoreticians, who since then tried to interpret or reproduce these unexpected complex variations using a variety of models.cs1 ; cs2 ; cs3 ; aguado ; manninen1 ; manninen2 ; garzon Further evidence was also seeked in indicators, which are alternative to the caloric curves, such as the electric polarizability,kummel the photoabsorption spectrum,moseler or the ionization potential.manninen2
Up to now, none of the above cited theoretical works has been able to reach a fully satisfactory quantitative agreement with experiments. The situation is largely due to the expected strong interplay between geometric and electronic effects, which could be responsible for the variations of the thermodynamic quantities. However, the previous simulations have brought some clues about the relevance of the various models and potentials used to describe simple metal clusters. For instance, it was seen that the distance dependent tight-binding (TB) model developed by Poteau and Spiegelmanpoteau overestimated melting points by more than 20 percents. This was interpreted as the consequence of the parameterization of this model, carried out on small clusters only but not on bulk properties.cs2 On the other hand, both the empirical embedded-atom model (EAM) potentialcs1 ; cs2 ; manninen2 ; garzon and orbital-free density functionalaguado calculations lead to a notable underestimation. Unfortunately, more realistic simulations still lack the extent of phase space sampling required for a precise computation of the melting point above 50 atoms.
Numerical experiments
In our previous works, we concluded that melting in sodium clusters actually occurs differently in the smallest and in medium to large sizes clusters.cs1 ; cs2 While the caloric curve of the smallest clusters (having less than about 80 atoms) exhibit several features due to multiple isomerizations prior melting, the heat capacity of the larger sizes mainly has one main peak indicating melting in a non ambiguous way. This could partly explain why experimental measurements do not find such premelting features above 55 atoms, and also why they have difficulties in getting a clear, single-peak picture below this size. More recently we noticed that premelting effects could also be artefactually due to poorly converged simulations.cs3
Based on our previous results, the disagreement between experimental measurements and the results of both the TB and EAM models seemed mostly quantitative. One could hope in getting a much better agreement by suitably modifying the parameters, after including both molecular and bulk properties, possibly through allowing these parameters to become size-dependent. However, the range of sizes that was investigated by us and by others was quite limited,cs1 ; cs2 ; manninen2 ; garzon with only very few sizes above 80. Moreover, the mediocre agreement for the latent heats of fusion lead us revisit the problem with newly available simulation methods and less ambiguous tools of analysis.
We have performed exchange Monte Carlo canonical simulationsemc of the clusters Nan with , being a multiple of 5 in this range, plus the following sizes , 93, 127, 129–131, 133, 139, 142, and 147. The clusters are again described using the same empirical many-body EAM potential whose parameters are given in Ref. li, , and each simulation consisted of cycles following equilibration cycles for each of the 31 trajectories characterized by their temperature K for plus . The starting structures for all clusters was always chosen to be the result of basin-hopping global optimization carried out with 10 sets of quenches. All were found to be based on the icosahedral motif. The absence of any different structural motif such as octahedral or decahedral for the sizes studied here is very favorable for the simulations to reach equilibrium and not fall into broken ergodicity problems, as one major cause for such difficulties precisely lies in the energy landscape having several funnels.wales38 ; neirotti Each cluster was simulated 5 times independently, with different random seeds, and we used a hard-wall spherical container with radius . The caloric curves were constructed from the distributions of potential energies using a multihistogram technique. In Ref. cs2, , we calculated the latent heat of melting, , as the integral of the heat capacity minus the Dulong-Petit contribution. This lead to appreciable overestimates, mostly due to the neglect of anharmonicities. Here we proceed similarly to the experimental approach of Schmidt and coworkers,hab2 namely by fitting the low- and high-temperature parts of the internal energy as straight lines and defining as the gap between these lines at the melting point . The melting point itself is defined as the temperature at which the last heat capacity peak has its maximum: in cases where there are several peaks each centered around the true melting temperature is taken as . The low- and high-temperature parts are defined as K and K, respectively. Therefore, if premelting events are present between these limits, they will contribute to the latent heat.
Results and discussion
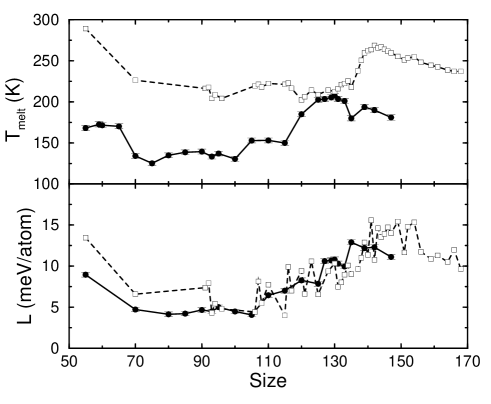
The variations of and with size are sketched in Fig. 1 along with the latest experimental data of Schmidt and coworkers.hab3 Except for very low sizes, we first notice that the melting points computed here are significantly lower than the ones we previously reported.cs2 This is an unfortunate consequence of using the q-jumping method with un inappropriate Tsallis parameter.difres However they are comparable to the ones obtained by Garzón and coworkers in the microcanonical ensemble.garzon Since we expect the differences between this ensemble and the canonical ensemble to become smaller and smaller for increasing sizes, this agreement appear as a mutual confirmation of the convergence of both calculations, even though they rely on very different numerical experiments.
Interestingly, the experimental and theoretical variations of with size appear to be related to each other, especially if we shift the simulation data around size 120 by about 15 atoms and 70 K. This had not been noticed before, and is probably fortuitous. But it may also hide that some mechanisms causing the strong variations in the experimental results close to 140 atoms are indeed the same here, only occuring sooner.
In Fig. 1 one should also notice that the melting point at is not the highest, as clusters having 59 or 60 atoms are more resistant to an increase in temperature. However, we were not able to extract any latent heat for these sizes (nor for and 70) due to very broad heat capacity peaks. Therefore one should maybe not give too much importance to the melting points extracted from these curves.
While the melting temperatures are usually well below the experimental data (except in the vicinity of 130 atoms), the computed latent heats show a reasonable overall agreement, even though the complex variations are not as sharply seen as in the measurements of Schmidt et al.cs3 A definitive comparison would require one to extend the range of sizes. As far as latent heats are concerned, the difference between the present results and our previously published datacs2 comes nearly entirely from the different way of estimating , which is now much closer to the experimental way.
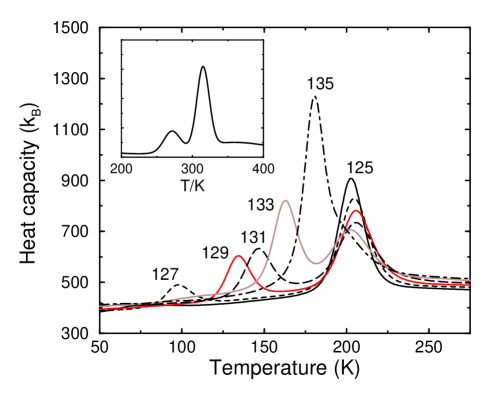
The heat capacity curves in the range are all plotted in Fig. 2 versus temperature. Despite strong changes from one size to another, a regular evolution can be seen from 125 atoms and above this size. The heat capacity consists of two peaks, the melting (or high-temperature) peak being centered near 203 K. The smaller peak, denoted as premelting peak in the following, goes from 100 to about 180 K in a quite continuous fashion. The premelting peak is surprisingly strong, and can be clearly distinguished from the melting peak. Strikingly, it is even stronger than the melting peak itself at size 133.

To interpret these curves, we have chosen to focus on Na133, by carrying periodic quenches from instantaneous configurations extracted from the Monte Carlo simulations for all trajectories. We thus gathered nearly 14000 different isomers. Fig. 3 shows the energy of these isomers versus their rank, as well as the discrete spectrum of isomers versus the temperature of the trajectory from which they were quenched. Both graphs clearly indicate a correlation between the repartition of isomers in energy space, their number and the heat capacities. Small variations in occur below 150 K, but are hardly visible when compared to the main peaks. They are related to the first few hundreds of isomers, which involve the migration of a limited number of some of the missing atoms on the external layer of the icosahedron (the 135-atom cluster has symmetry with all vertex atoms missing).
The presence of two major peaks in is consistent with the two main increases in the number of isomers having less than a given energy. Most new isomers appearing between 150 and 190 K have their rank between 1000 and 5000 in the upper part of Fig. 3. Looking at their structure reveals that they are all still based on the two-layer icosahedron, but that the third layer is hardly recognisable. Hence this case of premelting is an extreme illustration of surface melting following preliminar surface reconstruction.doyesurf Eventually, above 200 K the icosahedral structure is completely lost and the true (volume) melting takes place.
If now we look more closely at the results obtained for Na135, we notice that the main peak is indeed located at the same temperature as the premelting peak in Na133, and that the true melting peak of the latter cluster has been replaced by a right shoulder. Thus the same phenomena seem to be present in Na135, only with different relative magnitude. This case could be referred to as ’post-melting’.
To some extent, this progressive evolution of the premelting and melting peaks can be compared to what has been observed in small Lennard-Jones (LJ) clusters by Frantz.frantz In these systems, a premelting peak starts appearing close to the size 31 corresponding to the competition between Mackay-type and anti-Mackay-type icosahedral structures. The premelting peak remains as the cluster size increases, and it is shifted to higher temperatures before becoming higher than the melting peak itself near the size 38.frantz Because of the structural similarities between LJ clusters and the present sodium clusters, it is likely that the present observations express the same qualitative mechanisms. However, a significant quantitative difference can be seen in the caloric curves of LJ clusters and sodium clusters, as the melting peak is never really well resolved for van der Waals systems until it has replaced the premelting peak. Here the two peaks are of very similar widths, but their respective heights vary strongly, their total contribution to the latent heat being nearly constant.
Up to now, experimental data did not find any evidence for any pronounced premelting peak in the heat capacities of charged sodium clusters.hab1 ; hab2 ; hab3 This indicates that the present empirical potential is qualitatively unadequate to describe these systems. In particular, beyond a simple scaling of the parameters of the potential, we do not expect the use of explicit, size-dependent parameters to improve the situation notably. We repeated the above simulation for Na133 using the more realistic quantum distance-dependent tight-binding (TB) Hamiltonian described in Ref. poteau, , but we had to reduce the statistics to cycles following equilibration cycles (per trajectory) for the computation to be tractable. Even though melting points were shown to be overestimated,cs2 we also noticedcs3 that premelting effects were quite reduced using this model, in better consistency with experiments. The heat capacity computed from exchange Monte Carlo simulations is reported in the inset of Fig. 2. For this calculation we neglected the (weak) effects of nonzero electronic temperature.cs3 The starting configuration was taken as the same one as for the classical potential, but we did not find any more stable structure during the course of the simulation.
At first sight, the caloric curve looks similar to the classical result, with a clear premelting peak. However using the TB Hamiltonian has two consequences. First, the premelting peak is much lower than the melting peak, which is in agreement with our previous general observation that the empirical potential overemphasizes premelting features.cs2 ; cs3 More importantly, premelting also occurs much closer in temperature to the melting peak itself. This also suggest that premelting is not seen experimentally simply because it is too broad.
Conclusion
In the present work, we have obtained some evidence that premelting effects in the caloric curves of sodium clusters could be present at unexpectingly large sizes. We also found that some clusters could exhibit ’post-melting’, a process in which the premelting effect is stronger than the actual melting peak. In the cases studied here, these effects seem to be associated with surface reconstruction of the third icosahedral layer, and thus seem to be of character similar to what occurs in Lennard-Jones clusters having about 35 atoms.frantz
One consequence of the above results is that explicit empirical potentials are not fully reliable for predicting melting points in small sodium clusters, not only because they do not allow one to reproduce the complex variations observed by the group of Haberland,hab2 but mostly because they exhibit prominent premelting peaks not seen in experiments.
Calculations performed using the quantum tight-binding model also predict a premelting phenomenon near 133 atoms, but the corresponding anomaly of the heat capacity is much smaller than the melting peak, as well as closer to it. In this respect, it resembles more the measurements by Schmidt et al.hab2
Even though our calculations overestimate premelting effects, they provide insight into the possible causes for the nonmonotonic variations of the melting point. In particular, they suggest that such variations may reflect premelting becoming actual melting. The discrepancies with the present work would then be ascribed to a possible merging of the premelting feature into one shoulder of the melting peak, but not necessarily on the low temperature side.
Acknowledgments
The authors wish to thank H. Haberland for helpful discussions.
References
- (1) P. Labastie and R. L. Whetten, Phys. Rev. Lett. 65, 1567 (1990).
- (2) R. S. Berry, J. Jellinek, and G. Natanson, Chem. Phys. Lett. 107, 227 (1984).
- (3) M. Schmidt, R. Kusche, W. Kronmüller, B. von Issendorff, and H. Haberland, Phys. Rev. Lett. 79, 99 (1997).
- (4) M. Schmidt, R. Kusche, B. von Issendorff, and H. Haberland, Nature (London) 393, 238 (1998).
- (5) M. Schmidt, J. Donger, T. Hippler, and H. Haberland, Phys. Rev. Lett. 90, 103401 (2003).
- (6) F. Calvo and F. Spiegelman, Phys. Rev. Lett. 82, 2270 (1999).
- (7) F. Calvo and F. Spiegelman, J. Chem. Phys. 112, 2088 (2000).
- (8) F. Calvo and F. Spiegelman, Phys. Rev. Lett. 89, 266401 (2002).
- (9) A. Aguado, J. M. López, J. A. Alonso, and M. J. Stott, J. Chem. Phys. 111, 6026 (1999); J. Phys. Chem. B 105, 2386 (2001).
- (10) A. Rytkönen, H. Häkkinen, and M. Manninen, Eur. Phys. J. D 8, 93 (2000).
- (11) A. Rytkönen and M. Manninen, Eur. Phys. J. D 23, 351 (2003).
- (12) J. A. Reyes-Nava, I. L. Garzón, M. R. Beltrán, and K. Michaelian, Rev. Mex. Fis. 48, 450 (2002); J. A. Reyes-Nava, I. L. Garzón, and K. Michaelian, Phys. Rev. B 67, 165401 (2003).
- (13) S. Kümmel, J. Akola, and M. Manninen, Phys. Rev. Lett. 84, 3827 (2000).
- (14) M. Moseler, H. Häkkinen, and U. Landman, Phys. Rev. Lett. 87, 053401 (2001).
- (15) R. Poteau and F. Spiegelmann, Phys. Rev. B 45, 1878 (1991).
- (16) R. H. Swendsen and J.-S. Wang, Phys. Rev. Lett. 57, 2607 (1986).
- (17) Y. Li, E. Blaisten-Barojas, and D. A. Papaconstantopoulos, Chem. Phys. Lett. 268, 331 (1997).
- (18) J. P. K. Doye and D. J. Wales, Phys. Rev. Lett. 80, 1357 (1998).
- (19) J. P. Neirotti, F. Calvo, D. L. Freeman, and J. D. Doll, J. Chem. Phys. 112, 10340 (2000).
- (20) The q-jumping distributions obtained in the work of Ref. cs2, appeared to be incorrect due to loss of numerical precision caused by the very small value of the Tsallis parameter , which should have been proportional to .
- (21) J. P. K. Doye and D. J. Wales, Z. Phys. D 40, 466 (1997).
- (22) D. D. Frantz, J. Chem. Phys. 115, 6136 (2002).