Predictability of Volcano Eruption: lessons from a basaltic effusive volcano.
Abstract
Volcano eruption forecast remains a challenging and controversial problem despite the fact that data from volcano monitoring significantly increased in quantity and quality during the last decades. This study uses pattern recognition techniques to quantify the predictability of the 15 Piton de la Fournaise (PdlF) eruptions in the 1988-2001 period using increase of the daily seismicity rate as a precursor. Lead time of this prediction is a few days to weeks. Using the daily seismicity rate, we formulate a simple prediction rule, use it for retrospective prediction of the 15 eruptions, and test the prediction quality with error diagrams. The best prediction performance corresponds to averaging the daily seismicity rate over 5 days and issuing a prediction alarm for 5 days. 65% of the eruptions are predicted for an alarm duration less than 20% of the time considered. Even though this result is concomitant of a large number of false alarms, it is obtained with a crude counting of daily events that are available from most volcano observatories.
Grasso and Zaliapin \rightheadVolcano predictability \authoraddrJean-Robert Grasso, LGIT, Observatoire de Grenoble, BP 53X, 38041 Grenoble Cedex, France. (Jean-Robert.Grasso@obs.ujf-grenoble.fr) \authoraddrIlya Zaliapin, Institute of Geophysics and Planetary Physics, University of California, Los Angeles, California, USA and International Institute for Earthquake Prediction Theory and Mathematical Geophysics, Russian Ac. Sci., Moscow, RUSSIA (zal@ess.ucla.edu)
1 Introduction
The effective prediction success of volcanic eruptions is rare if one defines “prediction” as a precise statement of time, place, and ideally the nature and size of an impending activity [Minakami, 1960; Swanson et al., 1985; Voight, 1988; Tilling and Lipman, 1993; Chouet, 1996; Mcnutt, 1996]. A noteworthy obstacle is that most studies do not quantify the effectiveness and reliability of proposed predictions, and often do not surpass the analysis of a unique success on a single case history with the lack of systematic description of forecasting results. In this study we focus on rigorous quantification of the predictive power of the increase in the daily seismicity rate — a well-known and probably the simplest volcano premonitory pattern.
Following Minakami [1960], Kagan and Knopoff [1987], Keilis-Borok [2002], we do not consider here deterministic predictions, and define a prediction to be “a formal rule whereby the available observable manifold of eruption occurrence is significantly contracted and for this contracted manifold a probability of occurrence of an eruption is significantly increased” [Kagan and Knopoff, 1987]. To quantify the effectiveness and reliability of such predictions we use error diagrams [Kagan and Knopoff, 1987; Molchan, 1997].
Previous attempts in probalistic forecast of volcanic eruptions used seismicity data in combination with other observations or alone [Minakami, 1960; Klein, 1984; Mulargia et al., 1991, 1992]. These studies did not quantify the prediction schemes in the error diagram framework. Minakami [1960] was a pioneer in the development of seismic statistics method for volcano monitoring. Based on the data from the andesitic Asama volcano, Honshu, he uses the increase in five-day frequencies of earthquakes to derive an increase in the probability for an eruption in the next 5 days. Klein [1984] tests the precursory significance of geodetic data, daily seismicity rate, and tides before the 29 eruptions during 1959-1979 at the Kilauea volcano, Hawaii. He derives a probabilistic prediction scheme that applies for eruptions anywhere on the volcano and can give 1- or 30-days forecast. The forecasting ability of daily seismicity rate is shown to be better than random at 90% confidence in forecasts on the time scale of 1 or 30 days using small earthquakes that occur in the caldera. A better performance is achieved with a 99% confidence when using located earthquakes only, in forecasts on the time scale of 1 day. Mulargia et al. [1991, 1992] use regional seimicity to define clusters of seismic events within 120 km distance of Etna volcano. Clusters within this regional seismicity are found within 40 days before 9 out of 11 flank eruptions in the 1974-1989 period. On the same period no statistically significant patterns are identified 40 days before and after the 10 summit eruptions.
As a test site we choose the PdlF volcano, the most active volcano worldwide for the last decades with 15 eruptions in the 1988-2001 period. On this site the volcanic risk remains low because most of the eruptions are effusive and occurred in an area that is not inhabited. For the PdlF site, the increase in seismicity rate and an increase in deformation rate have been reported within a few hours prior to an eruption (e.g. [Lenat et al., 1989; Grasso and Bachelery, 1995; Sapin et al., 1996; Aki and Ferrazzini, 2000; Collombet et al., 2003; Lenat et al., 1989; Cayol and Cornet, 1998]. Although the deformation data are very efficient to locate the lava outflow vents from a few hours to minutes before the surface lava flow, there is not yet a long term catalog available to test how they can be used to forecast an eruption days to weeks in advance.
In this study we quantify the predictability of the PdlF eruptions on the longer time scale of a few days to weeks prior to an eruption. Collombet et al. [2003] show that accelerating seismicity rate weeks prior to the PdlF eruptions can be recovered on average using the superposed epoch analysis before numerous eruptions. Here we show that the increase of the daily seismicity rate is useful as well to forecast individual eruptions. This is achieved by rigorous quantification of the prediction performance by introducing error diagrams [Kagan and Knopoff, 1987; Molchan, 1997] to choose among competitive prediction strategies.
2 Data
The PdlF hot spot volcano is a shield volcano with an effusive erupting style due to low viscosity basaltic magma. During 1988-2001 period the seismicity at the PdlF site remained low, with , and was localized within a radius of a few km beneath the central caldera. Less than 10% of these small events are located, most of them being only recorded by the three summit stations located 3 km apart from each other. Contrary to the Mauna Loa - Kilauea volcanic system, there is no seismically active flank sliding or basal faulting on the PdlF. Contrary to the Etna volcano, there is no tectonic interaction with neighboring active structures. Accordingly, the PdlF seismicity is one of the best candidates to be purely driven by volcano dynamics. This seismogenic volume is also thought to be the main path for the magma to flow from a shallow storage system toward the surface [Lenat and Bachelery, 1990; Sapin et al., 1996; Bachelery, 1999; Aki and Ferrazini, 2000].
The PdlF seismicity catalog consists of data from the 16 seismic stations [Sapin et al., 1996; Aki and Ferrazzini, 2000]. During the May 1988- June 2001 period the geometry and instrumental characteristics of the seismic network remained stable, with a magnitude detection threshold of 0.5 [Collombet et al., 2003]. In this period 15 eruptions were seismically monitored. We use here the seismicity rate of the volcano tectonic (VT) events, excluding long period (LP) events or rockfall signals. The number of LP events at the PdlF site is insignificant compared to the number of VT events. For example, the eruption of 1998 was acconpanied by a single LP event 4 hours before the surface lava flow [Aki and Ferrazzini, 2000], and 2500 VT events had been recorded at that time.
3 Synthesis of seismicity pattern before eruptions
Although the peaks of seismicity rate clearly correlate with eruption days (see Figure 1 in [Collombet et al, 2003]), it is difficult to identify a long-term seismicity pattern before each eruption, except possibly during the last few hours before surface lava flow [Lenat et al., 1989; Sapin et al., 1996; Aki and Ferrazzini, 2000; Collombet et al, 2003]. For all the 15 PdlF eruptions the hourly seismicity rate during the seismicity crisis that precedes each surface lava flow is roughly constant with values ranging from 60 to 300 events/hr, with an average value of 120 events/hr. The average crisis duration is 4 hrs, the extreme values ranging from 0.5 hours for the may 1988 eruption to 36 hours for the 1998 eruption. No correlation is found between the seismic rates or the durations of the crisis and the erupted volumes. Because there is no recurrent migration of seismicity during these crises [e.g. Sapin et al., 1996] we suggested, as proposed by Rubin et al. [1998], that damage is neither directly related to the dyke tip, nor does it always map the dyke propagation. It is the response to dike intrusion of parts of the volcano edifice that are close to failure [e.g. Grasso and Bachelery, 1995].

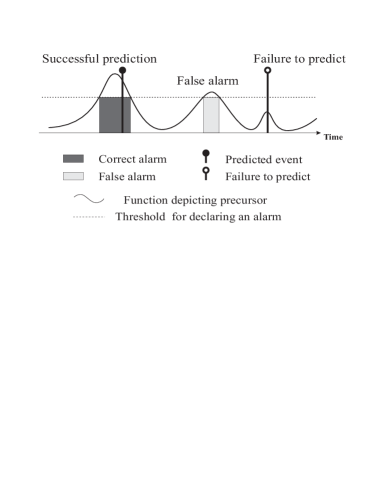
We synthesize the pre-eruption seismicity rate on the PdlF volcano as a 3 step process (Figure 1). First, the seismicity rate increases in average and it follows a power law 10-15 days prior the eruption [Collombet et al, 2003]. This is reminiscent of the average foreshock patterns observed for earthquakes [Jones and Molnar, 1979; Helmstetter and Sornette, 2003]. As for earthquakes, we suggest that this pattern illuminates a local damage process rather than a macroscopic failure, the damage being localized within the magma storage system a few km below the volcano [e.g. Sapin et al., 1996]. This average acceleration is different from the acceleration proposed prior to each single eruption by Voight [1988], or individual large earthquakes [e.g. Bufe and Varnes, 1993]. The second phase is seismically mapped by a discontinuity in seismicity rate from a peak value events/day to a events/day constant rate (Figure 1). We suggest it corresponds to the onset of the magma flow outward of the storage system. The third phase is characterized by a constant strong seismicity rate during each crisis. We suggest it corresponds to the damage induced by fluid flow, either as a diffuse response to dyke propagation in an heterogeneous rock matrix or as damage in the open reservoir walls during fluid flow.
This pre-eruption scheme helps both to clarify the eruption phases on the PdlF and to define our prediction targets. If one uses a conventional definition of the target as the onset time of surface lava flow, then all the eruptions can be predicted a few hours in advance by choosing a daily seismicity rate larger than 60 events/day as an alarm threshold. For this threshold value the seismic crisis that did not end up in an eruption are false alarms. They are post-labelled at the observatory as intrusion, and are part of the endogeneous growth of any volcano. We aim to find precursory patterns before the outward magma flow from the reservoir system. Accordingly, we define our target as the onset of a reservoir leak as mapped by the end of the average acceleration process and before the onset of the eruption crisis (Figure 1). This target possibly maps a local failure in the reservoir walls, contemporary to the onset of outward magma flow from the reservoir, and corresponds to predicting eruptions more than one day in advance. Thus, our problem is different from that posed by Klein [1984].
4 Prediction scheme and error diagram
Here we follow a pattern recognition approach [e.g. Gelfand et al., 1976] to predict rare extreme events in complex systems; this approach is reviewed by Keilis-Borok [2002]. To use pattern recognition techniques as a forecasting tool we define 3 steps in the data analysis. First we consider a sequence of VT earthquake occurrence times Note that we use neither magnitude nor location of events. Second, on the sequence we define a function as the number of earthquakes within the time window , being a numerical parameter. This functional is calculated for the time interval considered with different values of numerical parameter . Third, an alarm is triggered when the functional exceeds a predefined threshold . The threshold is usually chosen as a certain percentile of the distribution function for the functional . The alarm is declared for a time interval . The alarm is terminated after an eruption occurs or the time expires, whichever comes first. Our prediction scheme depends on three parameters: time window , threshold , and duration of alarms. The quality of this kind of prediction is evaluated with help of ”error diagrams” which are a key element in evaluating a prediction algorithm [Kagan and Knopoff, 1987; Molchan, 1997].
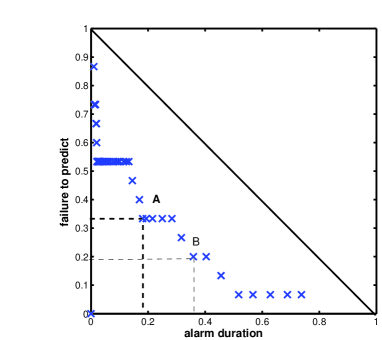
The definition of an error diagram is the following. Consider prediction by the scheme described above. We continously monitor seismicity, declare alarms when the functional exceeds the threshold, and count the prediction outcomes (Figure 2). During a given time interval , targets occurred and of them were not predicted. The number of declared alarms was , with of them being false alarms. The total duration of alarms was . The error diagram shows the trade-off between the relative duration of alarms , the fraction of failures to predict , and the fraction of false alarms . In the -plane the straight line corresponds to a random binomial prediction — at each step in time the alarm is declared with some probability and not declared with probability . Given a particular prediction that depends on our three parameters , different points in the error diagram correspond to different values of these parameters. Error diagrams thus tally the score of a prediction algorithm’s successes and errors. This score depends on the algorithm’s adjustable parameters. For example, raising the threshold will reduce the number of alarms but may increase the number of failures to predict. Raising , on the other hand, will increase the duration alarms but may reduce the number of failures to predict , etc. A prediction algorithm is useful if: (i) the prediction quality is better than that of a random one, i.e. the points on error diagram are close to the origin and distant from the diagonal ; and (ii) this quality is fairly insensitive to changes in the parameters.
5 Results and Discussion
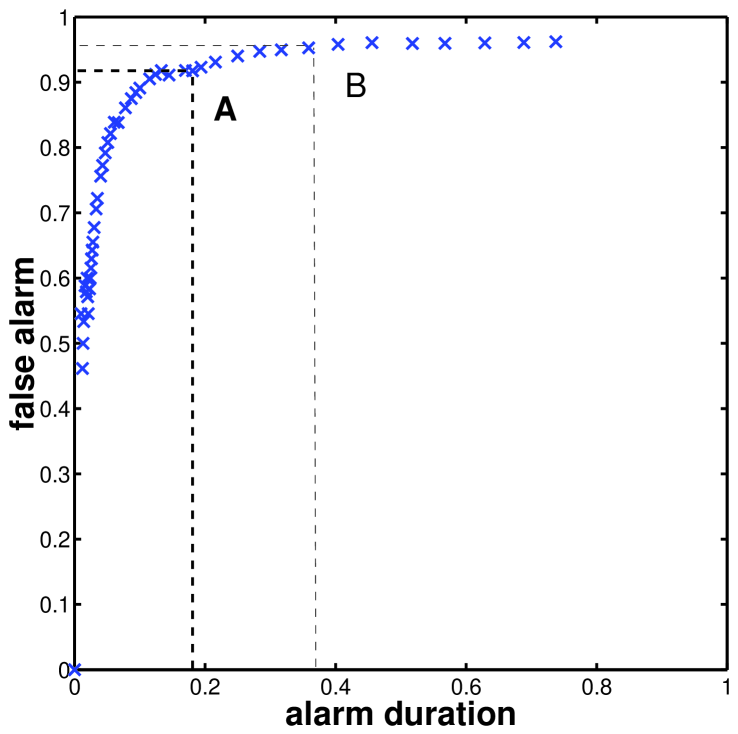
We estimate the time predictability of volcanic eruptions based on the increase of the daily seismicity rate. The parameters of the algorithm are varied as follows: days, events per s days, days. The 30 day limit is the minimum time between two eruptions during 1988-2001. The best predictions are obtained when averaging seismicity rate over a 5 day window and declaring an alarm for 5 days. The predictive skills of our prediction scheme are illustrated by the error diagrams of Figures (3, 4). Each point in the error diagram corresponds to different values of the threshold ranging from 1 to 100 events per 5 days, other parameters are fixed as days, days. Error diagrams outline the whole range of possible prediction outcomes; thus they are more convenient for decision making than performance of “the best” single version of prediction. We observe for instance (Point A) that 65% of the PdlF eruptions can be predicted with 20% of the time covered by alarms. These results are of the same quality as that obtained on the Etna or the Hawaii volcanoes. For instance, using regional seismicity in a 120 km radius from the Etna volcano, 50% of the eruptions could have been predicted within 40 days in the 1974-1990 period, which can be sorted as 80 % of the 11 flank eruptions, and no summit eruptions [Mulargia et al., 1991, 1992]. Decreasing the threshold yields an alternative prediction strategy that favors a lower failure to predict rate and accepts a higher alarm duration rate; it is shown as point B on Figure (3). The choice of a particular prediction strategy must be always based on the analysis of the entire error diagram; different prediction strategies may be used in parallel to complement each other (see more in [Molchan, 1997; Zaliapin et al., 2003]).
It is worth noticing that the performance of our simple prediction algorithm, which is based on mere averaging of the seismicity rate, is close to the performance of much more sophisticated algorithms that use numerous seismic parameters to predict large observed earthquakes [e.g. Kossobokov et al., 1999]. The significant predictability we obtain here is still concomitant of a fraction of false alarm larger than 90% (Figure 4). Because this predictability emerges from the use of a daily seismicity rate only, we expect that a modification of the above prediction strategy to include earthquake location and magnitudes with deformation and geochemistry data will improve this first quantitative analysis of eruption prediction on PdlF.
Acknowledgements.
We gratefully thank OVPF staff in charge of the PdlF seismic network since 1980. We thank A. Helmstetter, W. Z. Zhou, J. El-Khoury, T. Gilbert, D. Shatto, M. Collombet and the ESS/UCLA seismo group for stimulating discussion. We benefited from Professor V. Keilis-Borok’s lectures on time series analysis and pattern recognition during the Spring 2003 Quarter at ESS/UCLA. JRG is partially supported by EC E-ruption project and EC EVG-CT-2001-00040, Volcalert project. IZ is partly supported by INTAS, grant 0748.References
- [1] Aki, K. and V. Ferrazzini, Seismic monitoring and modeling of an active volcano for prediction. J. Geophys. Res., 105, 16,617-16,640, 2000.
- [2] Bachelery, P. Le Fonctionnement des volcans boucliers, memoire HDR, Universite de la Reunion, St Denis, France, 698 pp., 1999.
- [3] Bufe, C. G. and Varnes, D. J., Predictive modeling of the seismic cycle of the Greater San Francisco Bay region. J. Geophys. Res., 98, 9871-9883, 1993.
- [4] Cayol,V., F.Cornet, Three-dimensional modeling of the 1983-1984 eruption at Piton de la Fournaise Volcano, Réunion Island. J. Geophys. Res., 103, doi:10.1029/98JB00201, 1998.
- [5] Chouet, B., Long period volcano seismicity: its source and use in eruption forecasting. Nature, 16,617-16,640, 1996.
- [6] Collombet M. et al., Seismicity rate before Eruptions at Piton de la Fournaise Volcano: implications for volcano dynamics. Geophys. Res. Lett., 30, 2099, doi:10.1029/2003GL017494, 2003.
- [7] Gabrielov, A.M.et al. Colliding cascades model for earthquake prediction. Geophys. J. Int., 143, 427-437, 2000.
- [8] Gelfand I.M.et al. Pattern recognition applied to earthquakes epicenters in California,Phys. Earth Planet. Inter., 11, 227-283, 1976.
- [9] Grasso, J.-R., and P. Bachelery, Self-Organized volcanic earthquakes as a diagnostic approach to volcano mechanics: Validation on Piton de la Fournaise. Geophys. Res. Lett., 22, 2897-2900, 1995.
- [10] Helmstetter, A. and D. Sornette, Foreshocks explained by cascades of triggered seismicity. J. Geophys. Res., 108, 2457, 10.1029/2003JB002409, 2003.
- [11] Jones, L. and P. Molnar, Some characteristics of foreshocks and their possible relationship to earthquake prediction and premonitory slip on fault. J. Geophys. Res., 84, 356-3608, 1979.
- [12] Kagan Y. and L. Knopoff, Statistical Short-Term Earthquake Prediction. Science, 236, 1563-1567, 1987.
- [13] Keilis-Borok, V. I. Earthquake Prediction: State-of-the-Art and Emerging Possibilities. Annu. Rev. Earth Planet. Sci., 30, 1-33, 2002.
- [14] Keilis-Borok, V. I. and Shebalin, P. N. (Editors), 1999. Dynamics of Lithosphere and Earthquake Prediction. Phys. Earth Planet. Int., 111, Special Issue, III, 179-330.
- [15] Klein, F., Eruptive forecasting at Kilauea volcano Hawaii. J. Geophys. Res., 89, 3059-3073, 1984.
- [16] Kossobokov V et al. Testing earthquake prediction algorithms: statistically significant advance prediction of the largest earthquakes in the Circum-Pacific, 1992-1997. Phys. Earth Planet. Int., 111, 187-196, 1999.
- [17] Lenat J.-F., and P. Bachelery, Structure and dynamics of the central zone of Piton de la Fournaise volcano, in Le volcanisme de la Reunion, Lenat eds, CRV, OPG Clermont, France 257-296, 1990.
- [18] McNutt, S., Seismic monitoring and eruption forecasting of volcanoes: A review of the state of the art and case histories, in Monitoring and mitigation of volcano hazards, Scarpa and Tiling (eds), Springer, Berlin, 99-146, 1996.
- [19] Minakami, T., Fundamental research for predicting volcanic eruptions, Part I, Bull earthq Res. Inst. Tokyo Univ., 38, 497-544, 1960.
- [20] Molchan, G. M., Earthquake prediction as a decision-making problem. Pure Appl. Geophys., 149 , 233-247, 1997.
- [21] Mulargia F. et al., Pattern recognition applied to volcanic activity: Identification of precursory patterns to Etna recent flank eruptions and period of rest, J. Volcanol. Geotherm. Res., 45, 187-196, 1991.
- [22] Mulargia F. et al., Statistical identification of physical patterns which accompagny eruptive activity on Mount Etna, Sicily, J. Volcanol. Geotherm. Res., 53, 289-296, 1992.
- [23] Rubin, A.M. et al., A reinterpretation of seismicity associated with the Januray 1983 dike intrusion at Kilauea volcano, Hawaii,J. Reophsy. Res., 103, 10003-100015, 1998
- [24] Tilling R. and J. Dvorack, Anatony of a basaltic volcano. Nature, 363, 125-133, 1993.
- [25] Sapin, M. et al., Stress, failure and fluid flow deduced from earthquakes accompanying eruptions at Piton de la Fournaise Volcano. J. Vol. Geoth. Res., 70, 145-167, 1996.
- [26] Swanson et al., Forecasts and predictions of eruptive activity at Mount St Helens, USA: 1975-1984J. Geodyn, 3, 397-423, 1985.
- [27] Voight, B., A method for prediction of volcanic eruption. Nature, 332, 125-130, 1988.
- [28] Zaliapin, I. et al., A Boolean Delay Equation Model of Colliding Cascades. Part II: Prediction of Critical Transitions. J. Stat. Phys., 111, 839-861, 2003.