Universality in snowflake aggregation
Abstract
Aggregation of ice crystals is a key process governing precipitation. Individual ice crystals exhibit considerable diversity of shape, and a wide range of physical processes could influence their aggregation; despite this we show that a simple computer model captures key features of aggregate shape and size distribution reported recently from Cirrus clouds. The results prompt a new way to plot the experimental size distributions leading to remarkably good dynamical scaling. That scaling independently confirms that there is a single dominant aggregation mechanism at play, albeit our model (based on undeflected trajectories to contact) does not capture its form exactly.
1 Introduction
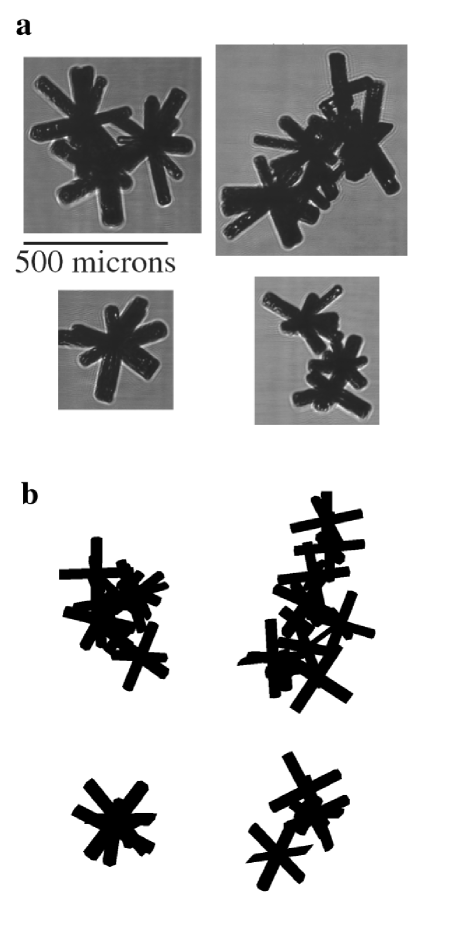
It has recently become possible to collect large samples of high resolution cloud particle images in real time, opening up the modelling of cloud dynamics to detailed comparison with nature. Figure 1 shows ice crystal aggregates from a Cirrus cloud over the USA, captured by non-contact aircraft-based imaging. Such aggregates can be seen to be comprised of varied rosette ice crystal types, and detailed statistics have recently been published on both the cluster aspect ratios [Korolev and Isaac 2003] and size distributions [Field and Heymsfield 2003] in Cirrus clouds. Such aggregation is a key feature of cloud development in the troposphere and can be quite crucial to the development of precipitation, whether it reaches the ground as snow or melts first to arrive as rain.
The openness of the aggregates significantly accelerates their growth. Two clusters (labelled by ) pass approach with their centres closer than the sum of their radii at a rate proportional to
| (1) |
where for each cluster the sedimentation speed varies inversely with its radius and mass as
| (2) |
Here and are the viscosity and density of the air, is the acceleration due to gravity, and we have assumed that only one geometrical radius is relevant: Mitchell [1996] discusses an elaboration. Given the above, the rates of aggregation per unit time for fixed cluster masses vary linearly overall with the cluster radii, and openness of aggregate structure enhances aggregation rates despite lowering fall speed. For real aggregates this is a significant factor: using data from Heymsfield et al., [2002], one finds that rosette aggregates 2mm across (which yield 0.5 mm droplets) aggregate four times faster than when melted. For cloud particles it is also relevant to consider the rates of aggregation per unit of distance fallen (rather than per unit time), which at fixed mass is proportional to the square of radius, leading to 16 times enhancement for ice over water in the example cited.
We have made computer simulations of ice aggregation based on equations (1) and (2), tracing trajectories through possible collisions to obtain accurate collision geometries. We assumed that all collisions led to rigid irreversible joining of clusters, as the openness of the experimentally observed clusters suggests little large scale consolidation of structure upon aggregation, and that cluster orientations were randomised in between collisions but did not change significantly during them. We took the sedimentation speeds to be governed by inertial flow, for which the mass dependence function in equation (2) is given by . Details of implementation are given in a longer paper [Westbrook et al., 2004].
Some representative computer aggregates are shown in figure 1 alongside the experimental ones. Our simulations used three dimensional cross shapes for the initial particles as a crude representation of the experimental bullet rosettes.
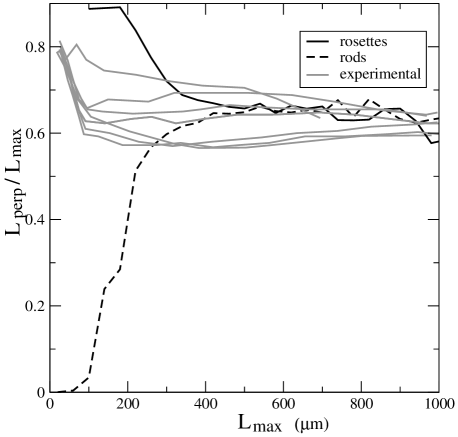
Figure 2 shows a quantitative comparison of aggregate geometry, in terms of the ratio of cluster spans perpendicular to and along the direction of maximal span, as measured from projections in an arbitrary plane of observation. We find that different initial particle geometries (rosettes, rods) approach a common asymptotic average cluster value. The aspect ratio of CPI images have been similarly calculated [Korolev and Isaac 2003], the results of which have been overlayed onto figure 2, and these appear to approach the same value. This universality of aspect ratios provides direct support for our hypothesis of rigid cluster joining upon contact.
A deeper indicator of universality is provided by the fractal scaling of ice crystal aggregates, where one tests the relation between aggregate mass and linear span . Our simulations and experimental observations [Heymsfield et al., 2002], rather accurately agree on the fractal dimension and in Westbrook et al. [2004] we discuss theoretical arguments leading to .
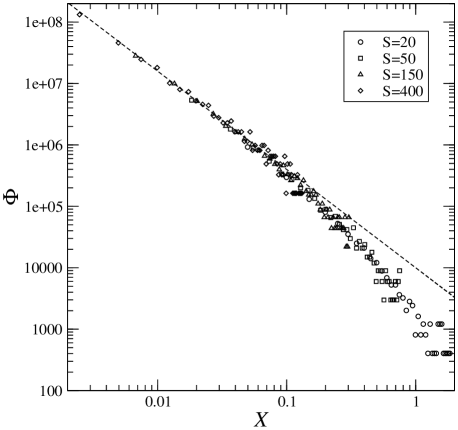
Our simulations conform well to dynamical scaling of the cluster size distribution. This means that number of clusters per unit mass varies with mass and time together as a single scaling function,
| (3) |
where is the weight average cluster mass. This relationship is confirmed in figure 3, where we rescale the mass distribution from different times in the simulations onto a universal curve.
The scaling function which we observe in figure 3 exhibits power law behaviour with for with . This is not intrinsically surprising (and indeed it matches theoretical expectations [Van Dongen and Ernst, 1985]) but it has forced us to abandon the way experimentally observed distributions of cluster linear size have hitherto been plotted. The problem is that given equation (3) and its observed power law form, we must expect that the distribution of clusters by linear span should at small take the form which diverges as using our observed exponents. For small enough crystal sizes this behaviour will be modified by the role of growth processes other than aggregation, but that lies outside the scaling regime.
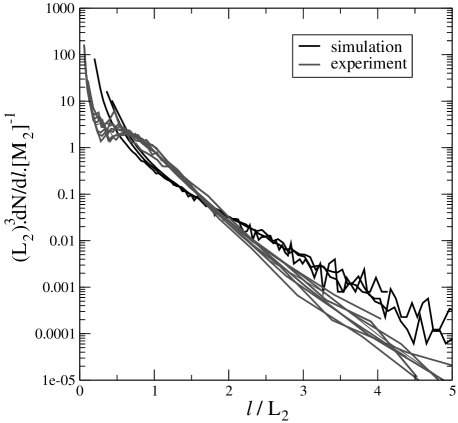
Because of the divergence one has to take great care in constructing a characteristic linear size , where the natural choices are and the lowest whole number for which the denominator is not dominated by the smallest clusters is . The simplest natural scaling ansatz for the cluster span distribution is then found [Westbrook et al., 2004] to be
where . Figure 4 shows that this scaling ansatz works acceptably for our simulation data and well for the experimental observations. The latter are rich data because cluster span is one of the simplest automated measurements to take.
The rescaled distributions from simulation and experiment agree fairly well but not perfectly, as shown in Figure 4. One experimental reservation is the fall-off of experimental observation efficiency at small sizes, where clusters can be missed. However our scaling procedure itself is in effect expressly designed to avoid sensitivity to this, and the superposition of the experimental data down to small reduced sizes looks good. Indeed it looks so good that the transient flattening around , which is absent from the simulations, appears to be significant.
One suggestion for the flattening around the middle of the rescaled distribution is that it might be associated with the peculiar feature of the collision rate being zero between clusters of equal sedimentation speed. Our simulations include this feature but for low relative approach speeds, where each cluster has more time to adjust its momentum in response to the other perturbing the local airflow, our approximation of ignoring hydrodynamic interactions (and hence phenomena such as wake capture) is less accurate.
In summary, we have a fairly complete understanding of the geometry of the atmospheric ice crystal aggregates, dominated by sticking upon encounter. Further details of the sticking mechanism (which we did not include) appear not to be important for the cluster geometry, and the excellent scaling superposition of the experimental cluster size distributions suggests sticking efficiency does not favour aggregation at particular sizes. The simplest interpretation of these observations is that although the sticking probability might be low for a single microscopic event, many such contacts will be attempted during a cluster-cluster encounter so that eventual escape is unlikely. The actual sticking mechanism between ice crystals remains an intriguing open question, particularly for the low temperatures of figure 1.
The fact that the same evolution is seen for differing initial monomer populations (rods and rosettes) suggests that a single set of geometric relationships for ice aggregates can successfully be applied in a wide range of cloud conditions. This would lead to greater accuracy in retrieving cloud properties such as precipitation rate and predicting the radiative affect of ice crystal aggregates upon the climate system.