Phonons and Magnetic Excitations in Mott-Insulator LaTiO3
Abstract
The polarized Raman spectra of stoichiometric LaTiO3 (T K) were measured between 6 and 300 K. In contrast to earlier report on half-metallic LaTiO3.02, neither strong background scattering, nor Fano shape of the Raman lines was observed. The high frequency phonon line at 655 cm-1 exhibits anomalous softening below TN: a signature for structural rearrangement. The assignment of the Raman lines was done by comparison to the calculations of lattice dynamics and the nature of structural changes upon magnetic ordering are discussed. The broad Raman band, which appears in the antiferromagnetic phase, is assigned to two-magnon scattering. The estimated superexchange constant meV is in excellent agreement with the result of neutron scattering studies.
pacs:
78.30.Hv, 63.20.Dj, 75.30.DS, 75.50.EeThere is still debate on the role of orbital degrees of freedom in the antiferromagnetism of LaTiO3 and whether orbital ordering exists in the antiferromagnetic phase. Neutron and resonant x-ray scattering results of Keimer et al.keimer1 have been interpreted as evidence for orbital fluctuations, consistent with orbital liquid model of Khaliullin and Maekawa khaliullin1 . It has been pointed out keimer1 that earlier Raman results of Reedyk at al.reedyk1 , where large background and Fano shape of the phonon line near 300 cm-1 have been observed, may also indicate orbital fluctuations coupled to lattice vibrations. Some recent experimental results on the temperature dependence near TN of neutron and x-ray diffraction, heat capacity and infrared spectra cwik1 ; hemberger1 , however, provide evidence for noticeable deformation of TiO6 octahedra and structural anomaly near the antiferromagnetic ordering, which indirectly supports the concept of orbital ordering.
The observation in the Raman spectrum of insulating rare earth titanates of structureless background and Fano interference is highly unusual. At the same time, it is well known that transport and magnetic properties of LaTiO3 okada1 ; taguchi1 ; meijer1 depend crucially on sample’s stoichiometry. Critical dependence on stoichiometry may be expected also for the Raman spectra. Indeed, anomalous variation of phonon Raman intensities and linewidths has been reported at 50 K for LaTiO3+δ/2 near the metal-to-Mott-insulator transition at katsufuji1 . The room temperature dc resistivity ( cm) of the LaTiO3 sample used in the Raman experiments of Reedyk et al.reedyk1 is much lower than that reported for nearly stoichiometric samples ( cm okada1 ; taguchi1 ) and rather corresponds to . Therefore, it is of definite interest to examine the Raman spectra of stoichiometric LaTiO3 in a broad temperature range including Néel temperature TN. It is plausible to expect that the variation of the Raman spectra with decreasing temperature below TN will provide additional information on the controversial issues of Fano interference and magnetic-order-induced orbital ordering.
In this paper we present polarized temperature-dependent Raman spectra of stoichiometric LaTiO3 (T K) between 6 and 300 K. At room temperature, in contrast to Ref.reedyk1 , neither strong background scattering nor Fano shape of the Raman lines is observed. The temperature shift of some Raman lines exhibits clear anomaly below TN: a signature for structural rearrangement. We discuss the assignment of the Raman lines to definite phonon modes and the nature of structural changes. The broad Raman band, which appears in the antiferromagnetic phase, is assigned to two-magnon scattering.
LaTiO3 samples were prepared using La2O3 (99.99%), TiO2 (99.99%) and Ti2O3 (99.99%) as starting materials. La2O3 was heat treated at 1300∘C for 24h and TiO2 was dried for 24h at 120∘C before use. Stoichiometric amounts of La2O3, Ti2O3 and TiO2 were mixed and arc melted under argon to form black bulk LaTiO3. X-ray diffraction pattern at room temperature revealed orthorhombic structure with lattice parameters Å, Å, and Å, in agreement with earlier reports cwik1 ; fritsch1 . It is known that the magnetic transition temperature, TN, is very sensitive to the oxygen content taguchi1 and it rapidly shifts to lower T if the oxygen composition exceeds the stoichiometric value of 3 meijer1 . Therefore, the value of TN is a precise measure of the oxygen stoichiometry in LaTiO3. The weak ferromagnetism is due to the asymmetric Dzyaloshinsky-Moriya exchange interaction and can easily be picked up in dc-susceptibility measurements.

For our sample the SQUID magnetometry was employed to measure the magnetic transition temperature. Fig. 1(a) shows the inverse susceptibility data measured at 50 Oe in the temperature range between 5 and 400 K. A sharp drop occurs at 150 K, in excellent agreement with the best available data for stoichiometric single crystals fritsch1 . Another supportive evidence, which points to almost perfect sample stoichiometry, is the room temperature conductivity, obtained by Kramers-Kronig transformation of near-normal reflectance. It extrapolates [Fig. 2(b)] to the dc-value of cm-1 (cm), which corresponds to 0.01 taguchi1 .
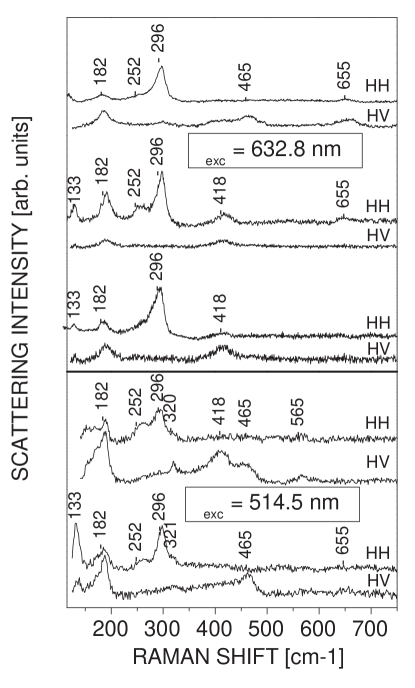
Raman spectra were collected under microscope (focus spot size 1-3 m, nm or 632.8 nm) from freshly cleaved or as-grown surfaces of the bulk material. The crystallographic orientation of the surface was not known but in most cases the spectra taken with parallel (HH) and crossed (HV) polarizations of incident and scattered radiation were totally polarized: an indication that the surface coincides with one of the main crystallographic planes (, or ). For temperature-dependent measurements the sample was mounted in a liquid helium cryostat. As the Raman signals were extremely low, relatively high incident laser power ( mW) was used, which resulted in some heating of the microprobe spot.
Fig. 2 shows the polarized Raman spectra of LaTiO3 as obtained at room temperature from five different spots. Three Raman lines are clearly pronounced in parallel (HH) scattering configuration at 133, 252 and 296 cm-1 and four other lines are seen in crossed (HV) configuration at 182, 418, 465, and 655 cm-1. The phonon line positions are close to those reported by Reedyk et al. (see Fig. 2 in reedyk1 ), but the background scattering is much weaker and the lines are narrower. The most significant difference is the observation of two clearly distinguishable symmetric lines at 252 and 296 cm-1 instead of one broader asymmetric band between 220 and 300 cm-1. Taking into account that for LaTiO3+δ/2 one expects an increase of the electronic background, phonon line intensity and phonon line width with increasing katsufuji1 , the puzzling ”Fano shaped” band reported by Reedyk et al.reedyk1 seems to have simpler explanation as a complex band, consisting of two relatively broad symmetric lines centered at 252 and 296 cm-1.

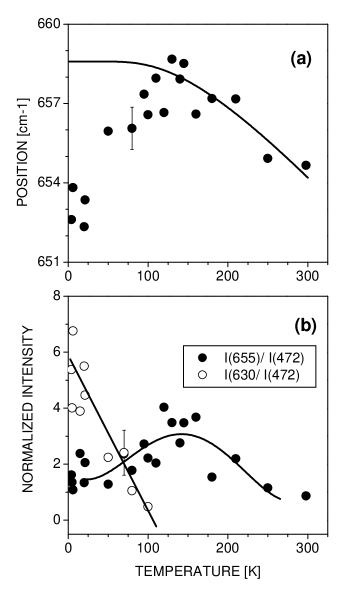
The variations with temperature of the HH and HV Raman spectra are shown in Fig.3. Upon lowering temperature some of the lines [182 cm-1(HV), 296 cm-1(HH), 465 cm-1(HV)] exhibit normal monotonous narrowing and hardening to 196, 310 and 474 cm-1, respectively. The line at 252 cm-1 decreases in intensity and cannot clearly be detected as the nominal temperature approaches TN. Instead, in the AFM phase a relatively broad line arises between 250 and 300 cm-1. At low temperatures two additional lines are clearly pronounced at 402 and 431 cm-1 in the HV spectra. The line, which exhibits anomalous temperature behavior, is the one at 655 cm-1. As illustrated in Fig. 4, with lowering temperature between 300 K and 130 K this mode hardens and increases in intensity. Upon further cooling, however, it moves back to lower wavenumbers and merges with an arising new broad band centered at about 620 cm-1. The position of this latter band is independent of temperature within the experimental error ( 5 cm-1) and it’s intensity increases much faster compared to intensity decrease of the 655 cm-1 phonon line.
In order to assign the observed Raman lines to definite phonon modes we performed lattice dynamical calculations (LDC) using a shell model, which has been applied earlier for isostructural YMnO3 and LaMnO3 iliev1 . To evaluate the effect of structural changes, identical calculations were done using the neutron diffraction data of Cwik et al. cwik1 for atomic positions at 8 K, 155 K an 293 K. The LDC results showed that both the predicted frequencies and shapes of the phonon modes of LaTiO3 and LaMnO3 are very close. The three HH lines can unambiguously be assigned to modes involving mainly motions of La along (133 cm-1), in-phase rotations around of neighboring (along ) TiO6 octahedra (252 cm-1), and O1 motions in the plane (295 cm-1), respectively. The assignment of HV lines is less straightforward as to each experimentally observed line one can juxtapose , or mode of close predicted frequency. Whatever is the choice, the line at 182 cm-1 corresponds to a mode involving mainly motions of La and the line at 655 cm-1 - to in-phase () or out-of-phase () stretchings of TiO6 octahedra.
The comparison of frequencies calculated using structural data for at 8 K, 155 K, and 293 K provides evidence that the softening of the 655 cm-1 mode below TN is related to the structural changes induced by magnetic ordering cwik1 . These changes include elongation of TiO6 octahedra along (in notations) by 0.2% and shrinking along by 0.3% and an anomalous shortening of the Ti-O1 distance near TN. Indeed, the LDC results predict hardening of all Raman modes except for the , and modes near 650 cm-1. The latter modes have maximum wavenumber at 155 K and then either soften by cm-1 (), or remain unchanged () at 8 K. Interestingly, similar softening below TN has also been observed for the corresponding mode in isostructural LaMnO3 podobedov1 ; iliev2 . Another result that follows from the comparison of LCD data of LaTiO3 at different temperatures is that the HH line at 252 cm-1 at 300 K and the broad band at cm-1 at 6 K most likely correspond to the same ”soft” mode. It is worth noting that all predicted temperature shifts are by factor 3 smaller than the experimentally observed ones. The reason for this discrepancy is not clear.
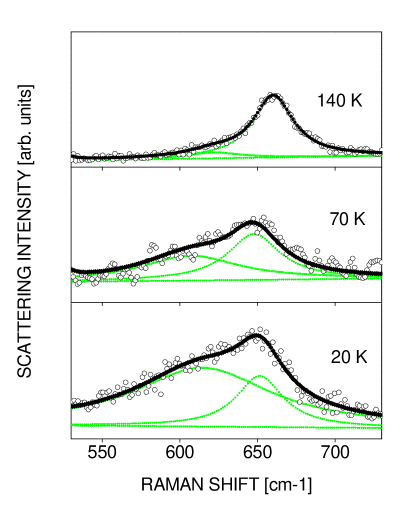
The broad structure between 570 and 650 cm-1 appears only below TN and strongly increases with lowering temperature (see Fig. 5) thus identifying itself as related to magnetic excitations. The magnon dispersion curve for LaTiO3 along the pseudocubic [111] direction was measured by Keimer et al.keimer1 and fitted by the expression , where is the magnon energy, is the coordination number, is the Ti spin, meV is the nearest-neighbor superexchange energy, . The zone-center magnons ( meV) are far below our range of measurement and only second-order magnetic scattering is expected. The intensity of the two-magnon scattering is determined by the magnitude of the two-magnon density of states, which has maximum at the zone boundary, and by the interaction of the two magnons created in the scattering process. The latter interaction results in creation of a ”bound state”, which decreases the two-magnon energy by compared to the sum of individual magnon energies at the boundary elliot1 ; hayes1 . Therefore, the maximum of two-magnon scattering for LaTiO3 is expected at . The position of the broad line in the spectra is cm-1 ( meV) yields meV, in excellent agreement with the results of neutron scattering experiments keimer1 .
Acknowledgements.
This work is supported in part by the state of Texas through the Texas Center for Superconductivity and Advanced Materials.References
- (1) B. Keimer, D. Casa, A. Ivanov, J. W. Lynn, M. v. Zimmermann, J. P. Hill, D. Gibbs, Y. Taguchi, and Y. Tokura, Phys. Rev. Lett. 85, 3946 (2000).
- (2) G. Khaliullin and S. Maekawa, Phys. Rev. Lett. 85, 3950 (2000).
- (3) M. Reedyk, D. A. Crandles, M. Cardona, J. D. Garrett, and J. E. Greedan, Phys. Rev. B 55, 1442(1997).
- (4) M. Cwik, T. Lorenz, J. Baier, R. Müller, G. André, F. Bourée, F. Lichtenberg, A. Freimuth, E. Müller-Hartmann, and M. Braden, Phys. Rev. B 68, 060401 (2003).
- (5) J. Hemberger, H.-A. Krug von Nidda, V. Fritsch, J. Deisenhofer, S. Lobina, T. Rudolf, P. Lunkenheimer, F. Lichtenberg, A. Loidl, D. Bruns, and B. Büchner, Phys. Rev. Lett. 91, 066403 (2003).
- (6) V. Fritsch, J. Hemberger, M. V. Eremin, H.-A. Krug von Nidda, F. Lichtenberg, R. Wehn, and A. Loidl, Phys. Rev. B 65, 212405 (2002).
- (7) Y. Okada, T. Arima, Y. Tokura, C. Murayama, and N. Mori, Phys. Rev. B 48, 9677 (1993).
- (8) Y. Taguchi, T. Okuda, M. Ohashi, C. Murayama, N. Mori, Y. Iye, and Y. Tokura, Phys. Rev. B 59, 7917 (1999).
- (9) G. I. Meijer, W. Henggeler, J. Brown, O.-S. Becker, J. G. Bednorz, C. Rossel, and P. Wachter, Phys. Rev. B 59, 11832 (1999).
- (10) T. Katsufuji and Y. Tokura, Phys. Rev. B 50, 2704 (1994).
- (11) V. Fritsch, J. Hemberger, M. Brando, A. Engelmayer, S. Horn, M. Klemm, G. Knebel, F. Lichtenberg, P. Mandal, F. Mayr, M. Nicklas, and A. Loidl, Phys. Rev. B 64, 045113 (2001).
- (12) M. N. Iliev, M. V. Abrashev, H. -G. Lee, V. N. Popov, Y. Y. Sun, C. Thomsen, R. L. Meng, and C. W. Chu, Phys. Rev. B57, 2872 (1998).
- (13) V. B. Podobedov, A. Weber, D. B. Romero, J. P. Rice, and H. D. Drew, Phys. Rev. B 58, 43 (1998).
- (14) M. N. Iliev and M. V. Abrashev, J. Raman Spectroscopy 32, 805 (2001).
- (15) R. J. Elliot, M. F. Thorpe, G. F. Imbush, R. Loudon, and J. B. Parkinson, Phys. Rev. Lett. 21, 147 (1968).
- (16) W. Hayes and R. Loudon, ”Scattering of Light by Crystals”, John Wiley & Sons, 1978.