Combined surface acoustic wave and surface plasmon resonance measurement of collagen and fibrinogen layer physical properties
Abstract
We use an instrument combining optical (surface plasmon resonance) and acoustic (Love mode surface acoustic wave device) real-time measurements on a same surface for the identification of water content in collagen and fibrinogen protein layers. After calibration of the surface acoustic wave device sensitivity by copper electrodeposition and surfactant adsorption, the bound mass and its physical properties – density and optical index – are extracted from the complementary measurement techniques and lead to thickness and water ratio values compatible with the observed signal shifts. Such results are especially usefully for protein layers with a high water content as shown here for collagen on an hydrophobic surface. We obtain the following results: collagen layers include 7020% water and are 163 to 193 nm thick for bulk concentrations ranging from 30 to 300 g/ml. Fibrinogen layers include 5010% water for layer thicknesses in the 61.5 to 132 nm range when the bulk concentration is in the 46 to 460 g/ml range.
keywords:
surface acoustic wave, surface plasmon resonance, collagen, fibrinogen, density, thickness1 Introduction
Sorption processes at the solid/liquid interface by which (bio)molecules bind to material surfaces are of interest for biosensors, biomaterials, material and surface science. Understanding the three-dimensional organization (including density, solvent content and thickness) of the resulting sorbed film and its evolution during the adsorption process is crucial for many applications in these domains. For biosensors, more specifically, there is a need to monitor the response in real-time, in order to assess the adsorption kinetics, and to be able to distinguish contributions coming from the dry sorbed mass, which is the physical criterion for estimating sensitivity, and those that should be attributed to effects intimately associated to the layer organization, like sorbent-bound water and hydrodynamic effects for example. While a wide variety of methods can qualitatively detect the formation of the sorbed film, almost none of them, taken alone, is quantitative and able to reveal the film organization, and only few can monitor the process in real-time. Scanning probe microscopies might fulfill all these requirements, mainly for submonolayers sorbed on smooth surfaces [1]. Neutron reflectivity [2], X-ray Photoelectron Spectroscopy (XPS) [3], mass spectroscopy and radiolabeling are quantitative techniques able to directly measure the dry sorbed amount. Of all the direct detection (i.e. label-less) techniques, we have identified acoustic and optical methods as being the only ones fulfilling two fundamental criteria of our measurements: time resolved and in-situ (liquid phase) measurement of the physical properties of the adsorbed layer.
Various methods of direct detection of biochemical layers have been developed, either based on the disturbance of an acoustic wave [4] (quartz crystal microbalance [5] – QCM – and surface acoustic wave devices [6] – SAW) or of an evanescent electromagnetic wave (optical waveguide sensors [7, 8], surface plasmon resonance [9, 10] – SPR). While each one of these transducers individually provides reliable qualitative curves during protein adsorption on their functionalized surfaces, extraction of quantitative physical parameters such as optical index, density, viscosity or water content requires modeling of the adsorbed layers [11]. The modeling includes multiple parameters which must be identified simultaneously: hence the need for the combination of (acoustic and optical) detection methods in a single instrument [12, 13, 14, 15] to separate contributions as a same layer is reacting with the surface under investigation. Multiple investigators have identified such a combination of measurement methods as fruitful means of extracting independent physical properties of adsorbed layers, including the challenging combination of QCM and SPR [16, 17, 18, 19, 20] or comparing the results of successive experiments using different instruments [21, 22, 23, 24], combining QCM and reflectometry [25] or measuring separately using the two techniques [26], or SAW and SPR [27].
We here use a combination of Love mode SAW device and SPR to identify values of density, water content and thickness of surfactant films and protein layers (collagen and fibrinogen) adsorbed on methyl-terminated surfaces. This combined measurement is necessary when attempting to convert a raw signal as observed at the output of a transducer (angle shift for SPR, phase and magnitude shift for SAW or frequency and damping for a QCM) to the actual protein mass bound to the surface, which is the physical criterion for estimating the expected highest possible sensitivity of a biosensor since it provides an estimate of the density of active sites on the surface. We furthermore compare the signals obtained from quartz crystal microbalance with dissipation monitoring (QCM-D [28, 29]) measurements to that of the SAW and, based on the results obtained from the analysis of the SAW/SPR combination, show how SAW and QCM interact differently with the layer. The QCM displays a strong sensitivity to viscous interactions with adsorbed layers as was shown previously [30, 31]. SAW devices are sensitive to mass loading, visco-elastic interactions and electrical charge accumulation on the sensing area [32], but with different influences due to the different frequencies and hence penetration ratio of the shear acoustic wave with respect to the layer thickness.
Love mode surface acoustic waves were chosen for their high mass sensitivity and their compatibility with measurements in liquid media [33, 34, 35, 36]. Being based on the propagation of a shear horizontal acoustic wave, their interaction with the surrounding liquid is restricted to an evanescent coupling with the viscous liquid. Although bulk liquid viscosity properties affect the acoustic wave propagation [37, 38], including the phase shift of Love mode SAW [39], we will throughout this investigation consider that the phase shift affecting the SAW device is solely related to adsorbed mass and not to viscous effects of the adsorbed layer, in order to reduce the number of unknowns. Such a crude assumption could be removed by exploiting the SAW insertion losses, for introducing the adsorbed layer viscosity. Throughout the analysis proposed here, we consider hydrodynamic interactions of the acoustic wave with the solvent filled adsorbed layer, as well as the equivalent optical index of the protein-solvent mixture, without focusing on the dynamic viscosity of this adsorbed layer but only on the viscosity of the fluid yielding shear wave evanscent coupling with the solvent.
The chosen protein layers consist of collagen and fibrinogen, selected as references both for their interest in engineering biocompatible surfaces [40, 41] but most significantly for their strong solvent content and hence acoustic properties challenging to analyze. Collagen is a fibrillar protein of the extracellular matrix possessing self-assembly properties, involved in biorecognition processes. The collagen macromolecule consists of a triple helix with dimensions about 300 nm in length and about 1.5 nm in diameter, and weights about 300 kilodaltons [42]. Organization of collagen films adsorbed on hydrophobic surfaces - CH3 – terminated self-assembled monolayers (SAMs) and polystyrene – from 30 to 40 g/ml – were fully characterized under water or after drying using AFM [43, 44], X-ray photoelectron spectroscopy [45] and radioassays. By AFM scratching experiments, thicknesses of the film adsorbed on methyl-terminated surfaces was estimated to be about 20 nm under water and 7-8 nm after drying. Furthermore, it was found that the measurement was strongly influenced at weak applied forces (0.5 nN), in relation with the long-range repulsion (50 to 250 nm) observed by AFM force-distance curves, strongly suggesting that at least some molecules of the film must protrude into the solution [44]. Adsorbed amount of (dry) collagen on methyl-terminated surfaces were estimated to be between 0.4 and 0.8 g/cm2 by combining AFM and XPS measurements. Values near 0.5 g/cm2 were determined to be adsorbed on polystyrene by radiolabeling.
Fibrinogen, on the other hand, is a blood protein that presents three globular domains linked together by fibrilar segments. Similarly to collagen, its molecular weight is about 340 kilodaltons. Fibrinogen adsorbed on various surfaces has been imaged by AFM as well [46], down to molecular resolution [47, 48, 49, 50].
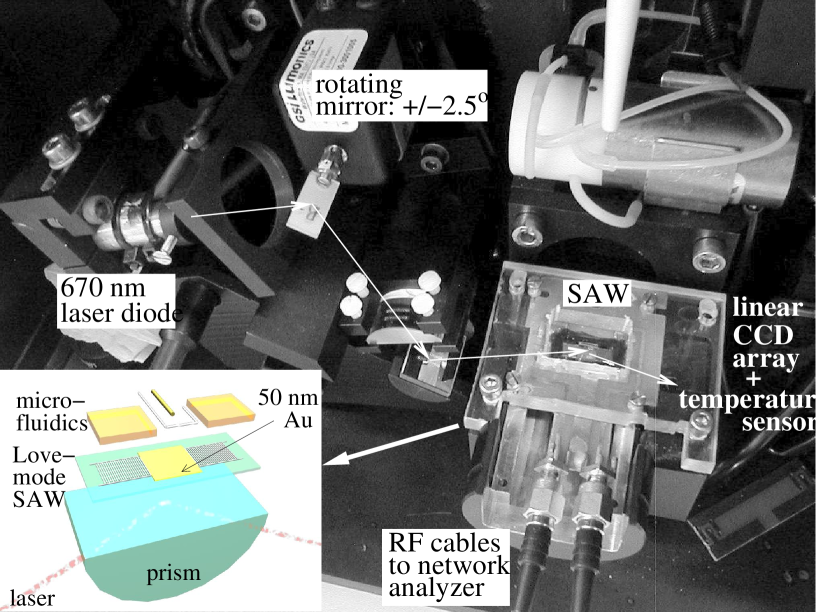
In this presentation, similar films will be investigated, but under the new perspective of combined acoustic and optical measurements for extracting the thickness, mass, and solvent density in a buffer medium. While the SAW/SPR technique (Fig. 1) and data processing with our proposed formalism was already shown [51] to be appropriate in the identification of some physical properties of a rigid adsorbed layer (S-layer) [52], we here quantitatively analyze the organization of collagen and fibrinogen adsorbed layers which are expected to possess a substantial water content. This condition is expected to lead to the largest differences between acoustic and optical signals since both techniques respond differently to a viscous (solvent containing) layer: acoustic methods tend to overestimate the bound mass due to hydrodynamic interactions, while optical methods provide an estimate of the dry bound mass after appropriate modeling of the response but cannot resolve both parameters, thickness and optical index of the layer which SPR is sensitive to. This optical index can be assumed to be the weighted value of the index of water and that of proteins to the volumic part that these components occupy in the film. SPR response is thus dependent on the film organization and on the dry adsorbed amount.
Unlike the model used in other studies [53], we here assume that the SAW device signal shift is predominantly due to added rigidly bound mass on the electrode. Indeed we have shown that, while the QCM is sensitive via hydrodynamic interactions with the topography induced by rough copper electrodeposition [54], SAW is much less sensitive [55]. The contribution of the wave coupling with the viscous fluid to the phase shift [39] will be neglected throughout this investigation. Indeed, collagen films were analyzed using SAW/SPR after different conditionings, inducing a different film organization and related viscoelastic behavior (as probed by AFM and QCM respectively) for a similar adsorbed amount. These differences in the film properties were found to result in only minor changes in the SAW response. For all these reasons, the SAW phase response is considered in this article to be only mass dependent during adsorption phenomena. Hence, we use a proportionality relationship between the mass of the layer per unit area mm2 here () – including the rigidly bound water – and the frequency shift: where is the frequency at which the phase is monitored in an open-loop configuration, is the frequency shift obtained after conversion from phase to frequency shift through the experimentally measured phase to frequency linear relationship, and is the mass sensitivity calibrated by copper electrodeposition. Since the mass sensitivity calibration is a central part in extracting quantitative results from the experimental data, we confirm the results obtained with copper electrodeposition by measuring the SAW signal change during adsorption of a surfactant, cetyltrimethylammonium bromide (CTAB). Hence, four sets of experiments will be described in the experimental section below, after presenting the instrument setup:
-
1.
experimental calibration of the gravimetric sensitivity of the SAW transducer in liquid phase is a core step to the quantitative analysis: such a step is performed by reversible copper electrodeposition, allowing for multiple cycles under different deposited mass configurations to be repeated,
-
2.
because the mechanical properties and surface roughness of copper differ from the biofilm we are investigated, the calibration is validated using CTAB monolayer deposition,
-
3.
collagen thick films will be assembled on the surface under different bulk concentrations,
-
4.
fibrinogen thick films will be assembled on the surface under different bulk concentrations.
2 Experimental section
Instrumentation The combined SAW/SPR instrument developed for performing this experiment has been described previously [52]: a modified Ibis II SPR instrument (IBIS Technologies BV, Netherlands) is used to inject a 670 nm laser in a quartz substrate (Kretschmann configuration) and monitor the reflected intensity vs. angle with an accuracy of /200 pixels at two locations separated by about 2 mm on the sensing surface. The ST-cut quartz substrate is patterned with double-fingers interdigitated electrode for launching a Love mode acoustic wave at a center frequency of 123.5 MHz. The guiding layer is made of a 1.13 m thick PECVD silicon dioxide layer. The phase and insertion loss of the acoustic wave device are monitored using an HP 4396A network analyzer while a custom software records the full reflected intensity vs. angle SPR curve. The mm2 sensing area is coated by e-gun evaporation with nominal thicknesses of 10 nm and 505 nm to support surface plasmon resonance, and is either grounded to minimize varying salt concentration effects on the signal measured by the SAW device during biological experiments, or connected as the working electrode during copper electrodeposition calibration through a bias-T circuit. Both sets of data – SAW phase at a given frequency and SPR reflected intensity curves – are time stamped with an accuracy of 1 second on the common personnal computer internal clock reference for future processing, which for the SPR curve involves polynomial fitting for improving 100-fold the accuracy on the localization of the reflected intensity minimum. The temperature coefficient of the Love mode device has been measured to be 34 ppm/K, in agreement with values reported in the literature [36], and the insertion loss is in the -22 dB to -30 dB range when the grounded sensing area is covered by a liquid. Both dual-finger interdigitated transducers (wavelength: 40 m) are protected from the liquid by a 100 m-high SU8 wall capped with a piece of quartz forming sealed protective chambers [56]. The sides of the SAW devices are glued to an 717 mm opening in a 1.6 mm-thick epoxy (FR4) printed circuit board (PCB) with the bottom area of the SAW tangent to the PCB, allowing optical contact between the bottom surface of the SAW device and a cylindrical prism through optical index matching oil (). After wire bonding the SAW device to the PCB, the region surrounding the SAW device is coated with 1 mm wide, 1-2 mm thick epoxy walls using H54 two-parts epoxy glue (Epoxy Technology, Billerica, MA, USA), forming a 180 to 200 l open well in which the solution is injected using a micropipette.
While both SPR and SAW sensors display theoretically similar sensitivities and detection limits [57], the acoustic sensor is extremely sensitive to temperature variations and care must be taken to properly control the environment around the instrument to keep the temperature stable [12].
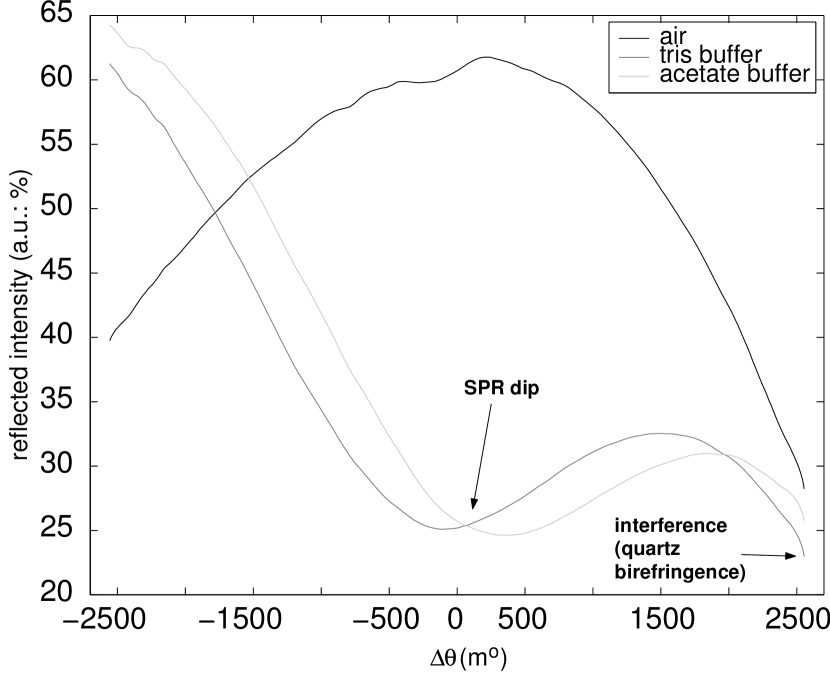
Recording all SPR curves of the reflected intensity vs. angle during the experiment for post-processing is required since the shape of the dip is unusual (Fig. 2) and cannot be processed properly by the commercial software provided with the instrument which expects the substrate to be glass. As seen in Fig. 2 in which the reflected intensity vs. angle curve is displayed, the periodic dips observed when the gold coated SAW sensor is placed over the half-cylinder prism in air is attributed to the birefringence of quartz which is the cause of the interference pattern after reflection of the laser on the metallic surface [52]. The orientation of the quartz substrate on which the SAW propagates has been chosen on purpose to separate as much as possible the successive interference minima. The dip due to SPR is identified when the surface is coated with water, and the position of this dip only is monitored over time. A typical raw SPR reflected intensity vs. angle curve is displayed in Fig. 2: the mean incidence angle is about 722∘ (not calibrated in the Ibis II instrument) and the abscissa is graduated in relative angle shift.
The QCM-D measurements were performed using the electronics supplied by Q-Sense AB (Sweden) using AT-quartz plano-plano resonators (Chintele Quartz Technology Co. Ltd, Zhejiang, P.R. China) coated, by evaporation, with 10 nm and 50 nm , key-hole shaped counter electrode and fully coated sensing electrode, leading to a fundamental resonance frequency around 4.7 MHz and a quality factor in liquid around 5500. These experiments were performed both in a lab-made open cuvette and in the commercially supplied flow cell (with static liquid during the measurement). Both sets of measurements are compatible. However, since the QCM setup is distinct from the SAW/SPR setup, we will not attempt any kinetics comparison between both datasets.
Chemicals and Materials The electrodeposition step was performed using a solution of M in M . The counter electrode was a 0.25-mm-diameter platinum wire shaped in 3/4 of a circle and the pseudo-reference electrode was made of a 1 mm-diameter 99.98+% copper wire (Huntingdon, UK), cleaned by briefly dipping in 70% nitric acid before use. The electrochemical reaction was controlled by a PC3-300 Gamry Instruments (Warminster, USA) potentiostat.
Collagen was supplied by Roche (Boehringer-Mannheim, Mannheim, Germany) as a sterile acidic solution of 3 mg/ml solution of collagen type I from calf skin. It was diluted in PBS buffer (137 mM , 6.44 mM , 2.7 mM and 8 mM ) to reach the wanted concentration just prior to use. Type I fibrinogen from human plasma was obtained from Sigma-Aldrich. Both QCM and SAW/SPR sensing electrodes were coated with an octadecanethiol hydrophobic self-assembled layer, leading to a contact angle above . Alkanethiols were self-assembled by dipping the QCMs in a 10-3 M octadecanethiol (Sigma-Aldrich) solution in ethanol after a 15 minutes cleaning step in UV-O3 and rinsing with ethanol. The SAW devices were placed in a chamber with an ethanol saturated atmosphere, and 150 to 180 l of the same thiol solution was deposited on the open well above the sensing area. Adsorption was subsequently allowed for 3 hours, after which the surfaces were rinsed with ethanol and dried under a stream of nitrogen. The thiol solution and later biochemical solutions are only in contact with the chemically inert H54 epoxy glue and quartz slides capping the SAW device and never with the FR4 epoxy and copper of the PCB, thus minimizing risks of contamination of the solutions and of the sensing surface.
3 Results
3.1 SAW sensitivity calibration
Figure 3 illustrates the calibration procedure using copper electrodeposition: a cyclic voltametry sweep from +600 mV to -60 to -100 mV (depending on the mass of copper to be deposited) vs a copper wire acting as a pseudo-reference electrode provides an estimate of the deposited mass, assuming a 100% efficiency of the electrochemical process. A current is monitored by the potentiostat at a sampling rate of 5 Hz, being a sample index.
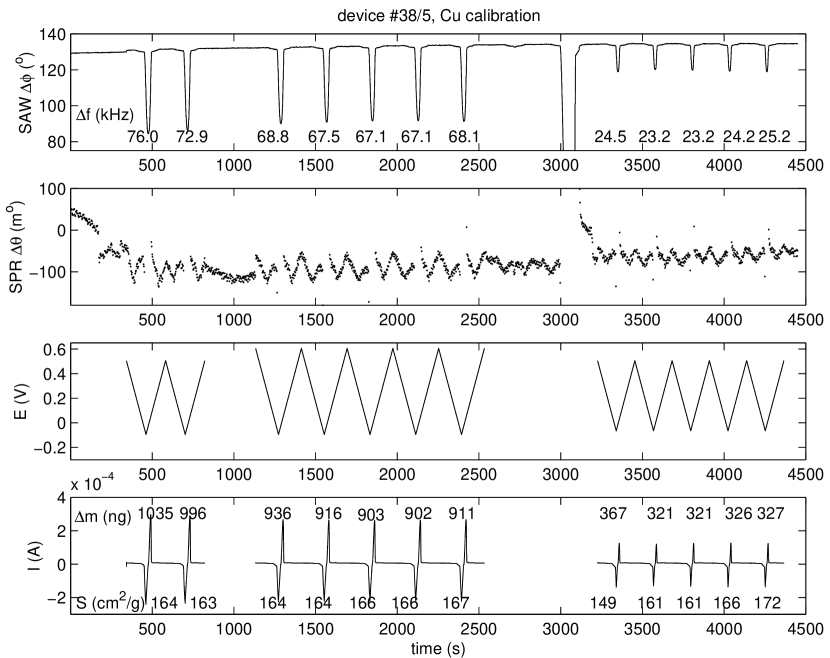
By selecting the voltage range for which the current is negative (copper deposition), we obtain the deposited mass by numerical integration
where is the Faraday constant (96440 C), s is the time interval between two samples, g/mol is the molar weight of copper and the number of electrons required for copper reduction. Simultaneously the phase shift of the SAW device due to the added mass is measured and converted to a frequency variation via the linear phase to frequency relationship measured on the Bode plot: Hz/∘ in our case. Once the deposited mass is estimated, the SAW sensitivity is computed considering the center oscillation frequency MHz, the working electrode area and the frequency shift due to the added mass: , leading to an experimentally measured sensitivity of 16510 cm2/g for one SAW device and 14515 cm2/g for another similar sensor (data not shown), the difference being related to packaging issues and mostly the influence of the protective SU8 wall on the acoustic path.
Both values were confirmed with CTAB adsorption on octadecanethiol coated gold at a bulk concentration of 1.310-4 M: the surface density of surfactant molecules upon adsorption on gold is known from the surface area per molecule of 50 Å2 [58] and the molar weight of 364 g/mol, a mass per unit area of 120 ng/cm2 is deduced assuming the formation of a monolayer. The monolayer formation lead to a frequency shift of the SAW device of 2.5 kHz from which a surface density of 125 ng/cm2 is obtained. Interestingly, the simultaneously observed SPR angle shift can only be interpreted with a layer of optical index at least 1.5, which leads to a layer thickness of 1.50.5 nm fully coated with CTAB (no solvent) after simulation using the formalism described in [59] and following the procedure described in more details later in this article. The large uncertainty on the layer thickness is related to the low molecular weight of CTAB leading to a small mass increase which leads to a phase shift of only about 5 times the noise level of the SAW phase. Such a high optical index is compatible with that provided in the literature for thiol monolayers as an extension of the optical index of bulk alkane solutions [60]. The surface mass density is compatible with that observed with QCM-D measurements following the assumption of a rigid mass, as validated by the good overlap of curves obtained at overtones 3, 5 and 7 when normalized by the overtone number, and the low dissipation increase ().
3.2 SAW/SPR measurements
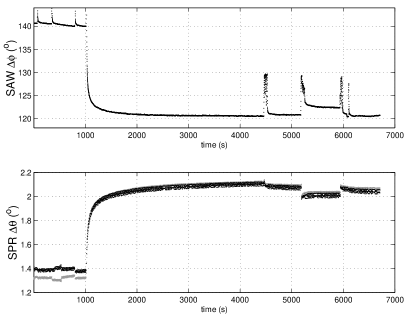
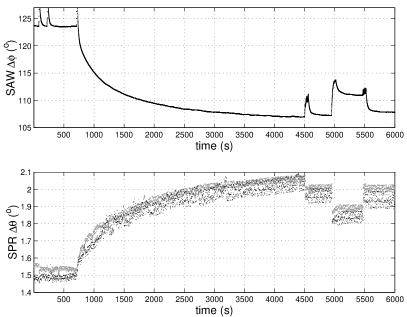
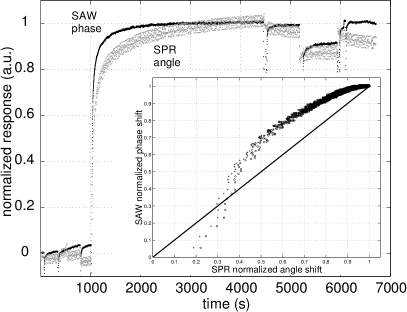
Once the mass sensitivity of the SAW device is calibrated, the combined SAW and SPR measurements are used to monitor protein adsorption and extract the physical properties of the resulting films. Collagen and fibrinogen adsorption were performed on methyl-terminated surfaces of the SAW/SPR device at concentrations of 30 or 300 g/ml and 46 or 460 g/ml respectively. The sequence of solutions brought in contact with the sensing surface was successively PBS (or PBS-water-PBS), protein in PBS, PBS, water and finally PBS. Figure 4 displays a typical signal observed during collagen adsorption on an hydrophobic surface, for (a) 300 g/ml and (b) 30 g/ml bulk concentrations. Immediately after the conditioning with the collagen solution, both SAW and SPR show a clear response, reaching after about one hour a clear plateau or a beginning of a plateau, depending on the conditioning collagen concentration.
 |
 |
| (a) | (b) |
The SAW and SPR shifts at the end of the adsorption with a collagen concentration of 30 g/ml were respectively 17.00.7 ∘ and 0.39 ∘, while a concentration of 300 g/ml lead to 19.20.5 ∘ and 0.65 ∘ for SAW and SPR respectively. Adding PBS, after collagen conditioning, resulted in very small loss ( ∘ for SAW and ∘ for SPR) of the response, stable with time, and subsequent washing by water and PBS again provoked no signal change. This means that molecules do not desorb with time once adsorbed on the substrate. The SAW phase to frequency conversion factor as observed on the Bode plot is 1680 Hz/∘: the resulting frequency variation is translated into a bound mass thanks to the calibrated sensitivities – in our case 165 g/cm2 or 145 g/cm2 depending on the SAW device being used. The resulting hydrated collagen adsorbed films are estimated to weight 1.750.15 and 2.100.20 g/cm2 for the 30 and 300 g/ml solutions respectively.
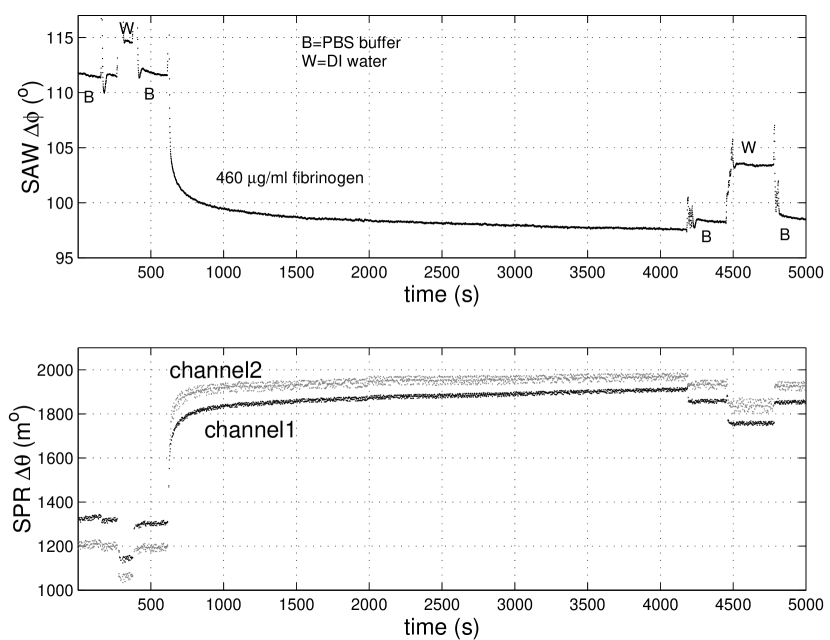
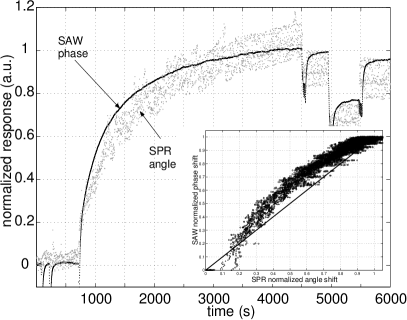
Fig. 5 displays a similar measurement on 460 g/ml fibrinogen. A similar sequence of conditioning steps as previously presented for collagen were applied. PBS washing results in a stable loss of response attributable, like for collagen, to a loss of fibrinogen molecules physisorbed to the adsorbed film. There is again no significant desorption of adsorbed molecules. The observed shifts resulting from fibrinogen adsorption were 14.00.7 ∘ and 0.650.1 ∘ for SAW and SPR respectively. For SAW, using the same relations as was presented for collagen, the surface density of the hydrated fibrinogen films were estimated to be 0.750.1 and 1.50.3 g/cm2 for 46 and 460 g/ml concentrations respectively.
3.3 QCM-D independent validation mesurements
Collagen and fibrinogen adsorption were performed on methyl-terminated QCM surfaces following the same conditions as were used for the SAW/SPR. Changes in resonance frequency and dissipation of the first four odd overtones were measured as a function of time. An example of a QCM-D measurement is presented in Fig. 6 for the same 300 g/ml collagen as in Fig. 4 (b) but on a different setup: both experiments (SAW/SPR and QCM) are based on a lab-made open cuvette in which 200 l of the new solution is manually injected by a micro-pipette. While the kinetics of the SAW and SPR data can be compared, we will not attempt to compare it with the kinetics of the QCM since the latter was included in a different setup – static well geometry does influence the adsorption kinetic [61].
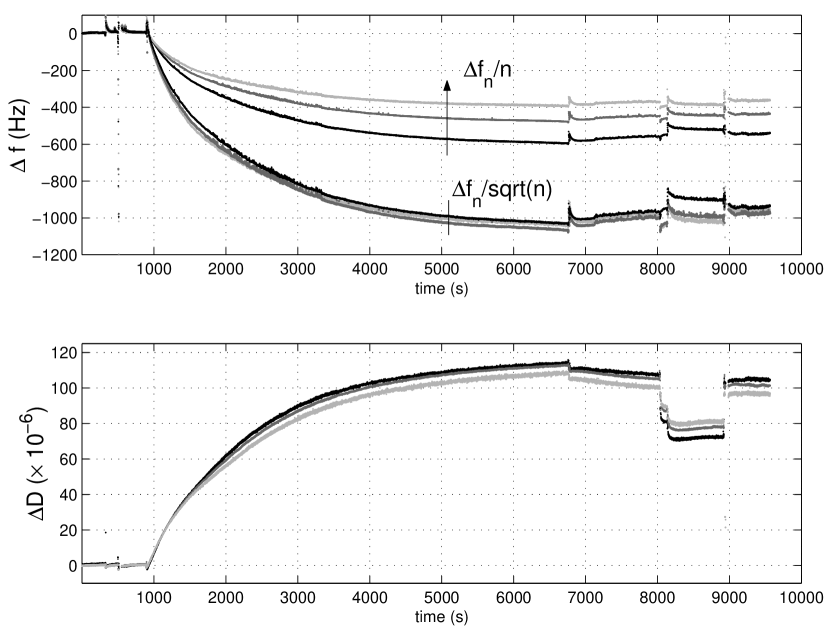
We will however see that the asymptotic behavior of both experiments performed separately lead to the same conclusion, namely the large amount of water trapped in the collagen layer. Frequency shifts are presented after normalizing by the overtone number as classically done when assuming the adsorbed layer to be rigidly bound to the sensing surface, and by the square root of the overtone number as would be expected for a strong hydrodynamic interaction [54]. The frequency responses of the different overtones do not overlap when normalized by the overtone number while they do when normalized by the square root of the overtone number, indicating a predominantly viscous interaction of the QCM with the film and surrounding solvent. Leading to the same conclusion, the dissipation rises to an enormous value above 100. Quantitatively, if this film was assumed to be a rigid layer, these frequency shifts would correspond to wet masses in the range 8 to 12 g/cm2 as obtained by applying the Sauerbrey relation. These values are far larger than the corresponding values deduced by SAW measurements (2.100.20 g/cm2). This points to the fact that SAW measurements are far less sensitive to viscoelastic interactions with the adsorbed film than the QCM. All measurements for collagen and fibrinogen adsorptions at the different concentrations were performed and the characteristic results as explained above are summarized in Table 1. The same conclusion as above can be made in all cases, QCM measurements denoting a behavior of the adsorbed film strongly interacting throug hydrodynamic coupling with the bound and surrounding solvent, and the corresponding wet adsorbed masses being always superior to those deduced by SAW. Fibrinogen shows less viscoelastic properties than the collagen film and lower protein concentrations result in a less viscoelastic behavior of the adsorbed film.
| Analyte (bulk | surface | (nm) | (%) | () | ||
| concentration, g/ml) | density (ng/cm2) | SAW/SPR | SAW/SPR | (Hz) QCM | (Hz) QCM | QCM |
| ? | ?-1000 | NO | 50 | |||
| S-layer | 56020 | NO | 45=900 | 3-5 | ||
| CTAB | 12515 | 100 | NO | 8=160 | 0.2-0.5 | |
| collagen (g/ml) | 1750150 | 1000 | NO | 100 | ||
| collagen (g/ml) | 2100200 | 1200 | NO | 120 | ||
| fibrinogen (g/ml) | 750100 | 1105 | 555 | 4-10 | ||
| fibrinogen (g/ml) | 1500500 | NO | 100=1700 | 8-10 |
Notice the excellent agreement between our results and those cited in the literature about dry mass of collagen layers adsorbed under similar conditions as measured by AFM and XPS: 20 nm thick layers under water and 7-8 nm after drying [44], and adsorbed amount of (dry) collagen between 0.4 and 0.8 g/cm2 are consistent with our 193 nm thick layers and a dry mass of g/cm2, justifying our initial assumptions when modeling the adsorbed layer interaction with the acoustic and optical waves.
4 Discussion
4.1 Physical properties of the layers
The observed SAW phase shift monitored at 123.2 MHz thus translates into a surface mass density of 1.750.15 g/cm2 and 2.100.20 g/cm2 for bulk concentrations of collagen of 30 and 300 g/ml respectively. The SPR angle shift data are modeled following the formalism developed in [59] in which each component of the electrical field is propagated through a stack a planar dielectic interfaces. The optical indices of the metallic layers were taken from the literature [62] considering the 670 nm wavelength: 10 nm titanium with and 45 nm gold layer with , while the optical indexes of the underlying dielectric substrate were taken as coated with 1200100 nm silicon dioxide . While only the last dielectric layer () below the metallic layer is necessary to estimate the position of the plasmon peak, we include the full stack of planar layers in our simulation in order to include possible interference effects. The optical index of the protein is assumed to be in the 1.45 to 1.465 range, as is the case for most polymers [63, 64, 9]. The properties of the protein layer, supposed to be homogeneous, are deduced from the assumption that a weighted average of its components (water and protein) can be used: if the ratio of protein in the layer is , then the optical index of the layer is assumed to be [65] () and its density ( g/cm3 and is assumed to be equal to 1.4 g/cm3 range [66, 11, 63, 64]). The latter value is used in our simulations. The methodology for extracting the physical parameters of the protein layers is the following: we first simulate the predicted SPR dip angle shift as a function of layer protein content and layer thickness , as shown in Fig. 7 where we display the SPR angle shift due to the added dielectric layer formed by the proteins (i.e. dip angle with solvent before adsorption subtracted from the dip angle after adsorption).
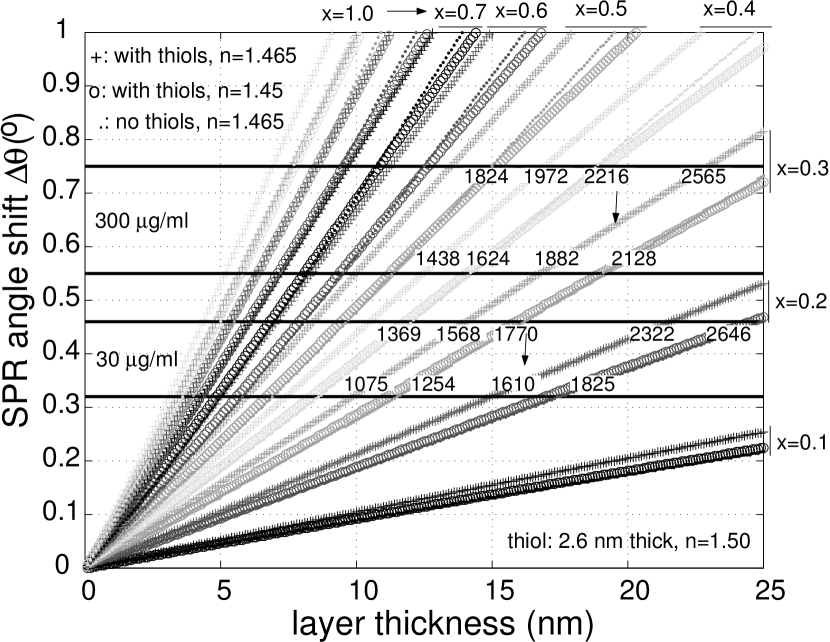
We mark on such a plot the experimentally observed angle shift, which leads to a set of possible {, } couples compatible with the SPR experiment. For each of these set we compute the surface density of the layer and compare it with the value experimentally observed with the SAW measurement. A single set {, } is compatible with both the SAW and SPR data. Notice that the resulting mass density includes the mass of trapped solvent in the layer.
The results of both SPR and SAW signals can only be compatible with a water content of the collagen layers in the range 75%% for 30 g/ml concentration (=0.250.15) and 65%% for 300 g/ml (=0.350.1), with a lower water content for higher bulk collagen concentrations, and correspond to the only set of parameters compatible with the SPR angle shift and the mass variation observed by the SAW device, assuming a purely rigid mass effect and negligible viscous interaction. The very high water content obtained here is confirmed by the large dissipation monitored on the QCM-D.
As was shown earlier in [54] and by others [31], a large dissipation shift indicates strong hydrodynamic interaction of the vibrating QCM surface with the surrounding solvent, and is confirmed by the overtone scaling law constant (as opposed to the expected constant for a rigid layer). One also sees here the strong overestimate of the bound protein mass if assuming a rigid mass and applying the Sauerbrey proportionality relationship between mass and frequency shift. The estimated collagen film thickness in the 15 to 20 nm range (Fig. 7) is in agreement with AFM topography maps obtained ex-situ under similar conditions [43].
Table 1 summarizes our measurement results on collagen and fibrinogen layers following the data processing methodology described in the previous paragraph. We observe that the parameters extracted from the SAW/SPR simultaneous measurements are in good qualitative agreement with the QCM-D results: a layer leading to a high dissipation increase () and an overtone normalization law with the square root of the overtone number is characterized by a high water content, as seen with collagen. On the other hand a small dissipation increase and a normalization law of the QCM frequencies with the overtone number are indicative of a low water content and a layer behaving as a rigid mass bound to the surface, as observed with CTAB and the S-layer. Fibrinogen is an intermediate case, for which the QCM frequency does not scale well with the overtone number nor with the square root of the overtone number, and for which the dissipation increase is average. We indeed find a rather low water content for such layers. The uncertainty on the collagen layer density and hence thickness is large: as opposed to highly ordered layers such as those formed by self-assembled monolayers of thiols or by CTAB, we do not expect highly disorganized polymer-like films of fibrous proteins to form exactly similar structures from one experiment to another. The physical property (water content and hence density and optical index) results on the other hand are consistent from one experiment to another, hence the need for the simultaneous measurements at the same location by both optical and acoustic methods (and eventually additional methods such as scanning probe microscopy [49]) in order to obtain statistically significant properties of the film.
4.2 Kinetics analysis
We attempt now to provide some hint at differences in the kinetics as observed by acoustic and optical methods. We compare the kinetics as monitored by SAW and SPR by normalizing the response of the sensor once the saturation level is reached, just after the rinsing buffer step. We thus plot in Figs. 8 (a) and (b) the curves
| (1) |
where is the adsorption starting time, the time at which a saturation signal has been reached and the protein solution is replaced by buffer, while is a signal which can either be in our case the SAW phase shift or the SPR angle shift . We now first analyze the expected behavior of the normalized quantities of the two signals when assuming a rigid mass interaction and the model presented previously here, and will then discuss some of the possible causes of deviation from this expected behavior.
 |
 |
| (a) | (b) |
If we first assume that the SAW signal shift is proportional to the bound mass – including the trapped solvent – and that the SPR signal is proportional to the added protein quantity, then and where is the common layer thickness measured by both techniques. By introducing these proportionality relationships in Eq. 1, we obtain normalized quantities expressed as for the SAW phase and for the SPR angle, where an index indicates the value of the quantity at the date at which saturation is reached and index indicated the beginning of the adsorption.
If we furthermore assume, as has been done previously in the quantitative analysis of the data, that and , and considering additionally that and , we finally find that both normalized quantities express as and . Since both techniques, SAW and SPR, are probing the same surface, not only do they measure a common layer thickness, but also a common protein to water ratio, so that a common final value can be attributed to both and , and finally the two expressions simplify and give for the normalized SAW data and .
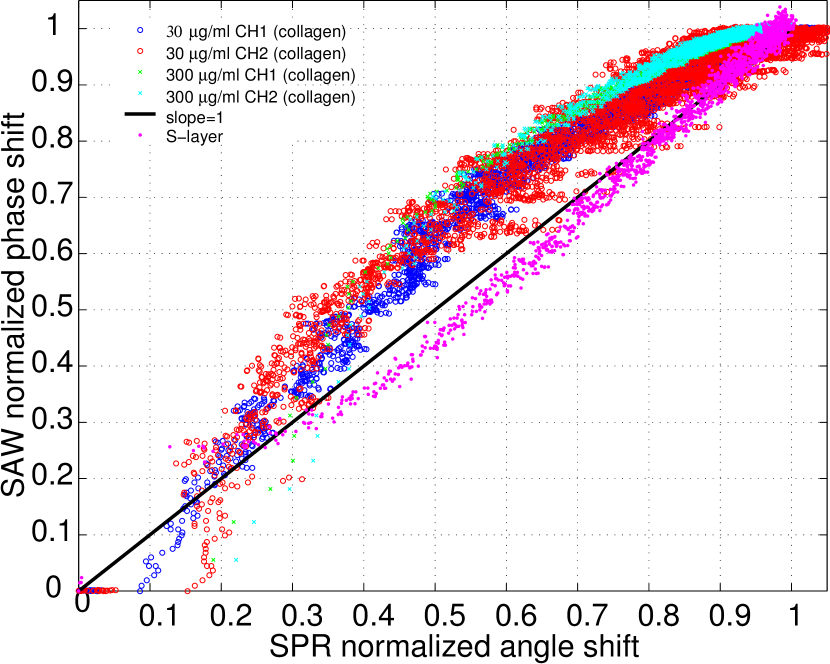
In conclusion of this calculation, we see that following two assumptions about the proportionality of the SAW and SPR signals with the physical properties of the layer and the evolution of the physical property of the protein layer as a function of water content, we reach the same law for the evolution of the normalized SAW and SPR signals. We test this result by eliminating the time parameter and plotting the SAW normalized phase shift as a function of SPR normalized angle shift. We predict that all points should lie on the line of slope 1. The S-layer data shown previously [52] do not show any significant difference in the kinetics as detected by the optical and acoustic methods, and hence indeed all normalized points fall close to this line (Fig. 9). On the other hand the solvent swollen fibrinogen and collagen adsorbed layers presented here seem to display a faster kinetics as detected by the acoustic method than the one detected by the optical method. Therefore we see in inset of Fig. 8 (a) and (b) that all points lie above the line of slope 1. Such a graph provides a quantitative relationship between measurements obtained by acoustic and optical methods.
From the calculation we just presented, we can attribute the discrepancy of the normalized point distribution to either of the two assumptions: either the SAW signal is not strictly proportional to the bound mass (assumption ) or the simple linear law relating the physical properties of the layer (density and optical index) to the physical properties of the individual components of the layer – protein and water – is not accurate. In view of the previously published literature [11, 53], we favor the first possibility and propose a possible contribution of the hydrodynamic interaction of the collagen layer to the SAW signal. The acoustic signal overestimates the bound mass by being affected by the bound solvent as well, while the optical method under-estimates the bound mass due to the lowered optical index of the adsorbed layer associated with the bound solvent.
Throughout this analysis, neither the viscoelasticity of the adsorbed layer or of the surrounding solvent, nor the experimentally measured acoustic losses, have been considered. The shortcoming of these simplifications might be solved by adding a set of charts relating the frequency shift with layer thickness and viscosity, and most significantly insertion loss with these parameters. Such an investigation was endeavoured in [39, 67], in the former reference for solvent only (no adsorbed layer) and in the latter for a single layer in air, since the coupled phase/magnitude shift induced by both mass loading and viscoelastic coupling makes the separation of each contribution complex when considering finite thickness layers coated by a viscous solvent. The insertion loss evolution observed between the beginning and end of each experiment has been indicated in the caption of each experimental SAW chart result for the reader to assess the validity of this assumption: while a minute insertion loss change in the case of fibrinogen (0.5 dB) hints at the validity of our assumptions, the large (3.3–6.5 dB) insertion loss observed during collagen adsorption hints at the need for a more complex analysis to grasp all the subtelties of the adsorption process.
5 Conclusion
We have shown how a two steps measurement, first using copper electrodeposition for instrument calibration followed by a measurement on the actual biological layer under investigation, on a combined SAW/SPR instrument leads to an estimate of the water content and layer thickness. While each individual technique cannot achieve such identification, both common parameters (water content ratio and layer thickness) can be identified with the combination. Such results are especially useful for protein layers with high water content for which the hydrodynamic interaction can become predominant over rigid adsorbed mass. We have verified the calibration process using CTAB, confirming the 120 ng/cm2 surface density due solely to the densely organized monolayer, and illustrated the technique with an estimate of the water content of collagen, leading to a 70%-water/30%-protein result, which is in agreement with the large dissipation increase (quality factor decrease) observed by QCM-D. Furthermore, QCM-D overtone normalization factor with such solvent swollen layers is the inverse of the square root of the overtone number (and not the inverse of the overtone number as would be the case for a rigid layer). Applying the proportionality factor between QCM frequency shift and surface mass density as predicted by the Sauerbrey relationship, assuming a rigidly bound mass, leads to a strong overestimate of the adsorbed mass. We have also shown that fibrinogen layers have a water content of 5010 %, compatible with a lower dissipation factor increase in the QCM-D measurements. Finally, we have discussed the comparison of kinetics as observed by optical and acoustic techniques and propose that the discrepancies observed in the case of solvent swollen layers might be attributed to minor hydrodynamic interactions of the SAW with the protein layer. Introducing in this analysis the SAW insertion losses would allow to resolve one more unknown, namely the adsorbed layer dynamic viscosity.
6 Acknowledgments
All literature references were fetched on the Library Genesis at gen.lib.rus.ec, whose service is invaluable to our research activities. Funding was provided by European Comission Framework Program grants FP5-IST PAMELA and FP7-ICT LoveFood.
References
References
- [1] D. Keller, Scanning force microscopy in biology, in: A. Baszkin, W. Norde (Eds.), Physical Chemistry of Biological Interfaces, Marcel Dekker Inc., New York, 2000.
- [2] J. Lu, R. Thomas, The application of neutron and x-ray specular reflection to proteins at interfaces, in: A. Baszkin, W. Norde (Eds.), Physical Chemistry of Biological Interfaces, Marcel Dekker Inc., New York, 2000.
- [3] M. Plunkett, P. Claesson, M. Ernstsson, M. Rutland, Comparison of the adsorption of different charge density polyelectrolytes: microbalance and X-ray photoelectron spectroscopy study, Langmuir 19 (2003) 4678–4681.
- [4] B. Cavić, G. Hayward, M. Thompson, Acoustic waves and the study of biochemical macromolecules and cells at the sensor-liquid interface, Analyst 124 (1999) 1405–1420.
- [5] M. Rodahl, P. Dahlqvist, F. Höök, B. Kasemo, The quartz crystal microbalance with dissipation monitoring, in: E. G. E, Lowe (Eds.), Biomolecular Sensors, Taylor & Francis, London, 2002, pp. 304–316.
- [6] E. Gizeli, Acoustic transducers, in: E. G. E, Lowe (Eds.), Biomolecular Sensors, Taylor & Francis, London, 2002, pp. 176–206.
- [7] R. Cush, J. Cronin, W. Stewart, C. Maule, J. Molloy, N. Goddard, The resonant mirror: a novel optical biosensor for direct sensing of biomolecular interactions, Biosensors and Bioelectronics 8 (1993) 347–353.
- [8] J. Vörös, J. Ramsden, G. Csúcs, I. Szendrö, S. D. Paul, M. Textor, N. Spencer, Optical grating coupler biosensors, Biomaterials 23 (2002) 3699–3710.
- [9] B. Liedberg, C. Nylander, I. Lundström, Surface plasmon resonance for gas detection and biosensing, Sensors and Actuators 4 (1983) 299–304.
- [10] B. Ivarsson, M. Malmqvist, Surface plasmon resonance: development and use of BIACORE instruments for biomolecular interaction analysis, in: E. Gizeli, C. Lowe (Eds.), Biomolecular Sensors, Taylor & Francis, London, 2002, pp. 241–268.
- [11] F. Höök, B. Kasemo, T. Nylander, C. Fant, K. Sott, H. Elwing, Variations in coupled water, viscoelastic properties, and film thickness of a Mefp-1 protein film during adsorption and cross-linking: a quartz crystal microbalance with dissipation monitoring, ellipsometry, and surface plasmon resonance study, Anal. Chem. 73 (2001) 5796–5804.
- [12] L. Bailey, D. Kambhampati, K. Kanazawa, W. Knoll, C. Frank, Using surface plasmon resonance and the quartz crystal microbalance to monitor in situ the interfacial behavior of thin organic films, Langmuir 18 (2002) 479–489.
- [13] A. Laschitsch, B. Menges, D. Johannsmann, Simultaneous determination of optical and acoustic thicknesses of protein layers using surface plasmon resonance spectroscopy and quartz crystal microweighing, Appl. Phys. Lett. 77 (14) (2000) 2252–2254.
- [14] A. Bund, A. Baba, S. Berg, D. Johannsmann, J. Lübben, Z. Wang, W. Knoll, Combining surface plasmon resonance and quartz crystal microbalance for the in-situ investigation of the electropolymerization and doping/dedoping of poly(pyrrole), J. Phys. Chem. B 107 (2003) 6743–6747.
- [15] M. Plunkett, Z. Wang, M. Rutland, D. Johannsmann, Adsorption of pNIPAM layers on hydrophobic gold surfaces measured in situ by qcm and spr, Langmuir 19 (2003) 6837–6844.
- [16] C. Keller, K. Glasmästar, V. Zhdanov, B. Kasemo, Formation of supported membranes from vesicles, Physical Review Letters 84 (23) (2000) 5443.
- [17] A. Bund, A. Baba, S. Berg, D. Johannsmann, J. Lübben, Z. Wang, W. Knoll, Combining surface plasmon resonance and quartz crystal microbalance for the in situ investigation of the electropolymerization and doping/dedoping of poly (pyrrole), The Journal of Physical Chemistry B 107 (28) (2003) 6743–6747.
- [18] E. Reimhult, C. Larsson, B. Kasemo, F. Höök, Simultaneous surface plasmon resonance and quartz crystal microbalance with dissipation monitoring measurements of biomolecular adsorption events involving structural transformations and variations in coupled water, Analytical chemistry 76 (24) (2004) 7211–7220.
- [19] E. Reimhult, M. Zäch, F. Höök, B. Kasemo, A multitechnique study of liposome adsorption on au and lipid bilayer formation on sio2, Langmuir 22 (7) (2006) 3313–3319.
- [20] Y. Zong, F. Xu, X. Su, W. Knoll, Quartz crystal microbalance with integrated surface plasmon grating coupler, Analytical chemistry 80 (13) (2008) 5246–5250.
- [21] C. Larsson, M. Rodahl, F. Höök, Characterization of dna immobilization and subsequent hybridization on a 2d arrangement of streptavidin on a biotin-modified lipid bilayer supported on sio2, Analytical Chemistry 75 (19) (2003) 5080–5087.
- [22] J. Malmström, H. Agheli, P. Kingshott, D. S. Sutherland, Viscoelastic modeling of highly hydrated laminin layers at homogeneous and nanostructured surfaces: quantification of protein layer properties using QCM-D and SPR, Langmuir 23 (19) (2007) 9760–9768.
- [23] P. Ansorena, A. Zuzuarregui, E. Pérez-Lorenzo, M. Mujika, S. Arana, Comparative analysis of qcm and spr techniques for the optimization of immobilization sequences, Sensors and Actuators B: Chemical 155 (2) (2011) 667–672.
- [24] R. Konradi, M. Textor, E. Reimhult, Using complementary acoustic and optical techniques for quantitative monitoring of biomolecular adsorption at interfaces, Biosensors 2 (4) (2012) 341–376.
- [25] M. Edvardsson, S. Svedhem, G. Wang, R. Richter, M. Rodahl, B. Kasemo, Qcm-d and reflectometry instrument: applications to supported lipid structures and their biomolecular interactions, Analytical chemistry 81 (1) (2008) 349–361.
- [26] R. P. Richter, A. R. Brisson, Following the formation of supported lipid bilayers on mica: a study combining AFM, QCM-D, and ellipsometry, Biophysical journal 88 (5) (2005) 3422–3433.
- [27] F. Bender, P. Roach, A. Tsortos, G. Papadakis, M. I. Newton, G. McHale, E. Gizeli, Development of a combined surface plasmon resonance/surface acoustic wave device for the characterization of biomolecules, Measurement Science and Technology 20 (12) (2009) 124011.
- [28] M. Rodahl, B. Kasemo, A simple setup to simultaneously measure the resonant frequency and the absolute dissipation factor of a quartz crystal microbalance, Rev. Sci. Instrum. 67 (1996) 3238–3241.
- [29] M. Rodahl, F. Höök, C. Frederiksson, C. Keller, A. Krozer, P. Brzezinski, M. Voinova, B. Kasemo, Simultaneous frequency and dissipation factor QCM measurements of biomolecular adsorption and cell adhesion, Faraday Discuss. 107 (1997) 229–246.
- [30] M. Voinova, M. Rodahl, M. Jonson, B. Kasemo, Viscoelastic acoustic response of layered polymer films at fluid-solid interfaces: continuum mechanics approach, Physica Scripta 59 (1999) 391–396.
- [31] M. Rodahl, B. Kasemo, On the measurement of thin liquid overlayers with the quartz-crystal micobalance, Sensors and Actuators A 54 (1996) 448–456.
- [32] J. Ricco, S. Martin, T. Zipperian, surface acoustic wave gas sensor based on film conductivity changes, Sensors and Actuators 18 (1985) 319–333.
- [33] G. McHale, F. Martin, M. Newton, Mass sensitivity of acoustic wave devices from group and phase velocity measurements, J. Appl. Phys. 92 (6) (2002) 3368–3373.
- [34] E. Gizeli, Design considerations for the acoustic waveguide biosensor, Smart. Mater. Struct. 6 (1997) 700–706.
- [35] A. Wang, J. Cheeke, C. Jen, Sensitivity analysis for Love mode acoustic gravimetric sensors, Appl. Phys. Lett. 64 (22) (1994) 2940–2942.
- [36] J. Du, G. Harding, J. Ogilvy, P. Dencher, M. Lake, A study of love-wave acoustic sensors, Sensors and Actuators A 56 (1996) 211–219.
- [37] B. Jakoby, M. Vellekoop, Viscosity sensing using a love-wave device, Sensors and Actuators A 68 (1998) 275–281.
- [38] F. Herrmann, D. Hahn, S. Büttgenbach, Separate determination of liquid density and viscosity with sagitally corrugated love-mode sensors, Sensors and Actuators 78 (1999) 99–107.
- [39] L. E. Fissi, J.-M. Friedt, S. Ballandras, Modeling the rf acoustic behavior of love-wave sensors loaded with organic layers, in: IEEE Ultrasonic Symposium, New York, USA, 2007, pp. 484–487.
- [40] L. di Marzo, W. Hunter, R. Schultz, J. Risavy, In vivo study of collagen-impregnated double velour prosthesis, Vascular and Endovascular Surgery 23 (3).
- [41] N. Marín-Pareja, M. Cantini, C. González-García, E. Salvagni, M. Salmerón-Sánchez, M.-P. Ginebra, Different organization of type I collagen immobilized on silanized and nonsilanized titanium surfaces affects fibroblast adhesion and fibronectin secretion, Applied Materials & Interfaces.
- [42] H. Lodish, A. Berk, S. Zipursky, P. Matsudaira, D. Baltimore, J. Darnell, Molecular Cell Biology. 4th edition, W. H. Freeman, New York, 2000.
- [43] F. Denis, P. Hanarp, D. Sutherland, J. Gold, C. Mustin, P. Rouxhet, Y. Dufrêne, Protein adsorption on model surfaces with controlled nanotopography and chemistry, Langmuir 18 (3) (2002) 819–828.
- [44] V. D. Cupere, J. V. Wetter, P. Rouxhet, Nanoscale organization of collagen and mixed collagen-pluronic adsorbed layers, Langmuir 19 (2003) 6957–6967.
- [45] Y. Dufrêne, T. Marchal, P. Rouxhet, Probing the organization of adsorbed protein layers: complementarity of atomic force microscopy, X-ay photoelectron spectroscopy and radiolabeling, Applied Surface Science 144–145 (1999) 638–643.
- [46] B. Drake, C. Prater, A. Weisenhorn, S. Gould, T. Albrecht, C. Quate, D. Cannell, H. Hansma, P. Hansma, Imaging crystals, polymers, and processes in water with an atomic force microscope, Science 243 (1989) 1586–1589.
- [47] R. Wigren, H. Elwing, R. Erlandsson, S. Welin, I. Lundström, Structure of adsorbed fibrinogen obtained by scanning force microscopy, FEBS Letters 280 (1991) 225–228.
- [48] P. Cacciafesta, A. Humphris, K. Jandt, M. Mile, Human plasma fibrinogen adsorption on ultraflat titanium oxide surfaces studied with atomic force microscopy, Langmuir 16 (2000) 8167–8175.
- [49] K. Choi, J.-M. Friedt, F. Frederix, A. Campitelli, G. Borghs, Simultaneous atomic force microscope and quartz crystal microbalance measurements: Investigation of human plasma fibrinogen adsorption, Appl. Phys. Lett. 81 (2002) 1335–1337.
- [50] B. Snopok, K. Kostyukevych, O. Rengevych, Y. Shirshov, E. Venger, I. Kolesnikova, E. Lugovskoi, A biosensor approach to probe the structure and function of the adsorbed proteins: fibrinogen at the gold surface, Semiconductor Physics, Quantum Electronics & Optoelectronics (National Academy of Sciences of Ukraine) 1 (1998) 121–134.
- [51] L. Francis, J.-M. Friedt, C. Zhou, P. Bertrand, In situ evaluation of density, viscosity and thickness of adsorbed soft layers by combined surface acoustic wave and surface plasmon resonance, Analytical Chemistry 78 (12) (2006) 4200–4209.
- [52] J.-M. Friedt, L. Francis, G. Reekmans, R. D. Palma, A. Campitelli, U. Sleytr, Simultaneous surface acoustic wave and surface plasmon resonance measurements: electrodeposition and biological interactions monitoring, J. Appl. Phys. 95 (4) (2004) 1677–1680.
- [53] K. Saha, F. Bender, A. Rasmusson, E. Gizeli, Probing the viscoelasticity and mass of a surface-bound protein layer with an acoustic waveguide device, Langmuir 19 (4) (2003) 1304–1311.
- [54] J.-M. Friedt, K. Choi, F. Frederix, A. Campitelli, Simultaneous atomic force microscope and quartz crystal microbalance measurements: Methodology validation using electrodeposition, J. Electrochem. Soc. 150 (2003) H229–H234.
- [55] J.-M. Friedt, L. Francis, K. Choi, A. Campitelli, Combined atomic force microscope and acoustic wave devices: Application to electrodeposition, J. Vac. Sci. Technol. A 21 (2003) 1500–1505.
- [56] L. Francis, J.-M. Friedt, C. Bartic, A. Campitelli, A SU8 liquid cell for surface acoustic waves biosensors, in: SPIE Photonics Europe, Strasbourg (France), 2004, pp. 353–363.
- [57] M. Puiu, A.-M. Gurban, L. Rotariu, S. Brajnicov, C. Viespe, C. Bala, Enhanced sensitive love wave surface acoustic wave sensor designed for immunoassay formats, Sensors 15 (5) (2015) 10511––10525.
- [58] K. Eskilsson, V. Yaminsky, Deposition of monolayers by retraction from solution: ellipsometric study of cetyltrimethylammonium bromide adsorption at silica-air and silica-water interfaces, Langmuir 14 (1998) 2444–2450.
- [59] P. Grossel, J.-M. Vigoureux, F. Baïda, Nonlocal approach to scattering in a one-dimensional problem, Phys. Rev. A 50 (5) (1994) 3627–3637.
- [60] A. Ulman, An introduction to ultrathin organic films (from Langmuir-Blodgett to Self Assembly), Academic Press Inc.: San Diego, 1991.
- [61] F. Kardous, L. E. Fissi, J.-M. Friedt, F. Bastien, W. Boireau, R. Yahiaoui, J.-F. Manceau, S. Ballandras, Integrated active mixing and biosensing using low frequency vibrating mixer and Love-wave sensor for real time detection of antibody binding event, Journal of Applied Physics 109 (2011) 094701.
- [62] E. Palik, Handbook of optical constants of solids, Academic Press Inc.: New York, 1997.
- [63] F. Höök, J. Vörös, M. Rodahl, R. Kurrat, P. Böni, J. Ramsden, M. Textor, N. Spencer, P. Tengvall, J. Gold, B. Kasemo, A comparative study of protein adsorption on titanium oxide using in situ ellipsometry, optical waveguide lightmode spectroscopy, and quartz crystal microbalance/dissipation, Colloids and Surfaces B 24 (2002) 155–170.
- [64] R. Marsch, R. Jones, M. Sferrazza, Adsorption and displacement of a globular protein on hydrophilic and hydrophobic surfaces, Colloids and Surfaces B 23 (2002) 31–42.
- [65] U. Kreibig, M. Vollmer, Optical Properties of Metal Clusters, Springer Series in Material Science (Springer-Verlag: New York), 1995.
- [66] F. Caruso, D. Furlong, K. Ariga, I. Ichinose, T. Kunitake, Characterization of polyelectrolyte-protein multilayer films by atomic force microscopy, scanning electron microscopy, and fourier transform infrared reflection-absorption spectroscopy, Langmuir 14 (1998) 4559–4565.
- [67] L. E. Fissi, J.-M. Friedt, S. Ballandras, L. Robert, F. Chérioux, Acoustic characterization of thin polymer layers for love mode surface acoustic waveguide, in: IEEE International Frequency Control Symposium, Honolulu, USA, 2008, pp. 711–716.