Investigation of Heterodiffusion in Molecular Crystals by the Method of Raman Effect
Abstract
Using a method of a Raman effect of light the heterodiffusion in molecular crystals is investigated by the example of p-dichlorobenzene in a p-dibromobenzene. The installation diagram and a procedure of a determination of diffusivities using this method is given. Changes of diffusivities in a cut of a crystal perpendicularly to a direction of diffusion are found. Obtained values of diffusivities are in good agreement with those obtained by other methods.
pacs:
78.30.J, 78.30, 66.30.L, 61.72Perspectives of use of organic crystals of a low symmetry in the molecular electronics engineering for recording and information processing are mentioned ref1 . For reading recorded information, it is possible to use the laser. Molecular crystals have rather low melting point and such exposure of crystals by a laser beam can lift temperature of a sample close to melting point that will affect magnification of diffusion of molecules of impurity and durability of recorded information. Therefore it is actual to investigate diffusion in molecular crystals. As against processes of diffusion in inorganic materials, diffusion in molecular crystals has the singularities. The difficulties originating at investigation of migration of molecules are in particular connected with nonsphericity of molecules, presence of orientation oscillations, deficiencies, etc., that distinguishes them from inorganic systems.
In order to investigate the process of diffusion various methods are used (chemical, metallographic and physical ref2 ) which majority at the quantitative investigation of this process determines concentration of impurity in a sample on different depth after its ageing at fixed temperature for a long time. At that, the average value of impurity concentration throughout the entire plane of a crystal cut perpendicular to a direction of diffusion is determined frequently. Similar methods were used and at investigation of molecular crystals ref3 . More precise is the method the local X-ray spectral analysis used for investigation of metals and alloys ref4 .
The purpose of the present work is to consider a possibility of use of the method of Raman Effect of light (RE) for investigation of impurity heterodiffusion in a monocrystal, grown by Bridgman’s method.
By the method of a Raman Effect it is possible to determine concentration of impurity as along a direction of diffusion as perpendicular to this direction, that enables to investigate a heterodiffusion in molecular crystals. Moreover, this method allows to judge by spectrums of the lattice and intramolecular oscillations about a character of a disposition of impurity molecules among molecules of the base crystal. In particular, from Raman spectra one can determine whether the solid solution is formed by the substitution (i), or interstitial (ii), or the impurity molecules are concentrated at the boundaries between the blocks of the single-crystal lattice (iii) or the solid solution is the mechanical mixture of the substances (iv).
The monocrystal placed in installation which diagram is shown in figure 1. This installation allows to obtain a spectrum of the RE from area on a surface of a crystal irradiated with the focused laser beam.
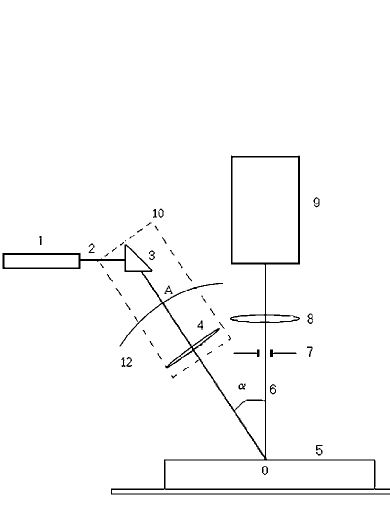
The installation diagram in figure 1 consist of He-Ne laser (1) which ray (2), transited through a prism, that rotates it (3), and a lens (4), then focalized on a surface of investigated sample (5). Radiation of a crystal (6), transited through a diaphragm (7) and a lens (8), hits on a slit of a spectrograph (9). By changing incidence angle of a laser beam on a sample in a point the best ratio signal/noise was found. Rotational on radius was carried out by a system lens-prism (10). The sample was on a table (11) which was moved by the micrometer screw that allowed to carry out recording of spectrums while moving a sample on small distances. The diaphragm (7) is used for a cut of a laser ray reflected from a point .
Because the diameter of a stain of laser beam can be reduced on the surfaces of a crystal up to ( stands for micrometer) this method allows to investigate concentration of components along a direction of diffusion.
As subjects of inquiry the substances well investigated by various methods have been chosen. As the base monocrystal the p-dibromobenzene and as diffusing impurity the p-dichlorobenzene has been chosen. A p-dibromobenzene (measured melting point and p-dichlorobenzene (. P-dichlorobenzene (-modification) and isomorphous to it p-dibromobenzene are investigated by optical, radiographic and NQR methods ref5 ; ref6 ; ref7 . Both substances are crystallizes in space group with two molecules in a unit cell and forms a mixed crystals of substitution at any concentrations of components (this could be determined as by the phase diagram, as by spectrums of the RE ref6 ). Spectrums of the lattice oscillations are similar to spectrums of components. Monocrystals are pellucid, that allows obtaining Raman spectrums of high quality.
Before investigation of diffusion of p-dichlorobenzene in a p-dibromobenzene, the monocrystals of solid solutions of investigated substances have been grown and spectrums of a Raman Effect are obtained in the range of the lattice and intramolecular oscillations (up to . In present paper the concentration of components was measured in molar unities.
First, spectrums of standard samples with the given relation and have been obtained. There is well defined line at frequency in a spectrum of the lattice oscillations of a p-dibromobenzene. In a spectrum of a mixed crystal the frequency monotonically varies depending on concentration of components. This dependence is presented in work ref8 . This allows determining of concentration of impurity (p-dichlorobenzene) in investigated solid solutions by the value of frequency. The value of frequency was determined with accuracy .
If in a spectrum of the lattice oscillations there is separately located and well defined line then in order to determine concentration of impurity it is possible to use a method described above. However, lines in a spectrum are frequently so disposed that it is very difficult to isolate the separately located line. Then the magnitude of concentration of impurity can be determined on relative intensity of the valent intramolecular oscillations. According to work ref9 , the line in a spectrum of the RE with matches to valence vibration of , and a line with in matches to valence vibration of . In figure 2 spectrums of the intramolecular oscillations (in range of frequencies of p-dibromobenzene (1), p-dichlorobenzene (2) and an investigated mixed crystal at of p-dichlorobenzene (3) are presented.
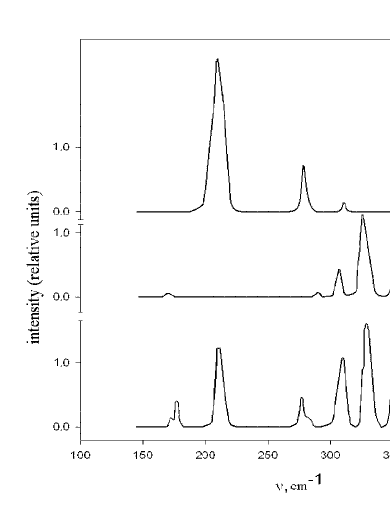
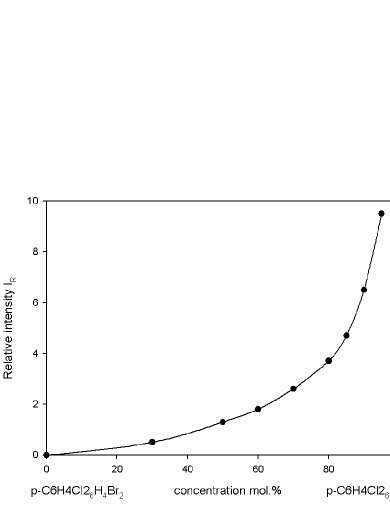
Apparently, the spectrum of a mixed crystal is a superposition of spectrums of the intramolecular oscillations of components with account for their concentration. In figure 3 the graph of dependence of relative intensity of a line with frequency to a line with frequency from concentration of components is presented. With use of these graphs it was possible to determine concentration of p-dichlorobenzene in a p-dibromobenzene. In greater detail the method of determination of components concentration in a mixed crystal with use of the RE is described in work ref8 .
Then the monocrystal of a p-dibromobenzene by the Bridgman’s method has been grown. The monocrystal was grown in a glass tube with a diameter and with a length with the drawn end in which seated beforehand purified by a method of zone melting a p-dibromobenzene. From a tube the air was pumped out and the tube was soldered. The ampoule with substance was sinking from the hot to a cold zone of the heater with velocity . The lapse rate of temperature of the heater was set by various coiling of a heating coil and was . Monocrystallinity of a sample was tested with use of a polarized-light microscope. The parallelepiped was cut out from this monocrystal ( and on one of which least edges the layer of p-dichlorobenzene with thickness was applied. After that the sample was annealed at temperature during 360 hours.
To exclude surface effects and to investigate diffusion in depth of a sample from one of the edges the layer of a sample by thickness collateral to a direction of diffusion has been cut off. The sample was put in installation, which diagram is presented in figure 1, and the recording of spectrums was carried out. Spectrums are obtained in three points located at from boundary parting p-dichlorobenzene and a p-dibromobenzene along a direction of diffusion. At that the concentration of p-dichlorobenzene (determined using method described above) is , and , where lower index designates distance in from boundary. Apparently, the used monocrystal can be considered as semi-infinite body (in comparison with penetration depth of impurity during diffusion) and consequently use the following relation for a determination of a diffusivity , where ref10 , is the concentration of impurity located at from boundary, is the initial concentration of impurity, is the time of annealing, is the diffusivity.
It is found that the diffusivity is , , and average value is .
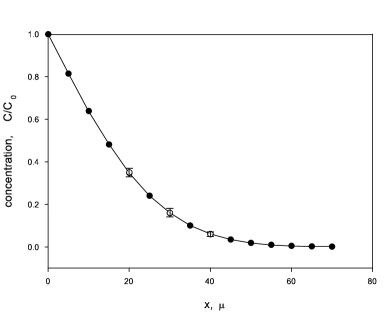
In figure 4 the calculated dependence of p-dichlorobenzene concentration on depth of penetration in a monocrystal of a p-dibromobenzene for the obtained average value of diffusivity is presented. Concentration was calculated with use of above-stated formulas. In the figure the circles () marks the experimental averaged values of concentration. Evidently, experimental values are in very good agreement with calculated concentrations.
Obtained values of diffusivity are in good agreement with the data obtained on other molecular crystals by other methods ref11 ; ref12 . In work ref11 it is mentioned, that magnitude of a diffusivity strongly depends on a degree of clearing of substance, for example for naphthalene, from to .
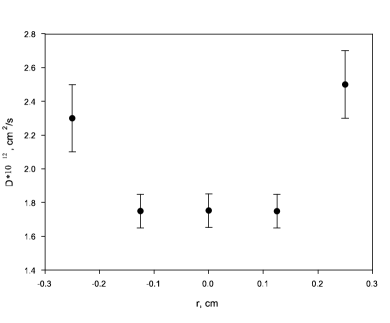
Then, using procedure given above, the diffusivity in a sample perpendicularly to a direction of diffusion at about from boundary was measured. With this purpose on this distance the collateral layer of a crystal perpendicularly to a direction of diffusion has been cut off. Spectrums are obtained in five points on centerline of this sample perpendicularly to a direction of diffusion. The values of diffusivities found from experiments are marked by circles in figure 5. Evidently, to edges of a crystal these values increase.
Thus, using a method of a Raman Effect of light and the above-stated procedure it is possible to carry out investigations of a heterodiffusion in molecular crystals. Values of diffusivities obtained in this paper are in good agreement with given obtained by other methods on molecular crystals.
References
- (1) Novie phisicheskie principy obrabotki informatcii [New physical principles of optical information processing (USSR)], edited by S.A. Ahamanov and M.A. Vorontsov (Nauka, Moscow, 1990)
- (2) S.D. Hertsriken and I.A. Dekhtyar, in Diffusiya v metallah i splavah v tverdoy phase [Diffusion in metals and alloys in solid state (USSR)], (Gosudarstvennoe izdatelstvo phys.-mat. Literatury, Moscow, 1960)
- (3) J.N. Sherwood, Mol.Cryst.Liq.Cryst. 9, 37 (1986)
- (4) K.P. Gurov, B.A. Kartashkin, Yu.E. Ugaste, in Vzaimnaya diffusiya v mogofaznyh metallicheskih sistemah [Mutual diffusion in multiphase metallic systems (USSR)], (Nauka, Moscow, 1981)
- (5) A.I. Kitaigorodskii, in Organicheskaya kristallokhimiya [Organic crystallochemistry (USSR)], (Izdatelstvo AN SSSR, Moscow, 1955)
- (6) V.F. Shabanov, V.P. Spiridonov, M.A. Korshunov, Zh. Prikl. Spektrosk. [J. Appl. Spectrosc. (USSR)] 25, 698 (1976)
- (7) V.S. Grechishkin, in Yadernyie kvadrupolnyie vzaimodeystviya v tverdyh telah [Nuclear quadruple interactions in solids (USSR)], (Nauka, Moscow, 1973)
- (8) M.A. Korshunov, Kristallografiya [Sov.Phys.-Crystallogr.] 48, 531 (2003)
- (9) M. Suzuki, M. Ito, Spectrochim. Acta 25A, 1017 (1969)
- (10) J.P. Stark, in Solid State Diffusion, (John Wiley & Sons, New York, 1976)
- (11) J.N. Sherwood, D.J. White, Phil. Mag. 15, 745 (1967)
- (12) L. Bonpunt, A. Dautant, A. Loumaid, Y. Haget, Mol. Cryst. Liq. Cryst. 137, 213 (1986)