Close-Packing of Clusters: Application to Al100
Abstract
The lowest energy configurations of close-packed clusters up to atoms with stacking faults are studied using the Monte Carlo method with a Metropolis algorithm. Two types of contact interactions, a pair-potential and a many-atom interaction, are used. Enhanced stability is shown for , 26, 38, 50, 59, 61, 68, 75, 79, 86, 100 and 102, of which only the sizes 38, 75, 79, 86, and 102 are pure FCC clusters, the others having stacking faults. A connection between the model potential and density functional calculations is studied in the case of Al100. The density functional calculations are consistent with the experimental fact that there exist epitaxially grown FCC clusters starting from relatively small cluster sizes. Calculations also show that several other close-packed motifs exist with comparable total energies.
I Introduction
Formation of atomic clusters can lead to close-packed (CP) structures under some conditions. The shape of such clusters is determined by the balance of surface area, surface energy, and internal strain. In small metal clusters also the self-deformation of the valence electron density can play an important role. Other common packing patterns in clusters include often icosahedral and decahedral motifs with internal twin boundaries.martin96 Metals such as Na, Mg and Cu show icosahedral magic numbers.martin96 ; reinhard97 The motivation to study FCC and other close-packed clusters is the fact that some elements, for example Al, are found to form FCC clusters of octahedral shape.martin92 Moreover, at certain cluster sizes pair potentials (e.g. Lennard-Jones) also yield FCC-based structures as the most stable isomers.
Generally, the search for the lowest energy isomer of a cluster is a difficult problem due to the vast number of isomers which correspond to local minima on a complex potential energy surface. The energy differences between the isomers are caused by the surface energy,Wul01 strain energy due to structural defects such as twin boundaries,Ino69 and in metals also the electronic shell structure.hakkinen97 For example, if one uses classical or ab initio molecular dynamics (MD) one usually needs an appropriate initial configuration in order to save computation time. hakkinen95 ; rytkonen00 ; kumar91 ; delaly92 ; akola99 One purpose of this work is to apply the Monte Carlo method to look for the most stable isomers of hard sphere clusters, to be used as starting geometries for MD simulations.
Classical molecular dynamics have been extensively used to study the lowest energy structures of small clusters. However, finding the correct ground state geometry of a small cluster () is a difficult optimization task even with classical pair potentials.Wil85 For historical reasons, the Lennard-Jones potential is the best studied,Hoa83 ; doye98 ; doye99 ; leary99 but other pair potentialsdoye01b ; doye00 ; doye01 as well as many-atom potentialsbaletto00 ; baletto02 ; valkealahti92 ; cleveland97 have been used. Nearly all give an icosahedral geometry for the 13 and 55 atom clusters. The behavior of the binding energy as a function of cluster size is, however, quite different for different potentials. While is seen as an exceptionally stable size, the second complete icosahedron () is not a clear local minimum for most of the potentials studied. For example, the 38 atom FCC structure (Wulff’s polyhedron) depends less on the model potential than does the 55 icosahedron.
In this article, we present results for the lowest energy isomers of close-packed clusters in the size range . Our model, which uses the hard sphere packing as a starting point, does not include icosahedral and decahedral motifs as well as any other structures with varying bond lengths and angles. This makes our approach extremely efficient in finding lowest energy structures of CP clusters. The cluster energy is determined using either a pairwise nearest neighbor interaction or a many-atom potential based on the tight-binding model. For many sizes, the lowest energy structure found includes stacking faults, making the cluster a mixture of FCC and HCP phases.
For a cluster with 100 aluminum atoms we use a density functional (DF) method to relax the atomic positions of the low energy isomers obtained with the simple model. Our goal is to study the applicability of our classical energy expression in a realistic cluster, where the true electronic structure is present. The cluster size is particularly interesting because the experimental photoelectron spectrum of the anion has a large energy gap between the highest and lower-lying occupied orbitals.Wang98 Our calculations show that many of the low energy isomers have such an energy gap, but the absolute value of the theoretical gap is still smaller than the experimental result.
The plan of this article is the following. In Section 2, the theoretical hard sphere model and the DF method used are outlined. The results for the lowest energy structures of the close-packed clusters and their relations to the cluster shapes are presented in Section 3, and the DF calculations for Al100 and the corresponding photoelectron spectra are presented in Section 4. The conclusions are given in Section 5.
II Simulation methods
II.1 Monte Carlo method for hard sphere clusters
The lowest energy geometries of hard sphere clusters are computed using the Monte Carlo (MC) method with a Metropolis algorithm. This is described in our earlier work where the role of stacking faults in small hard sphere clusters was studied.kmanninen02 Similar algorithm was earlier used by Akola et al. for making pure FCC clusters.akola00 A dense lattice is generated inside a spherical volume in such a way that atoms occupying these lattice sites can form an FCC or HCP lattice or any combination of these two, including stacking faults in all possible directions. The lattice sites are then randomly populated with atoms, such that the minimum distance between any atom pair is twice the hard sphere radius, i.e., the nearest neighbor distance in the FCC lattice. After this, a Monte Carlo procedure is used together with the cluster binding energy to change the lattice site occupations leading to a “clustering” of atoms. The simulation is started at a high temperature that is gradually decreased to zero to obtain the low energy isomers. This optimization procedure, including millions of steps, is repeated typically at least 1000 times for each cluster size. During the optimization, we record not only the most stable geometry but also many other low energy isomers.
Two simple models, a pair-potential (PP) and a tight-binding based potential (TB), are used as a contact interaction between the hard spheres. In the former the energy is calculated as
| (1) |
where is the coordination number of the atom and is the strength of the interaction ( determines the energy scale) and is the total number of bonds (contacts between the hard spheres). The second model is derived from tight-binding theory,gupta81 ; finnis84 and it has a simple square root dependence on the coordination number
| (2) |
In practice, Eq.(2) has shown to be a good approximation for the true TB energy of small clusters.hakkinen91 Nevertheless, this model cannot describe effects related to the details of the electronic structure, such as Jahn-Teller deformation, and the geometries obtained from Eq.(2) should not be confused with the most stable geometries determined with the true tight-binding method.wang87 ; yoshida94
The Monte Carlo simulations are performed using the PP model energy expression Eq.(1), which leads in many cases to several different geometries with the same energy. The TB interaction is more practicable here, since it is more sensitive in separating the energy of different isomers. In most cases, it removes the degeneracy of lowest energy isomers of the PP model. The TB model favors geometries where each atom has a similar coordination, whereas the PP model is insensitive to the bond distribution.
II.2 Electronic structure calculations
The DF calculations of Al100 isomers are performed using the Car-Parrinello molecular dynamics (CPMD) code,CPMD where the electron-ion interaction is described by an ionic pseudopotential, TM91 and the generalized gradient correction approximation of Perdew, Burke, and Ernzerhof (PBE) is applied to the exchange correlation energy of the electron density.PBE96 The basis set is taken to be plane waves with a cut-off energy of 15.4 Ry. In contrast to many Car-Parrinello simulations, we do not enforce periodicity in the system, i.e., calculations are performed in an isolated cubic box of 25.4 Å. We also do not employ the Car-Parrinello algorithm for the coupling of ionic and electronic solutions during geometry optimization, and the electronic Hamiltonian is rediagonalized after each geometry optimization step. The metal clusters studied show systematically small energy gaps between the occupied and unoccupied molecular orbitals (HOMO-LUMO gaps). In order to converge the electron density, a finite temperature functional ( K) is used for the the Kohn-Sham (KS) orbital occupancies. The ionic positions are optimized according to a conjugate gradient method until all the nuclear gradient components are below au.
III Results
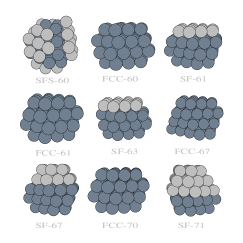
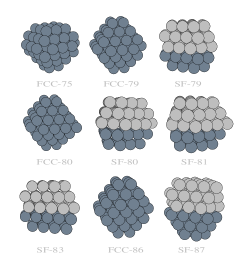
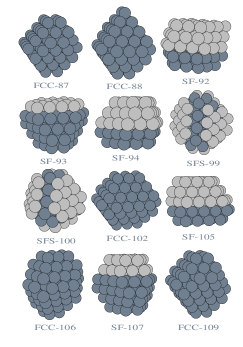
III.1 Lowest energy geometries of the hard sphere clusters
Tables 1, 2, 3, and 4 give the energies of the lowest energy isomers found with the PP and TB potentials. For each size, we show the energy of the most stable FCC isomer together with the lowest energy isomer with one or more stacking faults (SF). In addition, the occupation numbers of parallel (111) layers in the FCC isomer are also shown (this is not done for the SF clusters, since these cannot generally be described by parallel (111) layers). Examples of the isomers obtained are shown in Figures 1, 2, and 3. The results for the most stable isomers of small clusters agree with those published earlier, kmanninen02 except for some TB energies. The lowest energy structures obtained using the PP model are similar to the results by Doye and Wales doye95 except for , 49, 50, 51, 68, 69, 82, 107, and 108, where we have found a more stable geometry (for 33, 49, 51, 69, 82, 107 our results have one additional bond, for 50, 68, 108 two bonds more than those of Doye and Wales).
| layers | |||||
|---|---|---|---|---|---|
| 4 | 6 | (3,1) | -3.464 | ||
| 5 | 8 | 9 | (4,1) | -4.439 | -4.732 |
| 6 | 12 | 12 | (3,3) | -6.000 | -5.968 |
| 7 | 15 | 15 | (4,3) | -7.220 | -7.180 |
| 8 | 18 | 18 | (5,3) | -8.429 | -8.434 |
| 9 | 21 | 21 | (5,4) | -9.650 | -9.650 |
| 10 | 25 | 25 | (5,5) | -11.118 | -11.107 |
| 11 | 28 | 29 | (6,5) | -12.327 | -12.532 |
| 12 | 32 | 33 | (7,5) | -13.745 | -13.951 |
| 13 | 36 | 36 | (7,6) | -15.177 | -15.148 |
| 14 | 40 | 40 | (4,7,3) | -16.575 | -16.581 |
| 15 | 44 | 44 | (4,7,4) | -18.002 | -18.000 |
| 16 | 48 | 48 | (6,7,3) | -19.403 | -19.420 |
| 17 | 52 | 52 | (5,7,5) | -20.822 | -20.822 |
| 18 | 56 | 56 | (6,7,5) | -22.214 | -22.240 |
| 19 | 60 | 60 | (7,8,4) | -23.643 | -23.643 |
| 20 | 64 | 64 | (7,8,5) | -25.053 | -25.053 |
| 21 | 68 | 68 | (8,8,5) | -26.454 | -26.460 |
| 22 | 72 | 72 | (8,8,6) | -27.852 | -27.863 |
| 23 | 76 | 76 | (7,10,6) | -29.262 | -29.276 |
| 24 | 81 | 81 | (7,10,7) | -30.869 | -30.847 |
| 25 | 85 | 85 | (8,10,7) | -32.270 | -32.270 |
| 26 | 89 | 90 | (9,10,7) | -33.671 | -33.844 |
| 27 | 93 | 94 | (9,10,8) | -35.064 | -35.254 |
| 28 | 97 | 98 | (8,12,8) | -36.471 | -36.671 |
| 29 | 102 | 102 | (10,12,7) | -38.070 | -38.075 |
| 30 | 106 | 106 | (11,12,7) | -39.471 | -39.477 |
| 31 | 111 | 111 | (12,12,7) | -41.070 | -41.065 |
| 32 | 115 | 115 | (12,12,8) | -42.462 | -42.458 |
| 33 | 119 | 120 | (12,12,9) | -43.855 | -44.045 |
| 34 | 124 | 124 | (9,12,9,4) | -45.434 | -45.441 |
| 35 | 128 | 129 | (7,12,11,5) | -46.816 | -47.045 |
| 36 | 133 | 133 | (7,12,12,5) | -48.410 | -48.437 |
| 37 | 138 | 138 | (7,12,11,7) | -49.996 | -50.003 |
| 38 | 144 | (7,12,12,7) | -51.786 | ||
| 39 | 148 | (8,12,12,7) | -53.179 | ||
| 40 | 152 | (9,12,12,7) | -54.571 |
The total number of bonds in the most stable geometry is the same in both the PP and TB models for all . The difference between the two energy formulas appears only in separation between different isomers with the same number of bonds. For each cluster size we have determined the lowest energy FCC geometry, but the most stable geometry with at least one stacking fault is determined only for those clusters where a stacking fault does not decrease the number of bonds (as in the sizes 4, 38, 39, 40, 86, 88, 102, 104). For the other sizes (see Tables I-IV), the TB model gives lower energies for SF structures in many cases. A detailed discussion of the structure evolution of small hard sphere clusters has been given earlier,kmanninen02 and we concentrate on clusters with more than 60 atoms in the following.
| layers | |||||
|---|---|---|---|---|---|
| 41 | 156 | 156 | (8,14,12,7) | -55.964 | -55.974 |
| 42 | 160 | 160 | (8,14,13,7) | -57.360 | -57.388 |
| 43 | 165 | 165 | (8,14,13,8) | -58.961 | -58.972 |
| 44 | 169 | 169 | (11,14,12,7) | -60.349 | -60.365 |
| 45 | 174 | 174 | (10,14,13,8) | -61.953 | -61.964 |
| 46 | 178 | 178 | (11,14,13,8) | -63.345 | -63.350 |
| 47 | 183 | 183 | (12,14,13,8) | -64.936 | -64.933 |
| 48 | 187 | 187 | (10,16,14,8) | -66.308 | -66.342 |
| 49 | 191 | 192 | (10,16,14,9) | -67.701 | -67.933 |
| 50 | 196 | 198 | (10,16,16,8) | -69.284 | -69.663 |
| 51 | 201 | 202 | (10,16,16,9) | -70.870 | -71.056 |
| 52 | 207 | 207 | (10,16,16,10) | -72.652 | -72.638 |
| 53 | 211 | 211 | (11,16,16,10) | -74.044 | -74.023 |
| 54 | 216 | 216 | (12,16,16,10) | -75.635 | -75.625 |
| 55 | 220 | 220 | (12,16,16,11) | -77.027 | -77.004 |
| 56 | 225 | 225 | (12,16,16,12) | -78.617 | -78.608 |
| 57 | 229 | 229 | (13,16,16,12) | -80.010 | -79.987 |
| 58 | 233 | 234 | (13,19,16,10) | -81.360 | -81.587 |
| 59 | 238 | 240 | (12,18,17,12) | -82.977 | -83.272 |
| 60 | 243 | 244 | (12,18,19,11) | -84.535 | -84.651 |
| layers | |||||
|---|---|---|---|---|---|
| 61 | 249 | 249 | (12,19,18,12) | -86.316 | -86.333 |
| 62 | 253 | 253 | (12,19,18,13) | -87.709 | -87.726 |
| 63 | 258 | 258 | (14,19,18,12) | -89.299 | -89.306 |
| 64 | 262 | 262 | (13,18,19,14) | -90.692 | -90.698 |
| 65 | 267 | 267 | (12,18,19,16) | -92.285 | -92.285 |
| 66 | 271 | 271 | (13,18,19,16) | -93.675 | -93.681 |
| 67 | 276 | 276 | (12,18,19,18) | -95.265 | -95.232 |
| 68 | 282 | 282 | (7,12,18,19,12) | -96.981 | -96.998 |
| 69 | 286 | 286 | (12,19,18,13,7) | -98.360 | -98.390 |
| 70 | 291 | 291 | (14,21,21,14) | -99.981 | -99.981 |
| 71 | 296 | 296 | (9,16,21,16,9) | -101.542 | -101.548 |
| 72 | 300 | 300 | (16,21,21,14) | -102.964 | -102.953 |
| 73 | 305 | 305 | (12,18,19,15,9) | -104.501 | -104.514 |
| 74 | 310 | 310 | (10,16,18,18,12) | -106.087 | -106.085 |
| 75 | 316 | 316 | (12,18,19,16,10) | -107.860 | -107.856 |
| 76 | 320 | 320 | (11,16,19,18,12) | -109.252 | -109.248 |
| 77 | 325 | 325 | (12,18,19,18,10) | -110.819 | -110.818 |
| 78 | 330 | 330 | (11,18,19,18,12) | -112.396 | -112.387 |
| 79 | 336 | 336 | (12,18,19,18,12) | -114.177 | -114.163 |
| 80 | 340 | 340 | (12,18,19,18,13) | -115.570 | -115.528 |
Clusters with , 59, and 60 are based on a truncated 31-atom tetrahedron with all four overlayers in stacking fault locations. We denote such isomers with tetrahedral symmetry as SFS (see also ). Both the PP and TB models give a large energy difference between the most stable FCC geometry and the SFS lowest energy isomer. For , the clusters consist mainly of four (111) layers, three of them being in an FCC arrangement and the fourth being either FCC or HCP. For each size, the most stable FCC and SF structures have the same number of atoms in the layers. The lowest energy SF structure of resembles closely an HCP cluster. It consists of five layers, four of them forming an HCP-lattice and the fifth in a stacking fault position (layer-packing ABABC, which can be seen as two connected FCC subunits). SF clusters with , 69, and 73 have similar structures, whereas the cluster sizes 70, 72 and 74 atoms show four parallel FCC layers, and the fifth layer is displaced in a stacking fault position. The lowest energy structure of 71 atoms consists of two FCC subdomains (layer-packing ABCBA).
In the size range 75–80, the lowest energy isomers are FCC structures according to the TB potential with a very small energy difference to SF structures. This applies also for , where the FCC construction gives a complete truncated octahedron (TO). The corresponding SF isomer (two FCC units connected) also has large (111) facets, which explains the low energy. Similar kinds of SF clusters with a stacking fault layer inside the cluster are found in , and 94, while , 83, and 92 are better than FCC for both potentials. The clusters with 86 and 88 atoms have a nondegenerate FCC energy minimum in the PP model. These isomers are based on the FCC-79 with one (111) overlayer. For , the FCC structure is still lower in TB energy, but there are SF structures with the same number of bonds (PP energy). The lowest energy isomers of and 95 consist of four FCC layers, with the fifth being in HCP position (with respect to the two lower layers). The clusters with atoms do not have stacking faults according to the TB model.
| layers | |||||
|---|---|---|---|---|---|
| 81 | 344 | 345 | (13,18,19,18,13) | -116.962 | -117.126 |
| 82 | 349 | 349 | (10,16,21,21,14) | -118.524 | -118.535 |
| 83 | 353 | 354 | (13,18,21,19,12) | -119.917 | -120.126 |
| 84 | 358 | 358 | (12,21,21,18,12) | -121.483 | -121.518 |
| 85 | 363 | 363 | (12,18,21,20,14) | -123.069 | -123.108 |
| 86 | 369 | (12,18,21,21,14) | -124.842 | ||
| 87 | 373 | 373 | (15,21,21,18,12) | -126.235 | -126.221 |
| 88 | 378 | (13,19,21,21,14) | -127.825 | ||
| 89 | 382 | 382 | (16,21,21,18,13) | -129.218 | -129.204 |
| 90 | 387 | 387 | (12,19,24,21,14) | -130.741 | -130.773 |
| 91 | 391 | 391 | (12,18,23,23,15) | -132.165 | -132.169 |
| 92 | 396 | 397 | (12,19,24,22,15) | -133.717 | -133.902 |
| 93 | 402 | 402 | (12,18,23,24,16) | -135.507 | -135.529 |
| 94 | 407 | 407 | (16,23,24,19,12) | -137.067 | -137.069 |
| 95 | 411 | 411 | (13,19,23,24,16) | -138.490 | -138.502 |
| 96 | 416 | 416 | (19,24,23,18,12) | -140.069 | -140.052 |
| 97 | 421 | 421 | (16,23,24,21,13) | -141.621 | -141.611 |
| 98 | 427 | 427 | (16,23,24,21,14) | -143.385 | -143.377 |
| 99 | 431 | 432 | (16,23,24,21,15) | -144.764 | -144.846 |
| 100 | 436 | 438 | (16,23,24,24,15) | -146.362 | -146.614 |
| 101 | 441 | 441 | (16,23,24,23,15) | -147.930 | -147.754 |
| 102 | 447 | (16,23,24,23,16) | -149.703 | ||
| 103 | 451 | 451 | (16,23,24,23,17) | -151.096 | -151.052 |
| 104 | 456 | (18,23,24,23,16) | -152.686 | ||
| 105 | 460 | 461 | (18,26.26,21,14) | -154.050 | -154.245 |
| 106 | 465 | 465 | (16,24,27,23,16) | -155.611 | -155.578 |
| 107 | 470 | 470 | (19,27,27,21,13) | -157.164 | -157.169 |
| 108 | 476 | 476 | (19,27,27,21,14) | -158.928 | -158.934 |
| 109 | 480 | 480 | (16,23,26,26,18) | -160.368 | -160.315 |
| 110 | 485 | 485 | (16,24,17,25,18) | -161.928 | -161.917 |
The most stable isomers for 99 or 100 atoms have an SFS structure based on a truncated FCC tetrahedron with stacking faults at each of the four surfaces. The 100 atom cluster has the same structural motif as SFS-59, whereas in the case of 99 (101) atoms, one surface atom is removed (added). The lowest-lying TB geometries for , , 109, and 110 are FCC structures with five (111) layers. They all are related to FCC-102, which is an elongated TO having a full atom shell (similar to FCC-52). Clusters with , 107 and 108 prefer stacking faults in the TB model, and SF-105 has the largest number of bonds in its class.
III.2 Magic numbers
The most stable cluster sizes (magic numbers) reflect the stability of the cluster with respect to the neighboring sizes. In order to see also the possible regions of increased stability, it is convenient to subtract a smooth size dependence from the energy. This can be obtained by fitting the total energies to a “mass formula” , where and are fitting parameters and is the cohesion energy of the model in question ( for the PP model and for the TB model).Wei35 ; Per91 Figure 4 shows the deviation of energy from this function. Clusters with , 26, 38, 50, 59, 61, 68, 75, 79, 86, 100, and 102 are the most pronounced local minima, but there are several weaker local minima, and the results show odd-even alternation in some regions. However, since this behavior is not of electronic origin,manninen94 the minima can be for even (around 38) or odd (around 61).
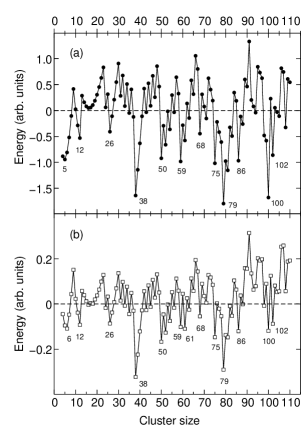
The general profile of the energy curve is related to the total number of bonds. This is natural in our model which totally neglects the internal strain. In all cases, the lowest PP and TB structures have the same number of bonds and qualitatively similar energy curves. Note that from the magic sizes only those with 38, 75, 79, 86, and 102 atoms are pure FCC clusters, while others have stacking faults. Doye and Wales have used a pair-wise Morse potential in the size range to study the effect of potential range on the magic numbers.doye97 For the hardest potential studied, they found magic numbers 26, 38, 50, 55, 59, 61, 68, and 79, which are present in our results except the size 55, which is an icosahedron. These results seem to indicate that the internal strain is not important in clusters which do not have twin boundaries.
III.3 Moments of inertia
The overall shape of clusters is studied by calculating the three moments of inertia for the principal axis, and the normalized average moment of inertia
| (3) |
where is the atom position and the center of mass (in units of the FCC lattice constant). The factor is chosen because the moment of inertia is proportional to for a spherical cluster. The normalized moments of inertia are shown in Figure 5(a), and the similarity between Figures 4 and 5(a) is obvious. The minima in moments of inertia are present also in the energy curve except for , 19, and 107.
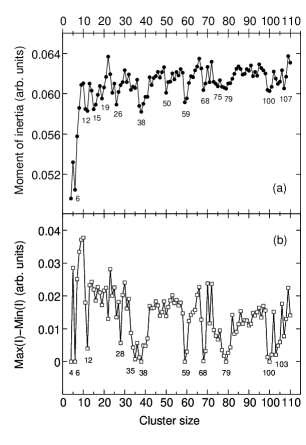
It is also interesting to resolve the cluster deformation on the basis of moments of inertia, since for a sphere (or a cube, etc.) all the principal components of inertia are equal. Figure 5(b) shows the difference of the maximum and minimum components as a function of cluster size. Many of the magic clusters (, 59, 68, 79, 100) have high symmetry, but some, e.g. 50, 86, and 102 have a marked deformation. The large (111) facets compensate the increase in surface area (deformation) in such cases.
III.4 Electronic structure calculations of Al100 isomers
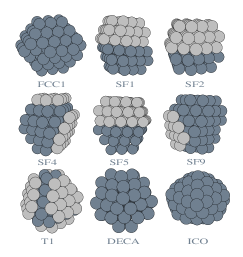
In order to test the applicability of our classical energy expressions for Al clusters we have chosen an MC-generated test set of 15 low energy isomers for together with the corresponding icosahedral and decahedral isomers, which we optimized using the DF method. The results for total energies, bond lengths, deformation, and HOMO-LUMO gaps () of KS orbitals are presented in Table 5. The corresponding cluster geometries are shown in Figure 6. The FCC isomers are all based on the same structural motif, which leads to a full atomic shell of an elongated TO at cluster size 102 (notice the two missing atoms in Figure 6). The higher degree of freedom in the case of clusters with stacking faults results in a variety of different structures. Among the 11 different geometries chosen from this class, five of them (SF2, SF3, SF6, SF7, and SF8) have the same structure of two connected FCC subdomains with two external atoms changing their positions on the surface, and we show the most stable geometry SF2. As representatives of CP clusters, the SFS isomers T1 and T2 have stacking faults in all four [111] directions. The perfect symmetry of T1 is broken in T2 (not shown) via a surface atom displacement. The icosahedral and decahedral isomer structures are obtained from the Cambridge Cluster Database,walesco where ICO corresponds to the most stable icosahedral configuration found with a model potential, and DECA is based on the Mark’s decahedron for 101 atoms (one atom is removed).
| Isomer | D | (eV) | (eV) | (Å) | (eV) | ||
|---|---|---|---|---|---|---|---|
| FCC1 | 436 | 146.3443 | o 0.256 | 0.000 | 0.552/0.000 | 2.827/0.052 | 0.162 |
| SF1 | 436 | 146.3522 | o 0.246 | 0.087 | 0.536/-0.014 | 2.829/0.058 | 0.210 |
| FCC2 | 436 | 146.3615 | o 0.246 | 0.129 | 0.517/-0.033 | 2.827/0.055 | 0.067 |
| FCC3 | 436 | 146.3443 | o 0.230 | 0.172 | 0.552/0.017 | 2.824/0.055 | 0.080 |
| FCC4 | 435 | 146.1399 | o 0.227 | 0.402 | 0.970/0.439 | 2.823/0.058 | 0.099 |
| SF2 | 436 | 146.3304 | o 0.242 | 0.656 | 0.580/0.033 | 2.829/0.069 | 0.185 |
| SF3 | 436 | 146.3113 | o 0.235 | 0.661 | 0.619/0.078 | 2.827/0.060 | 0.178 |
| SF4 | 435 | 146.1129 | p 0.226 | 0.727 | 1.025/0.495 | 2.835/0.073 | 0.140 |
| SF5 | 435 | 146.0905 | p 0.222 | 0.766 | 1.071/0.548 | 2.830/0.062 | 0.173 |
| SF6 | 436 | 146.3257 | o 0.245 | 0.812 | 0.590/0.041 | 2.830/0.074 | 0.143 |
| SF7 | 436 | 146.3390 | o 0.287 | 0.930 | 0.563/0.034 | 2.829/0.062 | 0.111 |
| SF8 | 435 | 146.1521 | o 0.255 | 0.993 | 0.945/0.393 | 2.829/0.063 | 0.078 |
| SF9 | 434 | 145.9101 | p 0.183 | 1.021 | 1.440/1.018 | 2.832/0.064 | 0.139 |
| T1 | 438 | 146.6140 | 0.000 | 1.043 | 0.000/(1.043) | 2.826/0.048 | 0.022 |
| T2 | 436 | 146.2246 | 0.054 | 1.133 | 0.797/1.238 | 2.828/0.064 | 0.135 |
| … | … | … | … | … | … | … | … |
| DECA | 0.053 | 2.647 | 2.838/0.079 | 0.049 | |||
| ICO | o 0.156 | 3.320 | 2.851/0.093 | 0.130 |
The isomers in Table 5 are ordered according to the DF total energy. The FCC isomers have lowest energy, followed by other CP structures, and the DECA and ICO isomers are significantly higher due to the internal strain within these geometries. This is in agreement with a previous study of Al clusters, akola00 which showed that Al tends to form FCC geometries at a relatively early stage (). In contrast to the classical potentials, DF calculations give a higher total energy for T1 than for the other CP clusters (except for T2). The highly symmetric geometry of T1 results in degeneracies of electronic levels (see Figure 7), and one of them occurs at the Fermi energy, leading to an energetically unstable situation. The cluster undergoes a small Jahn-Teller deformation, which can be seen as a finite HOMO-LUMO gap in Table 5, but there are no changes in the overall shape. We presume that a deformation of the T1 shape should lower the total energy, especially when the other structures show marked deformations (see Table 5). This is related to the self-deformation of valence electron density in the jellium model,Bra93 a phenomenon that lowers total energy. Taking this effect into account, we have modified our expression for the classical energy:
| (4) |
where is a coupling constant and corresponds to the minimum energy deformation, defined as where ’s are the moments of inertia in the principal axis presentation. The value of is calibrated using the DF results for FCC1 and T1 (difference in binding energy), assuming that FCC1 represents an ideal deformation. The results for the new classical energy in Table 5 now correlate better with DF calculations, but SF2 and structures related to it remain close to the lowest energy isomer, indicating that other contributions (such as surface and strain energy) must also be considered.
Density functional calculations show that the CP isomers lie within a very narrow energy range of 1.13 eV (Table 5), corresponding to 90 K when converted to vibrational energy.tvib Moreover, the energy difference between the most stable (FCC1) and next higher (SF1) isomers is negligible, which emphasizes that one cannot claim that FCC clusters are more stable than SF structures. The nearest neighbor distances reveal, however, some minor deviations: in FCC clusters the average bond length is slightly smaller, and the related distribution width is narrow. The FCC isomers are evidently relatively strain-free, which partially explains the energetic trend in the CP data set (see also ICO and DECA). As discussed above, the electronic structure contributes to the total energy, as shown by the HOMO-LUMO gap, which is maximized via a self-deformation process whenever possible. It is shown in Table 5 that the HOMO-LUMO gaps of Al100 clusters are in the range of 0.02-0.21 eV, and that the most stable structures FCC1 and SF1 also have significant values. Nevertheless, there is no clear trend among the clusters studied.

The electronic density of states (DOS) of FCC1 and T1 clusters is shown in Figure 7. The DOS of T1 is highly peaked due to the electron level degeneracies whereas FCC1 shows a gradually increasing DOS with less fine structure. The latter applies basically to all the other CP isomers that have no symmetry in the cluster geometry. In order to compare our results with the spherical jellium model (SJM), we have labeled the main peaks present in the T1 spectrum according to the related number of valence electrons (KS orbitals). Apart from , the system corresponds fully with the magic numbers of SJM up to 198 valence electrons, after which the exact details in the cluster shape and structure start to contribute. The T1 cluster actually has a symmetry, but a corner truncation has brought it apart from a perfect tetrahedron, and no magic numbers related to the tetrahedral external potential can be observed.Rei97 The last electron shell in the T1 spectrum is only partially filled, and there is no shell closing at (Fermi energy).
The experimental photoelectron spectrum (PES) of AlN () cluster anions Wang98 shows a marked gap at the threshold region. Based on our earlier experience with Al clusters,akola99 ; akola00 we have compared the DOS of close-packed Al isomers (not shown) with the experimental PES. As indicated by the sizable HOMO-LUMO gaps of neutral clusters, qualitatively correct features can be observed in the DOS of lowest energy isomers (FCC1 and SF1). However, the separation of the first peak in the theoretical DOS is far too small (0.2 eV), and the corresponding electron detachment energy is 3.2 eV, whereas it is 3.4 eV in the experiments. This suggests that the experimental spectrum is dominated by an electronically stable isomer that is not considered in the present study. Presumably, the long thermal tail in the experimental PES (starting from 3.1 eV) is caused by the presence of other isomers – such as FCC1 and SF1.
IV Conclusion
Close-packed geometries are important structures present in a small cluster size regime, and we have studied the structures of hard sphere clusters up to atoms using two types of classical potentials. The total energy is minimized using the Monte Carlo method. For most sizes, the discrete PP model leads to several isomers with the same total energy (number of bonds). Only for , 38–40, 86, 88, 102, and 104 does the FCC geometry have more bonds than any of the geometries with stacking faults. On the other hand, for , 11, 12, 26–28, 33, 35, 49–51, 58–60, 81, 83, 92, 99–100, 105 the most stable PP isomer does not have an FCC structure. Clusters with and atoms have a tetrahedral symmetry and stacking faults on all surface facets. An inclusion of the TB model yields qualitatively same results, the only effect being in the separation of the isomers having the maximal coordination.
The energy as a function of the cluster size shows that clusters with , 26, 38, 50, 59, 61, 68, 75, 79, 86, 100, and 102 have the most pronounced energy minima. Of these only the 38, 75, 79, 86, and 102 atom clusters have an FCC structure. The moments of inertia correlate well with the energy curve, showing that most of the magic clusters have also a compact geometry, i.e., the overall shape of clusters is not deformed. There exist, however, structures such as FCC-102 where the deformation is compensated by the large (111) facets. Such a behavior becomes increasingly important as the cluster size increases, leading to an epitaxial growth pattern.Val95
The connection between the model potential and DF calculations has been studied in the case of Al100. The DF calculations show that the strain-free CP structures are lower in total energy than the corresponding icosahedral and decahedral isomers. In CP regime the total energy differences are very small (supposing that the coordination number of the cluster is close to the maximum), and the electronic structure becomes important. As illustrated by the isomer T1, the valence electron density of Al100 clusters prefers deformation, and this criterion is fulfilled by almost all the CP isomers presented. None of the structures reported reproduces the experimental PES.Wang98 The exceptional shape of the experimental curve and the high electron detachment energy indicate that the underlying isomer must be electronically very stable. We speculate that perhaps an elongated (or otherwise deformed) T1 isomer, where the degeneracy at the Fermi energy is removed, can reproduce this feature. A simple geometry optimization is not enough to investigate this possibility, and ab initio MD simulations will be necessary.
CP clusters with stacking faults are potential candidates for the most stable isomer in some occasions, and we have demonstrated this for Al100, where the energetic difference between the FCC and SF clusters is negligible. Therefore, these structural motifs are competitive even at relatively large cluster sizes (). Experiments indicate that the octahedral FCC isomers start to dominate the Al mass-spectrum at due to formation of large (111) facets that minimize the surface energy. martin92 ; martin96
V Acknowledgments
This work has been supported by the Academy of Finland under the Finnish Centre of Excellence Programme 2000-2005 (Project No. 44875, Nuclear and Condensed Matter Programme at JYFL). J.A. has been supported by the Bundesministerium für Bildung und Forschung (BMBF), Bonn, within the Kompetenzzentrum Materialsimulation, 03N6015. We thank L.-S. Wang for providing us the experimental PES of Al, and R.O. Jones for a critical reading of the manuscript.
References
- (1) T.P. Martin, Phys. Reports 273, 199 (1996).
- (2) D. Reinhard, B.D. Hall, D. Ugarte, and R. Monot, Phys. Rev. B 55, 7868 (1997).
- (3) T.P. Martin, U. Näher, and H. Schaber, Chem. Phys. Lett. 199, 470 (1992).
- (4) G. Wulff, Z. Krystallogr. Mineral. 34, 449 (1901).
- (5) S. Ino, J. Phys. Soc. Japan 27, 941 (1969).
- (6) H. Häkkinen, J. Kolehmainen, M. Koskinen, P.O. Lipas, and M. Manninen, Phys. Rev. Lett. 78, 1034 (1997).
- (7) H. Häkkinen and M. Manninen, Phys. Rev. B 52, 1540 (1995).
- (8) A. Rytkönen and M. Manninen, J. Chem. Phys. 113, 4647 (2000).
- (9) V. Kumar and R. Car, Phys. Rev. B 44, 8243 (1991).
- (10) P. Delaly, P. Ballone and J. Buttet, Phys. Rev. B 45, 3838 (1992).
- (11) J. Akola, M. Manninen, H. Häkkinen, U. Landman, X. Li and L.-S. Wang, Phys. Rev. B 60, 11297 (1999).
- (12) L.T. Wille and J. Vennik, J. Phys. A 18, L419 (1985).
- (13) M.R. Hoare and J.A. McInnes, Adv. Phys. 32, 791 (1983).
- (14) J.P.K. Doye, D.J. Wales, Phys. Rev. Lett. 80, 1357 (1998).
- (15) J.P.K. Doye, M. Miller and D.J. Wales, J. Chem. Phys. 111, 8417 (1999).
- (16) R. Leary and J.P.K. Doye, Phys. Rev. E 60, 6320 (1999).
- (17) J.P.K. Doye, D.J. Wales and S.I. Simdyankin, Faraday Discussions 118, 159 (2001).
- (18) J.P.K. Doye and D.J. Wales, Phys. Rev. Lett. 86, 5719 (2001).
- (19) J.P.K. Doye, D.J. Wales, W. Branz and F. Calvo, Phys. Rev. B 64, 235409 (2001).
- (20) F. Baletto, C. Mottet and R. Ferrando, Phys, Rev. Lett. 84, 5544 (2000).
- (21) F. Baletto, J.P.K. Doye, and R. Ferrando, Phys, Rev. Lett. 88, 075503 (2002).
- (22) S. Valkealahti and M. Manninen, Phys. Rev. B 45, 9495 (1992).
- (23) C.L. Cleveland, U. Landman, T.G. Schaaff, M.N. Shafigullin, P.W. Stephens, and R.L. Whetten, Phys. Rev. Lett. 79, 1879 (1997).
- (24) X. Li, H. Wu, X.-B. Wang, and L.-S. Wang, Phys. Rev. Lett. 81, 1909 (1998).
- (25) K. Manninen and M. Manninen, Eur. Phys. J. D20, 243 (2002).
- (26) J. Akola, M. Manninen, H. Häkkinen, U. Landman, X. Li, and L.-S. Wang, Phys. Rev. B 62, 13216 (2000).
- (27) R.P. Gupta, Phys. Rev. B 23, 6265 (1981).
- (28) M.W. Finnis and J.E. Sinclair, Phil. Mag. A 50, 45 (1984).
- (29) H. Häkkinen, J. Mansikka-aho and M. Manninen, J. Phys.: Condens. Matter 3, 7757 (1991).
- (30) Y. Wang, T.F. George, and D.M. Lindsay, J. Chem. Phys. 86, 3493 (1987).
- (31) A. Yoshida, T. Døssing, and M. Manninen, J. Chem. Phys. 101, 3041 (1994).
- (32) CPMD V3.5 Copyright IBM Corp 1990-2002, Copyright MPI für Festkörperforschung Stuttgart 1997-2001.
- (33) N. Troullier and J.L. Martins, Phys. Rev. B 43, 1993 (1991).
- (34) J.P. Perdew, K. Burke, and M. Ernzerhof, Phys. Rev. Lett. 77, 3865 (1996).
- (35) J.P.K. Doye and D.J. Wales, Chem. Phys. Lett. 247, 339 (1995).
- (36) M. Manninen, J. Mansikka-aho, H. Nishioka, and Y. Takahashi, Z. Phys. D 31, 259 (1994).
- (37) C.F. Weizsäcker, Z. Phys. 96, 431 (1935).
- (38) J.P. Perdew, Y. Wang, and E. Engel, Phys. Rev. Lett. 66, 508 (1991).
- (39) J.P.K. Doye and D.J. Wales, J. Chem. Soc., Faraday Trans., 93, 4233 (1997).
- (40) The Cambridge Cluster Database, D.J. Wales, J.P.K. Doye, A. Dullweber, M.P. Hodges, F.Y. Naumkin, F. Calvo, J. Hernández-Rojas, and T.F. Middleton, URL http://www-wales.ch.cam.ac.uk/CCD.htm.
- (41) M. Brack, Rev. Mod. Phys. 65, 676 (1993).
- (42) The difference in total energy is converted to vibrational temperature according to the classical statistical mechanics by taking into account the degrees of freedom.
- (43) S.M. Reimann, M. Koskinen, H. Häkkinen, P.E. Lindelof, and M. Manninen, Phys. Rev. B 56, 12147 (1997).
- (44) S. Valkealahti, U. Näher, and M. Manninen, Phys. Rev. B 51, 11039 (1995).