Using Absorption Imaging to Study Ion Dynamics in an Ultracold Neutral Plasma
Abstract
We report optical absorption imaging of ultracold neutral plasmas. Images are used to measure the ion absorption spectrum, which is Doppler-broadened. Through the spectral width, we monitor ion equilibration in the first 250 ns after plasma formation. The equilibration leaves ions on the border between the weakly coupled gaseous and strongly coupled liquid states. On a longer timescale of microseconds, we observe radial acceleration of ions resulting from pressure exerted by the trapped electron gas.
Plasma physics traditionally studies systems with temperatures of thousands of kelvin or greater because collisional ionization of atoms requires kinetic energies on this scale. Ultracold neutral plasmas, created by photoionizing laser-cooled and trapped atoms, access an exotic regime in which particle energies can be on the order of 1 K.
Fundamental interest in ultracold neutral plasmas stems from a range of phenomena in the ultracold regime. Recent experiments have studied plasma creation Killian et al. (1999), collective modes Kulin et al. (2000), and recombination into highly excited Rydberg atomic states Killian et al. (2001). The spontaneous evolution of a dense, ultracold gas of Rydberg atoms into an ultracold plasma has also been investigated Robinson et al. (2000). This is part of a search in atomic clouds for an analog of the Mott insulator-conductor transition in condensed matter Vitrant et al. (1982). Recombination in these systems resembles the methods used to produce cold antihydrogen with trapped positrons and antiprotons Amoretti et al. (2002); Gabrielse et al. (2002).
A series of theory papers Murillo (2001); Kluzmin and O’Neil (2002); Mazevet et al. (2002); Robicheaux and Hanson (2003); Tkachev and Yakovlenko (2000) explored issues surrounding thermalization and recombination in ultracold neutral plasmas when both electrons and ions are near or in the strongly coupled regime Ichimuru (1982). In strongly coupled plasmas the electrical interaction energy between the charged particles exceeds the average kinetic energy. This reverses the traditional energy hierarchy that underlies our normal understanding of plasmas based on concepts such as Debye screening and hydrodynamics. Strongly coupled plasmas exist in dense astrophysical systems Horn (1991), matter irradiated with intense laser fields Nantel et al. (1998); Springate et al. (2000), dusty plasmas of highly charged macroscopic particles Morfill et al. (1999), and non-neutral trapped ion plasmas Mitchell et al. (1999) that are laser cooled until they freeze into Wigner crystals.
We now report the first results with a new probe of ultracold plasmas: absorption imaging. This technique provides in situ, non destructive measurements, and offers excellent spatial, temporal, and spectral resolution. We describe the use of this probe to study ion-ion equilibration and expansion of the plasma during the first few microseconds after photoionization, but we emphasize its great potential to study a host of phenomena such as ion collective modes Murillo (2000), shock waves Robicheaux and Hanson (2003), recombination, and particle-particle spatial correlations Mitchell et al. (1999).
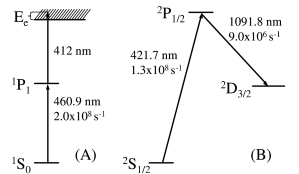
The production of an ultracold neutral plasma starts with atoms that are cooled and confined in a magneto-optical trap (MOT) (Fig. 1A). This aspect of the experiment was described in Nagel et al. (2003). The neutral atom cloud is characterized by a temperature of about 20 mK and a density distribution given by , with mm and cm-3. The number of trapped atoms is .
To form the plasma, the MOT magnets are turned off and atoms are ionized with photons from a ns pulsed dye laser whose wavelength is tuned just above the ionization continuum (Fig. 1A). Because of the small electron-to-ion mass ratio, the initial electron kinetic energy () approximately equals the difference between the photon energy and the ionization potential. can be as low as the bandwidth of the ionizing laser, which is 100 mK. The initial kinetic energy for the resulting singly-charged, electronic ground state ions is close to that of the original neutral atoms. As we will discuss below, the resulting non-equilibrium plasma evolves rapidly. Up to % of the neutral atoms are ionized producing plasmas with a peak density of cm-3.
Immediately after photoionization, the charge distribution is neutral everywhere. Due to the kinetic energy of the electrons, the electron cloud expands on the timescale of the inverse electron plasma frequency ns, where , , and are the electron mass, density and charge. On this timescale the ions are essentially immobile. The resulting local charge imbalance creates a Coulomb potential energy well that traps all but a small fraction (%) of the electrons. Simulations Killian et al. (1999) show that electrons escape mostly from the edges of the spatial distribution, and the center of the cloud is well described as a neutral plasma non . The diagnostic used in previous experiments was charged particle detection of electrons and ions after they had left the plasma.
Spectroscopic diagnostics are ubiquitous in plasma experiments, and some even provide spatial information, such as spatially resolved laser induced fluorescence Levinton and Trintchouk (2001); Mitchell et al. (1999). The absorption imaging reported here is particularly well-adapted for small, cold, relatively dilute plasmas that evolve very quickly. It is also a powerful technique for studying laser cooled and trapped neutral atoms Metcalf and van der Straten (1999). A collimated laser beam, tuned near resonance with the principle transition in the ions (Fig. 1B), illuminates the plasma and falls on an image intensified CCD camera. Following Beer’s law, the optical depth () is defined in terms of the image intensity without () and with () the plasma present,
| (1) | |||||
where is the peak ion density, and is the absorption cross section at the image beam frequency, . In the last line we have inserted a Gaussian density distribution for the ions, which leads to the function used to fit the data.
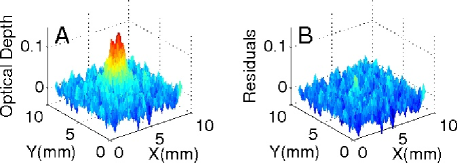
Figure 2 shows a typical absorption image. The intensity of the probe beam is approximately , which is much less than the saturation intensity of the transition ( ). The spatial resolution of typical images is about m, limited by pixel averaging performed to improve the signal-to-noise ratio of the images.
To study the time-evolution of the plasma, we vary the delay between the formation of the plasma and image exposure () with ns accuracy. The minimum camera exposure gate width is ns. For the shortest exposure times, which we use for the best time resolution at very short , we typically average about 60 ionizing laser shots. For longer delay times we use longer image exposure times of up to ns, and decrease the number of accumulations to keep the total number of photons detected approximately constant. The repetition rate for ionization and image recording is about 5 times per second.
The imaging beam itself can also be gated with a minimum width of about ns. We use this capability for s to turn off the image beam until the camera exposure begins. This prevents optical pumping of the ions to the state (Fig. 1B).
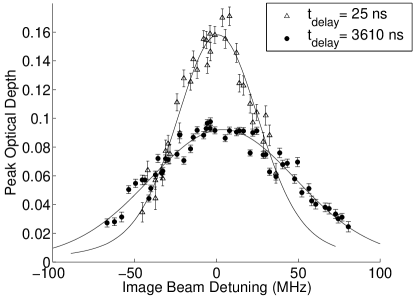
Plotting the peak optical depth as a function of image laser frequency provides the absorption spectrum of the ions (Fig. 3). The imaging laser linewidth of about MHz is negligible on the scale of the MHz natural linewidth of the transition. As described below, additional broadening of the absorption spectrum provides a wealth of information on the plasma dynamics.
Here we describe experiments using the time evolution of the absorption spectrum to study ion dynamics for a plasma with ions, initial peak density for ions and electrons of cm-3, and K. We chose a relatively large in order to avoid complications that arise when the electron Coulomb coupling parameter () approaches or initially exceeds unity, such as screening of the ion interaction Farouki and Hamaguchi (1994), and rapid collisional recombination and heating of the electrons Kluzmin and O’Neil (2002); Mazevet et al. (2002); Robicheaux and Hanson (2003); Tkachev and Yakovlenko (2000). Here, is the Wigner-Seitz radius, and is the electron temperature as set by the wavelength of the ionizing laser. For this sample .
The observed spectral linewidths are all significantly broader than the natural linewidth of the transition. Collisional broadening is not significant because of the relatively low particle density and collision frequency in the sample. The dominant contribution to the linewidth is Doppler broadening, which makes the spectrum a very accurate probe of the ion velocity distribution. From the fit of each spectrum to a Voigt profile, we extract the rms Doppler broadening, , where is the ion mass, and is the wavelength of the transition. This allows us to determine an ion temperature () as a function of time, as shown in Fig. 4.
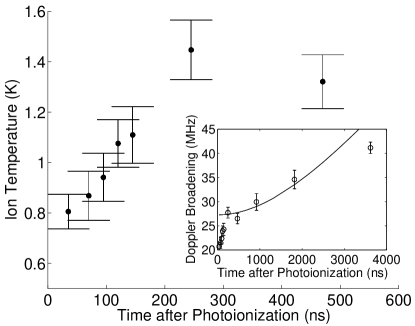
The temperature increases rapidly for ns. Two pieces of information imply that this is thermalization of ions with themselves after creation in a spatially disordered state. The timescale is on the order of the inverse plasma frequency of ions, ns, which is the timescale on which ions respond to perturbations from their equilibrium spatial distribution. The temperature of K derived from the Doppler width at ns is also on the order of the amount of potential energy inherent in the initial disorder of the ions. A simple estimate implies there is K of potential energy that will be redistributed during thermalization.
This thermalization has been modelled with molecular dynamics simulations Murillo (2001); Mazevet et al. (2002); Kluzmin and O’Neil (2002), and the experimental data is in general agreement with the theory. The accuracy of the imaging probe will enable detailed comparison of measurement and theory for the time dependence of the ion temperature.
The final temperature reached, however, can be compared with an expression derived in Murillo (2001). Assuming complete initial disorder and incorporating the screening effects of the electrons,
| (2) |
Here, where m is the Debye length. The quantity is the potential energy per particle in units of . It has been studied with molecular dynamics simulations Farouki and Hamaguchi (1994) for a homogeneous system of particles interacting through a Yukawa potential, , which describes ions in the background of weakly coupled electrons deb . The experimental values for , , and , imply =-0.73. Equation 2 then gives K, in excellent agreement with the measured value.
We now address the level of Coulomb coupling for the ions. From the temperature and peak density we derive for the thermalized ion cloud at ns. For a system of charges embedded in a uniform neutralizing background, formally called a one-component plasma Dubin and Neil (1999), local spatial correlations characteristic of a strongly coupled fluid appear for . For Debye shielded particles, such as the ions studied here, screening will reduce the correlations. This effect is approximately incorporated by using the effective coupling constant Kluzmin and O’Neil (2002); Farouki and Hamaguchi (1994). At ns, , and the ions are just on the edge of the strongly coupled fluid phase. Perhaps other initial experimental parameters, or laser cooling of the ions Killian et al. (2003); Kluzmin and O’Neil (2002), will lead to more strongly coupled systems, although already puts the experiment in an interesting regime.
For ns, the spectral width continues to increase, but at a slower rate, as shown in the inset of Fig. 4. This slow increase is due to outward radial acceleration of the ions caused by pressure exerted by the gas of trapped electrons. This was studied experimentally in Kulin et al. (2000) and theoretically by a variety of means in Robicheaux and Hanson (2003). The experiments measured the final velocity that the ions acquired, which was approximately . Here we observe the ion dynamics at much earlier times during the acceleration phase.
A hydrodynamic treatment Kulin et al. (2000) predicts that the force per ion is
| (3) |
where the ion and electron density distributions are . We approximate the rms size () as the mean of the observed sizes and , and we assume thermal equilibrium for the electrons throughout the cloud Robicheaux and Hanson (2003). This force leads to a radial expansion velocity for the ions, , which is correlated with position and increases linearly with time. This does not represent an increase in the random thermal velocity spread or temperature of the ions. Due to the large mass difference, thermalization of ions and electrons Kluzmin and O’Neil (2002) is slow and occurs on a millisecond timescale. The increase in Doppler broadening due to thermalization is approximately one order of magnitude smaller than what is observed.
Using the dynamics implied by Eq. 3, the evolution of the Doppler broadening can be calculated. The mean squared velocity component along the imaging laser is
| (4) |
where is the thermal distribution of for K. The resulting theoretical Doppler broadening , plotted in Fig. 4, reproduces the data accurately.
The ion acceleration is thus an excellent diagnostic of the electron temperature. This will be of great value in future studies because the temperature is predicted to evolve in a complicated fashion for lower initial due to recombination and disorder-induced heating of the electrons Kluzmin and O’Neil (2002); Mazevet et al. (2002); Robicheaux and Hanson (2003); Tkachev and Yakovlenko (2000). One also expects that there will be a cooling effect at longer due to expansion of the plasma and evaporative cooling Robicheaux and Hanson (2003). The small discrepancy between theory and data for long in Fig. 4 may indicate the onset of this cooling, although expansion of the plasma is small on the timescale of these observations. For the maximum and typical m/s, m. This small increase in size is observed in the images (Fig. 2).
The initial study using absorption imaging of an ultracold neutral plasma has probed ion dynamics in the first few microseconds after photoionization. It revealed disorder-induced heating that was predicted in Murillo (2001), and showed that the ions equilibrate on the boundary of the gas-liquid transition. Acceleration of ions due to electron pressure was also evident, and can be used to monitor the electron temperature.
Many future experiments suggest themselves. Some of the most interesting are investigating dynamics when the initial electron Coulomb coupling parameter is large and recombination and disorder-induced electron heating are expected to dominate the plasma evolution. Detailed study of ion and electron thermalization at the border of the strongly coupled regime is also possible. Improvements in the imaging optics will significantly increase the image signal-to-noise ratio and allow study of features on the ion density distribution with m experimental resolution.
This research was supported by the Department of Energy Office of Fusion Energy Sciences, Office for Naval Research, Research Corporation, Alfred P. Sloan Foundation, and David and Lucille Packard Foundation.
References
- Killian et al. (1999) T. C. Killian, S. Kulin, S. D. Bergeson, L. A. Orozco, C. Orzel, and S. L. Rolston, Phys. Rev. Lett. 83, 4776 (1999).
- Kulin et al. (2000) S. Kulin, T. C. Killian, S. D. Bergeson, and S. L. Rolston, Phys. Rev. Lett. 85, 318 (2000).
- Killian et al. (2001) T. C. Killian, M. J. Lim, S. Kulin, R. Dumke, S. D. Bergeson, and S. L. Rolston, Phys. Rev. Lett. 86, 3759 (2001).
- Robinson et al. (2000) M. P. Robinson, B. L. Tolra, M. W. Noel, T. F. Gallagher, and P. Pillet, Phys. Rev. Lett. 85, 4466 (2000).
- Vitrant et al. (1982) G. Vitrant, J. M. Raimond, M. Gross, and S. Haroche, J. Phys. B 15, 49 (1982).
- Amoretti et al. (2002) M. Amoretti et al., Nature 419, 456 (2002).
- Gabrielse et al. (2002) G. Gabrielse et al., Phys. Rev. Lett. 89, 213401 (2002).
- Murillo (2001) M. S. Murillo, Phys. Rev. Lett. 87, 115003 (2001).
- Kluzmin and O’Neil (2002) S. G. Kluzmin and T. M. O’Neil, Phys. Plasmas 9, 3743 (2002).
- Mazevet et al. (2002) S. Mazevet, L. A. Collins, and J. D. Kress, Phys. Rev. Lett. 88, 55001 (2002).
- Robicheaux and Hanson (2003) F. Robicheaux and J. D. Hanson, Phys. Plasmas 10, 2217 (2003).
- Tkachev and Yakovlenko (2000) A. N. Tkachev and S. I. Yakovlenko, Quantum Electronics 30, 1077 (2000).
- Ichimuru (1982) S. Ichimuru, Rev. Mod. Phys. 54, 1017 (1982).
- Horn (1991) H. M. V. Horn, Science 252, 384 (1991).
- Nantel et al. (1998) M. Nantel, G. Ma, S. Gu, C. Y. Cote, J. Itatani, and D. Umstadter, Phys. Rev. Lett. 80, 4442 (1998).
- Springate et al. (2000) E. Springate, N. Hay, J. W. G. Tisch, M. B. Mason, T. Ditmire, M. H. R. Hutchinson, and J. P. Marangos, Phys. Rev. A 61, 063201 (2000).
- Morfill et al. (1999) G. E. Morfill, H. M. Thomas, U. Konopka, and M. Zuzic, Phys. Plasmas 6, 1769 (1999).
- Mitchell et al. (1999) T. B. Mitchell, J. J. Bollinger, X. P. Huang, W. M. Itano, and D. H. E. Dubin, Phys. Plasmas 6, 1751 (1999).
- Murillo (2000) M. S. Murillo, Phys. Rev. Lett 85, 2514 (2000).
- Nagel et al. (2003) S. B. Nagel, C. E. Simien, S. Laha, P. Gupta, V. S. Ashoka, and T. C. Killian, Phys. Rev. A 67, 011401 (2003).
- (21) The approximate excess ion density is , where is the Debye screening length.
- Levinton and Trintchouk (2001) F. M. Levinton and F. Trintchouk, Rev. Sci. Instruments 72, 898 (2001).
- Metcalf and van der Straten (1999) H. J. Metcalf and P. van der Straten, Laser Cooling and Trapping (Springer-Verlag New York, New York, 1999).
- Farouki and Hamaguchi (1994) R. T. Farouki and S. Hamaguchi, J. Chem. Phys. 101, 9885 (1994).
- (25) There are many electrons per Debye sphere (), which justifies the use of this model.
- Dubin and Neil (1999) D. H. E. Dubin and T. M. O. Neil, Rev. Mod. Phys. 71, 87 (1999).
- Killian et al. (2003) T. C. Killian, V. S. Ashoka, P. Gupta, S. Laha, S. B. Nagel, C. E. Simien, S. Kulin, S. L. Rolston, and S. D. Bergeson, J. Phys. A: Math. Gen. 36, 6077 (2003).