Probing complex RNA structures by mechanical force
RNA secondary structures of increasing complexity are probed combining single molecule stretching experiments and stochastic unfolding/refolding simulations. We find that force-induced unfolding pathways cannot usually be interpretated by solely invoking successive openings of native helices. Indeed, typical force-extension responses of complex RNA molecules are largely shaped by stretching-induced, long-lived intermediates including non-native helices. This is first shown for a set of generic structural motifs found in larger RNA structures, and then for Escherichia coli’s 1540-base long 16S ribosomal RNA, which exhibits a surprisingly well-structured and reproducible unfolding pathway under mechanical stretching. Using out-of-equilibrium stochastic simulations, we demonstrate that these experimental results reflect the slow relaxation of RNA structural rearrangements. Hence, micromanipulations of single RNA molecules probe both their native structures and long-lived intermediates, so-called “kinetic traps”, thereby capturing –at the single molecular level– the hallmark of RNA folding/unfolding dynamics.
Keywords: RNA folding/unfolding; Single molecule experiments; Stochastic simulations; Non-native helices and kinetic traps; 16S ribosomal RNA.
Introduction
Recent developments of micromechanical experiments on single biomolecules have provided structural insights into alternative structures of DNAchatenay ; bustamante ; leger1 ; allemand and mechanical properties of proteinsprot1 ; prot2 ; prot4 . In principle, such techniques could also provide new tools to probe RNA structures which remain by and large refractory to many crystallization schemes. However, this prospect requires one to relate mechanically induced unfolding pathways to RNA structural features. Although it could be done successfully for small RNA structures by solely invoking successive openings of native helicesliphardt1 , probing more complex RNA structures by mechanical force is expected to involve non-native structural rearrangements of the initial secondary structure upon stretchingmontanari ; bundschuh ; lubensky . Local rearrangements, such as the formation of simple stem-loops, occur quite fast ( 1 ms) under low pulling force (or in the absence of force) and the number of possible hairpins (with small loop) is proportional to the length of stretched region of the RNA molecule. Thus, alternative hairpins, not present on the initial structure, should inevitably form under partial stretching of long RNA molecules (e.g., 1000 nucleotides). Conversely, more global rearrangements, which involve the coordonated removal and formation of different sets of helices, might occur much more slowly (e.g., after a few minutes)williamson1 ; woodson . Hence, under typical pulling rates (i.e., full extension within a few seconds), most stretching experiments likely occur under out-of-equilibrium conditions and should exhibit unfolding/refolding hysteresis curves.
To study the full potential and limitations of these micromechanical techniques so as to probe complex RNA structures, we have combined single RNA molecule stretching experiments and out-of-equilibrium stochastic simulations. Three small artificial structures, M1, M2 and M3 (Fig 1), representing prototypes for the main structural modules of larger RNA secondary structures, were first designed and studied in details. The mechanical response of E. coli’s 1540-base long 16S ribosomal RNA was then studied using the same experimental setup and a somewhat simplified numerical approach. The generic structural motifs M1, M2 and M3, correspond to three different arrangements of two 15 base pair long helices consisting almost exclusively of either GC or AU base pairs, Fig 1. M1 corresponds to two adjacent stem-loops with respect to the external single strand joining the molecule ends. By contrast, M2 and M3 present the same nested organisation with either the strong (GC) helix or the weaker (AU) helix connected to the external single strand.
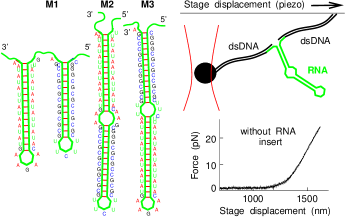
The 5’ and 3’ ends of either these small RNA motifs or E. coli’s 16S rRNA were hybridized to two pUC19 dsDNA extensions labelled, respectively, with biotin and digoxygenin (see Materials and Methods). The force-extension experiments were then done by grafting the ends of these extended molecular constructs between the antidigoxygenin coated glass surface of a capillary and a micrometer size silica bead coated with strepavidin. The capillary was moved by a piezo-electric stage (50 to 300 nm/s) and the resulting force exerted by the molecule on to the bead was measured with an optical tweezer.
Results
Single molecule stretching experiments of small RNA motifs
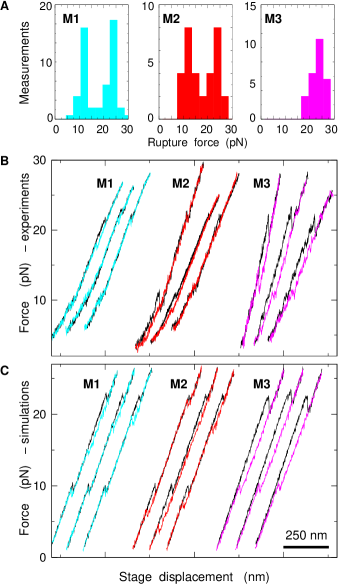
When structural motifs M1, M2 or M3 are inserted in the molecular construct, one or two force drops occur on the force-extension curve, Fig 2. A histogram of the rupture force and a set of unfolding and refolding force-extension curves are shown for each motif on Fig 2A and Fig 2B. For each set, variations between force-extension curves correspond to stochastic fluctuations between either successive stretchings on the same molecule or different experiments on equivalent molecules.
A comparison of the different rupture force histograms and the corresponding unfolding curves (black on Fig 2B) shows that M1 and M2 present very similar unfolding responses with two sequential drops or inflexion regions around 11 3 pN and 22 3 pN, whereas M3 presents a single and larger force drop at about 22 3 pN. These values are in very good agreement with ref.gaub although these latter experiments concern the opening of DNA hairpins. For M1 and M2, these results can be simply attributed to the first opening of the weak (AU) helix followed by the stronger (GC) helix at a higher applied force. Indeed, the applied tension being uniformly distributed along the external single strand joining the molecules ends, the weaker (AU) helix is expected to break first on M2, while it should certainly do so by construction on M1. Besides, by calibrating the stiffness of the optical trap, both force drops on these curves can be converted into a distance released by the molecule, taking into account the angular inclination of the setup (30∘ to 40∘). This corresponds to the expected 20 nm in both cases. Substracting the net free-energy contribution stored in the stretched single strandcocco , we find in term of pairing energy, around 1.7 kT/bp for AU and 3 kT/bp for GC, in good agreement with known parametersturner . By contrast for M3, the strong (GC) helix shields the weaker (AU) stem from the applied force and no significant unzipping is observed until the whole molecule suddenly unfolds at the critical force to break GC stacking base pairs.
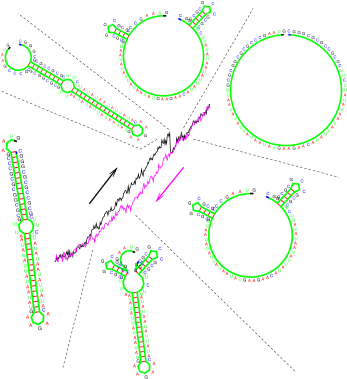
The refolding curves for M1 (blue) and M2 (red) show most often a small hysteresis below the force drop associated with the strong (GC) stem’s opening. For M2, a second small refolding hysteresis occurs also usually below the force drop associated with the weaker (AU) stem’s opening. By contrast, a much stronger hysteresis is systematically observed for M3 (magenta), even at the lowest loading rate achieved, 3 pN/s. Moreover, in this case, the refolding event around 10 pN does not usually fold back onto the initial stretching curve. This suggests that the stretching of M3 involves long-lived intermediate structures including non-native helices (see Fig 3 and next section on stochastic simulations of small RNA motifs). Still, all three molecules eventually fold back in their initial native structure after a few seconds, as shown by the reproducibility of force extension curves in successive pulls on the same molecule.
Stochastic unfolding/refolding simulations of small RNA motifs
We have performed stochastic simulations of these out-of-equilibrium unfolding/refolding experiments for the short M1, M2 and M3 structural motifs. The heart of the numerical method, following the approach detailed inisambert , consists in simulating the stochastic unfolding and refolding of helices not only present on the initial RNA structure but also for all other helices which can possibly pair on the RNA sequence of interest (see also RNA Kinefold server at http://kinefold.u-strasbg.fr ). Common pseudoknots (i.e., helices interior to loops) are also allowed following the structural modeling approach proposed inisambert . In addition, the region of the RNA structure under direct mechanical tension (corresponding to the “on-net” backbone inisambert ) is modelled as an inextensible wormlike chain with a 1.5 nm persistence lengthbustamante and 0.7 nm/base contour lengthcontour . Stretching is induced by a slowly varying rigid constraint on the end-to-end distance of the RNA-dsDNA-tweezer construct (rate 300 nm/s in 2 nm steps). It is also important to take into account the acquisition rate (300 Hz) and to model the statics and dynamics of the optical tweezer trap, although time scale separation allows to consider that the micromechanical setup responds to a slow time average of the fast RNA dynamics, which corresponds to stochastic closing and opening of single helicesisambert . To avoid overfitting with non essential parameters, we have simply modelled the trapped bead and the two dsDNA extensions of the construct as an ideal spring with a slow viscous relaxation time (1 ms) and an effective stiffness (typically 0.1 pN/nm) fitted on the individual force extension curves.
The simulated force-extension responses for the M1, M2 and M3 motifs (Fig 2C) are in good agreement with the unfolding and refolding experimental results (Fig 2B). In particular, they allow for the identification of likely intermediate structures involved in the refolding hysteresis, which primarily correspond to the formation of two non-native helices originating from each strand of the strong (GC) helix, Fig 3. The transition from these alternative helices back to the strong initial (GC) stem is facilitated under high external force, hence the small hysteresis for M1 and M2. By contrast for M3, the transition can only occur at a lower force after the weak (AU) stem has refolded and is, therefore, slower, as observed experimentally. Note, the small experimental differences in the hysteresis responses of M1 and M2 are well reproduced on their simulated force-extension curves, suggesting that elementary unfolding/refolding events are reliably captured by these stochastic simulations devised to probe RNA molecular dynamics on second to minute time scales. It should be emphasized that such long time scale simulations could not be achieved for other molecules, such as proteins, for which elementary unfolding/refolding transitions are not so easily defined and also much more frequent. For instance, the best molecular dynamic simulations of proteins are currently limited to around 100 nsfersht .
The force-induced unfolding of these three generic structural motifs M1, M2 and M3, reveals the potential and limitations of single molecule experiments to probe the main folded features of more complex RNA structures. The comparison between M2 and M3’s force-extension responses illustrates that the order of helix stability along a single secondary structure branch can be readily identified, while the bifurcation arrangements of helices or the presence of multibranched loops are not so easily distinguished from single branches with increasing helix stability (as in M1 versus M2). Moreover, the formation of non-native rearrangements under stretching likely affects the force-extension responses of most RNA structures (as for M3).
In this context, combining experimental and numerical approaches to study RNA mechanical unfolding pathways seems promising insofar as transient structural rearrangements (under stretching) are difficult to probe with traditional chemical or enzymatic techniques.
On the other hand, for long RNA molecules (e.g., 1000 bases), it has been arguedmontanari ; bundschuh ; lubensky that such structural rearrangements under stretching should ultimately smooth out the observed characteristics completely by continuous adjustments to the applied constraint, assuming that quasi-equilibrium stretching is achieved.
To investigate this issue and test whether large structures of biologically relevant RNA molecules are also amenable to convergent studies in both single molecule experiments and stochastic simulations, we decided to study the mechanical unfolding of Escherichia coli’s 1540-base long 16S ribosomal RNA.
Single molecule stretching experiments of E. coli 16S rRNA
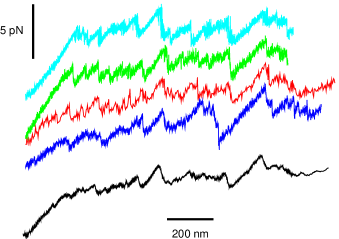
The force-induced stretching of E. coli 16S ribosomal RNA was studied using a similar molecular construct and micromechanical setup as for the stretching of the small structural modules M1, M2 and M3 (see Materials and Methods). No ribosomal proteins which associate to 16S rRNA to form the 30S subunitramakrishnan of the ribosomenoller1 were included for these stretching experiments. As the piezo stage is displaced, the force begins to rise due to the elastic response of the DNA handles. The results on Figs 4-5 show a well-structured and reproducible unfolding pathway under mechanical stretching, in about 50% of the tested constructs for which more than two unfolding/refolding rounds could be performed before molecular breakage. In these cases (total 44 stretching curves), a 1 m-long quasi plateau is observed around 11-15 pN, with force fluctuation amplitude of about 20%. This signal is the signature of 16S rRNA unfolding by mechanical force. Other stretching curves exhibit somewhat more erratic behaviors, presumably due to non-specific interactions of the construct with the glass surface of the capillary (data not shown) Extension beyond the unfolding plateau corresponds to the combined elastic response of the dsDNA handles and the opened ssRNA molecule. Most refolding curves exhibit strong hysteresis depending on stage velocity (50-300 nm/s).
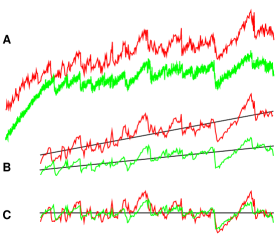
We have quantitatively evaluated the statistical reproducibility of unfolding curves between successive stretchings of the same 16S molecule (Fig 4) and between independent unfolding curves from different 16S molecules (Fig 5) (i.e., different sample preparations and different micromechanical experiments). The analysis is based on the calculation of Spearman nonparametric correlation coefficient recipes : , where , and , are chosen as the rank-ordered deviations and averages from the median line fits of the unfolding plateaux (Fig 6). Such relative Spearman correlation coefficient is much more sensitive to the specific unfolding signals, as compared to the absolute Spearman correlation of the actual unfolding curves which yields higher, yet less discriminating correlation coefficients (see Fig 6 for details).
In the context of comparing 16S unfolding curves, we found that this relative Spearman correlation coefficients correspond to good correlations above 50% and excellent ones above 70%, while 15% reflects little or no correlation between unfolding pathways irrespective of the overall inclination of their unfolding plateaux. Stochastic reproducibility between successive stretchings of the same molecule is remarkably high (=754.6%, Fig 4) and still quite good between unfolding curves of different 16S RNA (=539.1%, Fig 5) despites inherent variations between different sample preparations and different micromechanical experiments. For instance, correlation between independent green and red unfolding curves on Fig 6 is: =60.5%, while the correlation distributions of all independent curves of Fig 5 (colors) with their average unfolding response (black) is even higher: =704.7%. See Table 1 for further correlation data and quantitative comparison with stochastic simulations.
Before discussing the stochastic unfolding/refolding simulations of 16S rRNA, we want to emphasize that force fluctuations from the plateau median line cannot be attributed to dehybridization of the DNA handles for the following reasons: i) we never recorded such signals on simple pUC19 dimer without RNA insert (see Fig 1 inset). ii) experiments done by other groups with the same infrared laser power have preserved nucleic acids’ integritybustamante ; svoboda . iii) recalling that we pull on opposite DNA strands, the average force magnitude at which the plateau appears is too low to originate from DNA denaturationchatenay ; bustamante ; leger1 . Moreover, no torque is applied on the molecules using our optical tweezerallemand . In addition, experimental force fluctuations cannot correspond to the unzipping of a long structureless double stranded RNA molecules; an analysis based on G+C contents as in ref.bock does not account for the experimental signal, nor does a thermal equilibrium energy calculations.
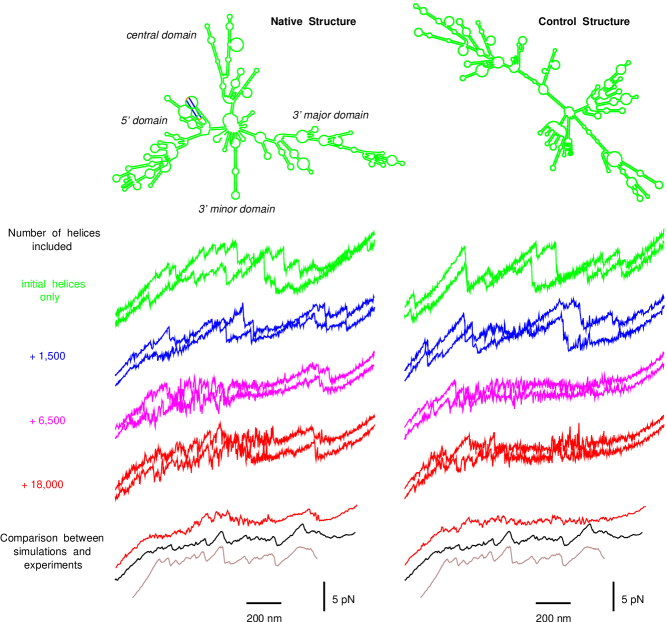
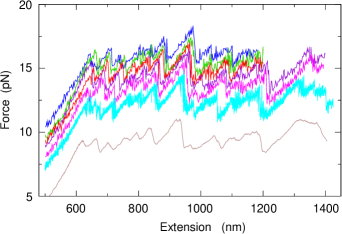
Red curves (see below) for the native structure (left) resemble most closely the experimental curves (brown from Fig 4 and black from Fig 5)
also plotted for comparison.
(Green): the stochastic simulation is restricted to the sole helices formed on the initial structure assuming, in addition, that those cannot refold
once broken (78 helices for the native structure; 86 helices for the control structure).
(Blue): the initial helices and some 1,500 additional stems longer than 3bp and containing the most stable stack (5’-GC/GC-3’) can form and break stochastically during stretching.
(Magenta): all additional helices longer than 3bp and stronger than 15kT are also included; total: 6,500 helices.
(Red): all additional helices longer than 3bp and stronger than 10kT are also considered; total: 18,000 helices. The lowest red curve corresponds to the average of four independent stretching simulations starting either from the native structure (left) or the control structure (right).
Stochastic unfolding/refolding simulations of 16S ribosomal RNA
The unrestricted stochastic simulations discussed above to model the mechanical unfolding and refolding of small structural motifs are numerically unpractical in the case of much larger RNA structures like those of ribosomal RNAs. Hence, we have made the following three additional assumptions to study the force-induced stretching of E. coli’s 1540-base long 16S ribosomal RNA: i) the initial structure before mechanical stretching is assumed known from independent sources; ii) Unfolding and (re)folding dynamics is restricted to the formed helices under direct mechanical tension and to all potential helices that would be under direct tension once formed. Hence, large scale structural rearrangements can only originate and propagate from helices directly coupled to the applied mechanical tension, as expected under strong stretching conditions; iii) For each intermediate structure along the unfolding pathway, the actual base pair extent of each helix under direct tension is not globally optimized to best fit the end-to-end molecular extension imposed by the mechanical setup (this would become exponentially difficult in the number of such helices). Instead, a local heuristics extending the most stable base pair stacks and shrinking the weakest helix ends is used iteratively to minimize free energy. This approach, which yields a linear optimization in the number of helices under direct tension, is usually very good as long as there are few mutually incompatible helices competing for the same bases, a typical situation under strong mechanical stretching. Overall, we found that these restricted stochastic simulations give virtually identical results for the small M1, M2 and M3 motifs (results not shown).
| 16S rRNA unfolding response | Stochastic reproducibility | Comparison with experiment average (black) | ||
|---|---|---|---|---|
| Deviation from median line | Ensemble cross-correlation (mean std dev.) | Correlation distribution (mean std dev.) | ||
| A Simulations including: | Native structure | Control structure | Native structure | Control structure |
| 80 initial helices (green) | 20 21 % | 20 20 % | 23 32 % | 12 12 % |
| 1,500 helices incl. 5’GC/GC3’ (blue) | 22 28 % | 48 21 % | 31 30 % | -1.7 8.5 % |
| 6,500 helices 15kT, 3bp (magenta) | 12 22 % | 27 12 % | 21 17 % | 14 8.6 % |
| 18,000 helices 10kT, 3bp (red) | 57 3.8 % | 15 10 % | 47 8.8 % | -7.2 12 % |
| simulation average (red) | NA | NA | 55 % | -1.1 % |
| B Experiments on different molecules | 53 9.1 % | 70 4.7 % | ||
| experiment average (black) | NA | 100 % (reference) | ||
| C Experiments on the same molecule | 75 4.6 % | 71 4.7 % | ||
| experiment average (brown) | NA | 75 % | ||
Adopting this heuristic numerical approach for the bare E. coli
16S rRNA, we simulated the force-induced unfolding pathway starting either from the known native secondary structure inside the ribosomeramakrishnan ; noller1 or from a low free-energy structure predicted by mfold, referred at, hereafter, as the “control structure” (http://bioinfo.math.rpi.edu/mfold/). The comparison between the force-extension responses of these two structures was primarily intended to probe the stochastic simulation’s sensitivity to the initial structure. In both cases, the role of helices not initially formed on the starting structure was studied, by allowing a variable number of helices to form and break during different stochastic simulations. The results in Fig 7 and Table 1 show that a reasonable agreement exists between the experimental measurements (black and brown curves) and the simulated force-extension responses starting from the known native structure, when all helices longer than 3bp and more stable than 10kT (i.e., 6 kcal/mol) are included a priori in the simulations (red curves). This demonstrates that some of these 18,000 different non-native helices play a significant structural role along the unfolding pathway. More quantitatively, cross-correlations amonsgt 4 independent simulated stretching curves (i.e., about 3 weeks of CPU on a 1.2GHz PC) reveal a good stochastic reproducibility in these simulations starting from the native structure and including about 18,000 possible helices: =57 3.8%. This is comparable to observed variations between experimental unfolding curves (see Table 1). Then comparing these individual simulations with the experiment average curve (black curve on Fig 5 from 4 independent experiments), we obtain a significative correlation coefficient: =478.8%, while correlating the experiment average (black) directly to the simulation average clearly reflects common features between the experimental response and the simulated unfolding pathway curve starting from the native structure: =55%. In addition, restricting simulations to the 6,500 possible helices longer than 3bp and stronger than 15kT (magenta curves) or including even fewer helices (blue and green curves), produces marked differences on the simulated stretching curves (Table 1 shows lower averages and larger standard deviations for the simulation stochastic reproducibility and for the correlations with experimental response). By contrast, equivalent stochastic simulations starting from the control structure (Fig 7) present clearly distinct results from experimental observations, i.e., 15% (even for a large number of possible helices included in the simulations). The fact that the stochastic reproducibility of these control simulations happens to decrease with the number of possible helices taken into account (Table 1) reflects the concomitant decrease of specific unfolding signal relative to the median line fit of the plateau (Fig 7). A decreasing signal over noise ratio naturally leads to a lower reproducibility of the simulated curves. The same trend is also visible between blue and magenta curves for simulations starting from the native structure.
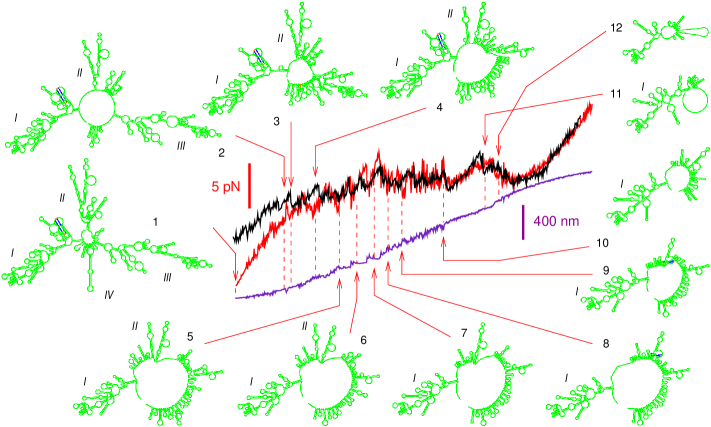
Fig 8 compares more closely a simulated force-extension response of the known native structure (red) and an experimental stretching curve (black). Again, both simple visual comparison and calculation of their correlation coefficient as above (here =61%) strongly suggest that the experimentally probed structure shares, indeed, more structural features with the actual native structure than with the control structure (Fig 7), in spite of the absence of ribosomal proteins in these single molecule stretching experiments of E. coli’s 16S rRNA. Analysing the unfolding pathway during the simulated force-extension response reveals that the main predicted unfolding events (corresponding to abrupt force drops on the red curve) are either related to the cooperative opening of several native helices (as in the unfolding of M3) or to the simultaneous rearrangements of mainly non-native helices leading to a stepwise increase of the predicted extension of the molecule along the direction of pulling (violet curve). This is illustrated with 12 successive snapshots of intermediate structures along the stretching-induced unfolding pathway. In particular, the 3’ major (III) and 3’ minor (IV) domains are shown to break and partially rearrange at the start of the stretching plateau (intermediates 2 to 4) while the 5’ domain (I), partially unfolded between intermediates 4 and 5, remains then largely intact until most other native and non-native helices have been opened under stretching (intermediate 11). Finally, the central domain (II) exhibits a more distributed unfolding fate which extends from intermediates 1 to 10. Hence, mechanical breaking of the native structure does not occur through successive openings of entire native domains. Instead, native helices contribute to a more complex (yet largely reproducible) sequence of force drops, reflecting also the rearrangements of non-native helices. For instance, this is the case for the recorded signal between intermediates 8 and 10 which is largely caused by successive rearrangements of weak non-native helices between 10kT and 15kT (compare magenta and red curves for the native structure on Fig 7 and experimental and simulated curves on Fig 8). In retrospect and more generally, these results underline the possible pitfalls in attempting to assign specific structural features of large RNA molecules by studying the mechanical unfolding of their independently folded domains separately.
Discussion
We have measured the force range to unfold RNA secondary structures by mechanical stretching experiments. It extends from 10 pN for AU rich to 25 pN for GC rich regions in agreement with intermediate values reported for intermediate G+C contents. We also showed that non-native rearrangements have a large influence on force-extension measurements of complex RNA structures, as in the case of E. coli’s 16S rRNA presented here.
Interestingly, this force-induced unfolding process of the bare 16S rRNA’s domains seems to mirror, only in reverse order, the predominant 5’ to 3’ polarity of the in vitro assembly of 16S rRNA into 30S ribosomal subunitsnoller . From a more general perspective, the high reproducibility of the mechanical unfolding curves shown here (e.g., Figs 4-5) sharply contrasts with the multiple folding and misfolding pathways usually experienced by RNA molecules of this size during thermal renaturation. This reflects the fact that unfolding/refolding pathways under mechanical constraint solely explore a restricted number of possible intermediate structures, as compared to unconstrained denaturation/renaturation folding experiments. In other words, single molecule unfolding and refolding experiments under mechanical control probe particular, well-defined pathways due to the slowly varying external constraint applied onto the ends of the RNA molecule. In addition, we found that the overall unfolding curves did not critically depend on the rate of pulling used (typically 300 nm/s); for instance, imposing
an extension rate twice as fast or twice as slow did not significantly modify the force-extension curves (data not shown). In retrospect, this restricted set of unfolding pathways and their relative insensitivity to the precise values of external parameters also explain why we could simulate these force-induced unfolding pathways starting from a given secondary structure, while predicting such 1540-nucleotide initial structure a priori is still beyond the current limitations of secondary structure prediction algorithms.
Despite clear similarities, the agreement between simulated and experimental force-extension responses in Fig 8 is uneven. In fact, variations between predicted (red) and measured (black) curves might reflect real differences between the probed structure and the actual native secondary structure inside the ribosomeramakrishnan ; noller1 used here as the intial structure in the simulations. In particular, deviations at the beginning of the stretching plateau might originate from alternative base pair (re)folding of the 3’ major domain (III) due to the absence of essential ribosomal proteins (e.g., as s7nowotny ) and Mg2+ ions. Moreover, the relatively short time scales (few seconds) of these stretching-induced unfolding/refolding experiments might not be sufficiently long to let 16S rRNA find its lowest free energy structure between successive pulls.
These results illustrate what should be expected, in general, when RNA secondary structures are probed by mechanical force. Strong helices resist until their breaking exposes weaker regions, which are unable to withstand such high forces. This leads to the unfolding of a significant domain with a concomitant force drop. A fraction of the unpaired bases then typically reform different helices, which compensate, in part, for the sudden relaxation of the mechanical tension. Yet, force-extension responses are not completely smoothed out, as initially suspectedmontanari ; bundschuh ; lubensky , by these local rearrangements. Instead, they reveal the slow dynamics of large scale cooperative changes in complex RNA structures. Tertiary interactions, likely marginal here due to the absence of Mg2+ ions, are expected to strengthen the unfolding cooperativity between interacting domains and, concomitantly, increase the reformation of non-native helices upon stretching.
Local rearrangements of RNA molecules, similar to those reported here, likely occur in vivo as well, in particular, during translation when large domains of messenger RNAs become unfolded upstream of the ribosome. In fact, the influence of long-lived intermediate structures is likely ubiquitous to the RNA folding problem itself, as slow structural rearrangements are known to occur in the context of both in vitro and in vivo RNA folding processeswilliamson1 ; woodson . New experimental tools are needed to better understand the strategies of RNA molecules in circumventing such kinetic traps (for instance through specific interactions with ions or proteinstreiber , through RNA chaperoneswoodson or co-transcriptional encoded folding pathwaysisambert ).
By exploring RNA structure energy landscapesfontana , micromanipulations combined with appropriate stochastic simulations can help address such questions, reflecting both structural and metastability features of single RNA molecules.
Added note:
Onoa et alonoa have recently reported experimental results on the mechanical unfolding of the L-21 derivative of Tetrahymena thermophila ribozyme, a 390-nucleotide catalytic RNA. By contrast with the present study which strictly focuses on the RNA secondary structure level (no Mg2+ added), Onoa et al primarily investigate the tertiary fold of this selfsplicing ribozyme in the presence of Mg2+. A variety of hysteresis responses to the applied force is presented for various parts of the molecule or in the presence of specific antisense oligos. A direct correlation between Mg2+-dependent unfolding events and the opening of specific native helices is proposed.
Materials and Methods
Sample displacement: Sample displacement is driven and monitored by a nanometer resolution piezoelectric stage with capacitive position sensor (P530-3, Physik Instrument). The piezoelectric stage position is controlled and monitored by a 0-10V voltage.
Optical tweezer: The optical tweezer consists of a Nd:Yag infra-red laser beam (TOPAZ, SpectraPhysics) focussed inside the capillary by a 1.3 N.A. x100 objective (Zeiss). The laser is always set at full power (2.5 W) and the stiffness of the trap is controlled by the amplitude of an acoustic wave generated by an acousto-optic modulator (A-A) placed right after the laser head. The experiments described here were performed with a 50% attenuation of the laser intensity, which sets the optical trap stiffness around 710-5 N/m. The bead displacement from the laser beam focus point is measured as follows: after passing through the sample, the bead diffused light is collected by a 0.6 N.A. x40 objective (Zeiss). The objective back focal plane is imaged by a lense of 40 mm focal length onto a two-quadrant photodetector (S5980, Hammamatsu). The whole experiment setup is mounted on an invar table so as to minimize thermal position drift. The photodiode electric currents and are converted into voltage and amplified by a home made amplifier. The voltage difference which is proportionnal to the distance of the bead away from the trap center is further amplified and filtered at 300 Hz by low noise amplifier (SR-50, Stanford Research Instrument). The total light intensity that is collected by the x40 objective measured by the voltage sum is also amplified.
Data acquisition: The monitoring voltage coming out of the piezoelectric driver, the voltage difference and the voltage sum coming out of the low noise amplifier are each directed into a separate channel of an acquisition board (ATMIO-16X, National Instrument). The driving voltage of the piezoelectric stage is generated by the same board. The acquisition rate is 300 Hz which sets the duration of the stretching/relaxing experiment around 10-20 seconds.
Calibration: The fourier power spectrum of a free bead inside the trap follows a lorentzian law as expected for brownian fluctuations. Fitting this curve with two parameters provides both the trap stiffness and the voltage/distance conversion factor. In the case of a pulling experiment, these two parameters are used to convert the ratio directly into piconewtons. The maximum force that can be measured with our setup is 60 pN. The bead position resolution inside the trap is 5 nm which sets the force resolution at 0.4 pN. The bead is captured at about 500-1000 nm from the capillary interior surface. The pUC19 dimer contour length is 1742 nm (0.33 nm/pb). The geometry imposes to displace the piezo stage by 48.8-56 nm and 985-1108 nm to completely unfolded the small RNA motifs and 16S rRNA, respectively.
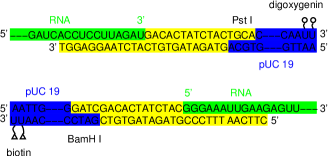
Molecule synthesis and functionalization: RNA molecules were synthesized by in vitro ”run off” transcription of EcorV linearized DNA plasmids. These plasmids were constructed by inserting DNA oligomers (IBA GmBh) starting with a T7 promotor region inside the BamHI-PstI region of pUC19. The RNA sequence was flanked by 12 nucleotides at both extremities to allow for the ligation with the double-stranded DNA arm extensions. In the case of 16S rRNA, the gene was isolated by PCR from pKK3535 plasmid (courtesy of K. Lieberman and H.F. Noller). It was cut by BstEII-BclI and then inserted in pUC19 together with oligomers carrying a T7 promotor with the DNA arm extensions and the complementary ends of the 16S sequence. The reconstructed plasmids were produced in competent DH5 alpha bacteria and were extracted and purified using Jetstar purification kit. They were further sequenced. Due to the small length of RNA molecules, there were extended with digoxygenin or biotin labelled dsDNA at, respectively, the 3’ and 5’ ends to enable grafting between the capilary glass surface and the silica bead. In practice, DNA oligomers (Fig 9) were first ligated to Pst I restricted digoxygenin labelled pUC19 to yield a 12-nucleotide 3’ extension complementary to the RNA 3’ end. Then, the DNA/RNA hybridization and ligation protocol was the following: RNA was heated to 90∘C for 5 minutes then quenched on ice. It was incubated with the former prepared pUC19 (molar ratio 100/1) at 70∘C for 20 minutes and then slowly cooled (0.6∘C/min) to 16∘C. At this temperature, T4 DNA ligase and buffer were added and the ligation reaction was carried over 4 hours at 16∘C. The band corresponding to the pUC19 molecular weight on a 0.7% agarose gel was purified using Qiaquick (Qiagen). The whole procedure was repeated with the RNA 5’ end using a BamH I restricted biotin labelled pUC19 DNA (Fig 9). The band corresponding to a pUC19 dimer molecular weight on a 0.7% agarose gel was purified using Qiaquick (Qiagen). In the case of the 16S RNA, the functionalization protocol was slightly modified. The oligomers were first hybridized with the RNA 3’ end following the heat-cooling protocol described above. The excess oligomers were washed away by 2 consecutive centrifugations at 4000 and 16∘C using GS-200 microspin column. The Pst I restricted digoxygenin labelled pUC19 DNA, T4 DNA ligase and buffer were added and the ligation reaction was carried over 4 hours at 16∘C. The same procedure was repeated with the 5’ end and the molecule was purified on an 0.7% agarose gel by cutting the band corresponding to a pUC dimer molecular weight. Prior to the experiment, the molecules are incubated with the streptavidin coated beads (Bangs Laboratories) for 30 minutes. The solution is introduced in the rectangular capillary by a peristatic pump which allows buffer circulation. All experiments were performed at room temperature and in Tris 10 mM pH 7 NaCl 250 mM buffer.
Acknowledgements
We thank K. Lieberman and H.F. Noller for kindly providing us with the pKK3535 plasmid, D. Evers and R. Giegerich for the use of their “RNAMovies” software, and L. Bourdieu, C. Ehresmann, S. Lodmell, T. Pan, M. Poirier and E. Westhof for discussions and suggestions. This work was supported in part by an ACI “Jeunes Chercheurs” grant from Ministère de la Recherche (France), an NOI grant from the CNRS, and by the “Physique et Chimie du Vivant” program of the CNRS.
References
- (1) Cluzel, P., Lebrun, A., Heller, C., Lavery, R., Viovy, J.-L., Chatenay, D. & Caron, F. DNA: an extensible molecule. Science 271, 792 (1996).
- (2) Smith, S.B., Cui, Y. & Bustamante, C. Overstretching B-DNA: the elastic response of individual double-stranded and single-stranded DNA molecules. Science 271, 795 (1996).
- (3) Léger, J.-F., Romano, G., Sarkar, A., Robert, J., Bourdieu, L., Chatenay, D. & Marko, J.F. Structural Transitions of a Twisted and Stretched DNA Molecule. Phys. Rev. Lett. 83, 1066 (1999).
- (4) Allemand, J.-F., Bensimon, D., Lavery, R. & Croquette, V. Stretched and overwound DNA forms a Pauling-like structure with exposed bases. Proc. Natl. Acad. Sci. USA 95, 14152 (1998).
- (5) Rief, M., Gautel, M., Oesterhelt, F., Fernandez, J.M. & Gaub, H.E. Reversible unfolding of individual titin immunoglobulin domains by AFM. Science 276, 1109 (1997).
- (6) Kellermayer, M.S.Z., Smith, S.B., Granzier, H.L. & Bustamante, C. Folding-unfolding transitions in single titin molecules characterized with laser tweezers. Science 276, 1112 (1997).
- (7) Rief, M., Pascual, J., Saraste, M. & Gaub, H.E. Single molecule force spectroscopy of spectrin repeats: low unfolding forces in helix bundles. J. Mol. Biol. 286, 553, (1999).
- (8) Liphardt, J., Onoa, B., Smith, S.B., Tinoco Jr., I. & Bustamante, C. Reversible unfolding of single RNA molecules by mechanical force. Science 292, 5517 (2001).
- (9) Montanari, A. & Mézard, M. Hairpin formation and elongation of biomolecules. Phys. Rev. Lett. 86, 2178 (2001).
- (10) Gerland, U., Bundschuh, R. & Hwa, T. Force-induced denaturation of RNA. Biophys. J. 81, 1324 (2001).
- (11) Lubensky, D.K. & Nelson D.R. Single molecule statistics and the polynucleotide unzipping transition. Phys. Rev. E 65, 031947 (2002).
- (12) Treiber, D.K. & Williamson, J.R. Exposing the kinetic traps in RNA folding. Curr. Opin. Struct. Biol. 9, 339-345 (1999).
- (13) Woodson, S.A. Recent insights on RNA folding mechanisms from catalytic RNA. Cell. Mol. Life Sci. 57, 796-808 (2000).
- (14) Rief, M., Clausen-Schaumann, H. & Gaub, H.E. Sequence-dependent mechanics of single DNA molecules. Nat. Struct. Biol. 6, 346 (1999).
- (15) Cocco, S., Monasson, R. & Marko, J.F. Force and kinetic barriers to initiation of DNA unzipping. Phys. Rev. E 65, 041907 (2002).
- (16) Mathews, D.H., Sabina, J., Zuker, M. & Turner, D.H. Expanded sequence dependence of thermodynamic parameters improves prediction of RNA secondary structure. J. Mol. Biol. 288, 911-940 (1999).
- (17) Isambert, H. & Siggia, E.D. Modeling RNA folding paths with pseudoknots: application to hepatitis delta virus ribozyme. Proc. Natl. Acad. Sci. USA, 97, 6515 (2000).
- (18) W. Saenger, in Principles of nucleic acid structure, (Springer-Verlag, New York, 1984).
- (19) Evers, D. & Giegerich, R. RNAMovies: visualizing RNA secondary structure spaces. Bioinformatics 15, 32-37 (1999).
- (20) Fersht, A.R. On the simulation of protein folding by short time scale molecular dynamics and distributed computing. Proc. Natl. Acad. Sci. USA 99, 14122-14125 (2002).
- (21) Wimberly, B.T., Brodersen, D.E., Clemons Jr, W.M., Morgan-Warren, R.J., Carter, A.P., Vonrhein, C., Hartsch, T. & Ramakrishnan, V. Structure of the 30S ribosomal subunit. Nature 407, 327-339 (2000).
- (22) Yusupov, M.M., Yusupova, G.Zh., Baucom, A., Lieberman, K., Earnest, T.N., Cates, J.H.D. & Noller, H.F. Crystal structure of the ribosome at 5.5 A resolution. Science 292, 883-896 (2001).
- (23) Press, W.H., Teukolsky, S.A., Veterling, W.T. & Flannery, B.P. Numerical recipes, 2nd Ed., University Press, Cambridge (1992).
- (24) Svoboda, K. & Block, S.M. Biological applications of optical forces. Annu. Rev. Biophys. Biomol. Struct. 23, 247 (1994).
- (25) Essevaz-Roulet, B., Bockelmann, U. & Heslot, F. Mechanical separation of the complementary strands of DNA. Proc. Natl. Acad. Sci. USA 94, 11935 (1997).
- (26) Gutell, R.R., Lee, J.C. & Cannone, J. The accuracy of ribosomal RNA comparative structure models. Curr. Opin. Struct. Biol. 12, 301-310 (2002).
- (27) Powers, T., Daubresse, G. & Noller, H.F. Dynamics of in vitro assembly of 16 S rRNA into 30 S ribosomal subunits. J. Mol. Biol. 232, 362-374 (1993).
- (28) Nowotny, V. & Nierhaus, K.H. Assembly of the 30S subunit from Escherichia coli ribosomes occurs via two assembly domains which are initiated by S4 and S7. Biochemistry 27, 7051-7055 (1988).
- (29) Treiber, D.K. & Williamson, J.R. Beyond kinetic traps in RNA folding. Curr. Opin. Struct. Biol. 11, 309-314 (2001).
- (30) Fontana, W., Stadler, P.F., Bornberg-Bauer, E.G., Griesmacher, T., Hofacker, I.L., Tacker, M., Tarazona, P., Weinberger, E.D. & Schuster, P. RNA folding and combinatory landscapes. Phys. Rev. E 47, 2083-2099 (1993).
- (31) Onoa, B., Dumont, S., Liphardt, J., Smith, S.B., Tinoco Jr., I. & Bustamante, C. Identifying kinetic barriers to mechanical unfolding of the T. thermophila ribozyme. Science 299, 1892 (2003).