The particle-in-cell model for ab initio thermodynamics: implications for the elastic anisotropy of the Earth’s inner core.
Abstract
We assess the quantitative accuracy of the particle-in-cell (PIC) approximation used in recent ab initio predictions of the thermodynamic properties of hexagonal-close-packed iron at the conditions of the Earth’s inner core. The assessment is made by comparing PIC predictions for a range of thermodynamic properties with the results of more exact calculations that avoid the PIC approximation. It is shown that PIC gives very accurate results for some properties, but that it gives an unreliable treatment of anharmonic lattice vibrations. In addition, our assessment does not support recent PIC-based predictions that the hexagonal ratio increases strongly with increasing temperature, and we point out that this casts doubt on a proposed re-interpretation of the elastic anisotropy of the inner core.
keywords:
Ab initio , Anisotropy , Core , ThermodynamicsPACS:
62.20.D , 62.50.+p , 71.15.Ap , 91.35.-xurl]http://www.cmmp.ucl.ac.uk/ mjg
1 Introduction
Ab initio calculations based on density functional theory (DFT) (Hohenberg and Kohn (1964); Kohn and Sham (1965); Jones and Gunnarsson (1989)) are widely used to calculate the properties of materials at the extreme pressures found in the interior of the Earth and other planets (Stixrude et al. (1998)), and are known to be capable of high accuracy. For many years, such calculations did not generally include thermal effects, and explicitly treated only zero-temperature materials. However, the past few years have seen an increasing effort to apply DFT calculations to high-temperature solids and liquids of geological interest, using ab initio lattice dynamics or molecular-dynamics simulation (Alfè et al. (2001, 2002); Belonoshko et al. (2000); Laio et al. (2000); Stixrude et al. (1997); Wasserman et al. (1996); Brodholt et al. (2002); Oganov et al. (2001); Steinle-Neumann et al. (2002)). Because dynamical DFT calculations demand large computer resources, a simplifying approximation known as the ‘particle-in-cell’ (PIC) method (Hirshfelder et al. (1954); Holt and Ross (1970); Holt et al. (1970); Ree and Holt (1973); Westra and Cowley (1975); Cowley et al. (1990)) has been used in some work on high-, high- solids, an important example being the very recent use of the PIC approximation to re-interpret the elastic anisotropy of the Earth’s solid inner core (Steinle-Neumann et al. (2001, 2002)). However, the reliability of the PIC method has not gone unchallenged (Alfè et al. (2001)) and conclusions based on it are not necessarily secure. To shed light on this question, we present here the results of our own PIC calculations of a range of thermodynamic properties of solid iron at Earth’s core conditions, which we compare with more exact calculations that avoid the PIC approximation.
The purpose of the PIC approximation is to provide a way of calculating the free energy of a vibrating crystal. The essence of the approximation is that correlations between the vibrational displacements of different atoms are neglected, so that each atom is treated as vibrating independently of every other, as in the Einstein model for a vibrating solid. Although the approximation seems at first sight rather crude, empirically it has been shown to yield satisfactory predictions for the thermodynamic properties of a number of solids (Holt and Ross (1970); Holt et al. (1970); Ree and Holt (1973); Westra and Cowley (1975)), at least for temperatures above the Debye temperature. In the geological context, it was shown by Wasserman et al. (1996) that, when implemented using DFT methods, it gives predictions for the relation on the shock Hugoniot in excellent agreement with experiment for Fe up to the melting curve. The PIC approach based on DFT has also been applied successfully to the high-, high- properties of other transition metals (Gülseren and Cohen (2001); Cohen and Gülseren (2002)).
In the work on the elastic anisotropy of the Earth’s inner core (Steinle-Neumann et al. (2001, 2002)) mentioned above, PIC was used to calculate the elastic constants of hexagonal-close-packed (hcp) Fe over a range of pressures and temperatures. A key prediction was that the ratio increases strongly with , and that this leads in turn to a strong -dependence of the elastic constants. It emerged from this that the observed anisotropy of seismic velocities in the inner core (Creager (1992); Song and Helmberger (1993); Tromp (1993)) could be interpreted in terms of a partial alignment of hcp crystallites. Remarkably, the calculations required the hcp basal plane to be preferentially aligned along the Earth’s rotational axis, which is the opposite of what had been proposed earlier (Stixrude and Cohen (1995); Steinle-Neumann et al. (1999)). Since the correctness of this interpretation depends heavily on the predicted variation of with , it is clearly essential to be confident that the PIC approximation can be relied on to give this variation correctly, and one of our aims in this paper is to test this point.
An objective assessment of the errors incurred by the PIC approximation is made possible by the fact that ab initio free energies and other thermodynamic functions of high-temperature solids can now be calculated with statistical-mechanical errors that can be made arbitrarily small. The new methods, described in detail in previous papers (Alfè et al. (2001, 2002)), are based on the DFT calculation of phonon frequencies in the harmonic approximation, supplemented by the ‘thermodynamic integration’ technique (Frenkel and Smit (1996)) for calculating anharmonic contributions. For a given material, and with a given DFT technique for calculating the electronic total energy as a function of ionic positions, we can therefore compute thermodynamic functions either with the PIC approximation or almost exactly. The differences between the two sets of results represent the errors caused by PIC. This is what we do in the present work. Since the main difference between PIC and the newer, more exact methods is that the latter fully include vibrational correlations, we shall refer to these in the following as ‘vibrationally correlated’ calculations.
Two main claims have been made for the PIC method (Wasserman et al. (1996)): First, that it provides a simple and reasonably accurate way of including the effect of the anharmonicity of lattice vibrations on thermodynamic properties; and second, that, even in the absence of anharmonicity, it is computationally much less demanding than more precise methods. Our assessment of these claims for the case of high-/high- Fe will suggest that neither is necessarily true, but that nevertheless the PIC method does yield surprisingly accurate predictions for many thermodynamic properties. We shall elucidate the reasons why PIC is often accurate. As we shall see, however, the present work does not support the prediction that the ratio of hcp Fe increases strongly with temperature, and this casts doubt on the proposed re-interpretation of the elastic anisotropy of the Earth’s inner core.
The remainder of the paper is organised as follows. In Sec. 2, we describe how we have applied PIC to hcp Fe and how we have separated the various contributions to the free energy and other thermodynamic functions; at the end of Sec. 2, we summarise the DFT techniques. In Sec. 3, we describe the details of our free-energy calculations and highlight their implications for the temperature dependence of the ratio. We then present results for several thermodynamic quantities calculated in the PIC approximation, which we compare with the earlier PIC results of Cohen and co-workers (Stixrude et al. (1997); Steinle-Neumann et al. (2001, 2002); Wasserman et al. (1996)) and with the vibrationally correlated results of Alfè et al. (2001). Discussion and conclusions follow in Sec. 4.
2 Techniques
2.1 Particle-in-cell approximation
In classical statistical mechanics, the ab initio Helmholtz free energy of a vibrating solid containing ions is:
| (1) |
where is the ab initio total electronic free energy of the system when the ionic positions are and is the thermal wavelength. It should be noted that depends on the volume and temperature of the system (), and for an hcp crystal it also depends on the axial ratio, denoted here by ; for the moment we do not indicate explicitly the dependence on , and . Two other points should also be recalled. First, the quantity is a free energy, because the electrons are treated as being in thermal equilibrium for each set of ionic positions, at a temperature equal to the temperature of the system as a whole. Second, the use of classical statistical mechanics, i.e. the neglect of quantum effects in the nuclear motions, is fully justified at Earth’s core temperatures (Alfè et al. (2001)).
The PIC approach consists in replacing in the above formula by the approximate form , given by:
| (2) |
Here, is the ab initio free energy of the system when all ions are at their perfect-lattice positions , and is defined to be the change of energy when ion is displaced from its perfect-lattice position to the position , all other ions being held fixed at their perfect-lattice positions. With replaced by in Eqn. (1), the PIC approximation for the free energy is:
| (3) |
where the PIC vibrational free energy per atom is:
| (4) |
The problem is thus reduced to the calculation of a three-dimensional integral, which can be performed numerically.
Our later analysis depends on a clear separation of harmonic and anharmonic contributions to , which can be accomplished by considering the series expansion of in powers of ionic displacement :
| (5) |
where the Greek indices , … indicate Cartesian components. The value of when we retain only the quadratic part of is the harmonic vibrational free energy in the PIC approximation, denoted by . This can be expressed as:
| (6) |
Here are the three PIC vibrational frequencies, given by , with the ionic mass. The geometric-mean frequency is defined by Eqn. (6). The anharmonic contribution to the free energy is the part of not accounted for by , so that .
The PIC results reported in Sec. 3 were obtained by computing for a set of vector displacements , and fitting the results using the power series expansion of Eqn. (5); in practice, for the range of displacements that occur with appreciable probability at temperatures below the melting temperature, we find that an extremely accurate fit is obtained if we retain only terms up to quartic order in . To show what parameters enter this fit, we write this quartic polynomial explicitly for the case of hcp symmetry:
| (7) |
Here, and are perpendicular Cartesian components in the basal plane, the -axis being oriented towards a nearest-neighbour, and is the displacement along the hexagonal axis. The frequencies of harmonic vibration in the basal plane and along the hexagonal axis are and respectively. This symmetrised polynomial expression may be obtained to a given order by writing down all possible terms in a polynomial of that order, and retaining only those terms which leave the expression invariant under all the point symmetry operations of the chosen cell. In the case of hcp symmetry, these include reflection in the hexagonal () plane, rotations of about the hexagonal axis, and reflection in the – plane. With the above form of , the geometric-mean frequency given by
| (8) |
The vibrational free energy is obtained essentially exactly by numerical evaluation of the integral in Eqn. (4) on a regular grid. In analysing the anharmonic contributions, it is useful to note that can be expanded as a power series in temperature:
| (9) |
For temperatures below the melting point, we find that only the term in is significant, so that in practice the anharmonic contributions are completely specified by the coefficient as a function of volume and ratio . The following exact expression for the coefficient is readily obtained:
| (10) |
The above methods are used to obtain contributions to the free energy at a reference value of , chosen to be close to the equilibrium value. We then perform further calculations over a range of values of , to obtain corrections to the free energy components, which are parameterised in terms of and . The details of this parameterisation are given in Sec. 3.1 and 3.2. Equilibrium values of are found by direct minimisation of the total free energy.
2.2 Ab initio methods
The DFT electronic-structure techniques used to perform the PIC calculations are essentially identical to those described by (Alfè et al. (2001, 2002)). The exchange-correlation functional is the generalised gradient approximation (GGA) of Perdew and Wang (Wang and Perdew (1991); Perdew et al. (1992)). The implementation of DFT is the projector augmented wave (PAW) scheme (Blöchl (1994); Kresse and Joubert (1999)), with core radii, augmentation charge radii etc set to the values reported in Alfè et al. (2000). As before, all atomic states up to and including -states are treated as core states, but the high-pressure response of - and -states, known to be important at Earth’s-core conditions, is included via an effective pair potential; the accuracy of this procedure has been demonstrated earlier (Alfè et al. (2001)). Thermal excitation of electrons, also important at core conditions, is treated with the usual finite-temperature formulation of DFT (Mermin (1965); Gillan (1989); Wentzcovitch et al. (1992)). We used a plane-wave cut-off of 300 eV, as in our previous work. All calculations were performed with the VASP code (Kresse and Furthmüller (1996a, b)).
The PIC vibrational potential (see Eqn. (2)) should in principle be calculated by displacing a single atom in an infinite crystal. Because PAW calculations require periodic boundary conditions, we must instead use supercell geometry, so that the displaced atom has periodic images. To adhere to the PIC scheme, we must therefore ensure convergence of all results with respect to the size of the supercell, as described in the following Section.
3 Results
3.1 Free energy of perfect lattice
DFT results for the free energy of the hcp Fe perfect lattice for the fixed ratio equal to 1.60 were reported earlier (Alfè et al. (2001)) for values from 5.2 to 11.4 Å3/atom at temperatures from 200 to K. At each value, the results were fitted to a Burch-Murnaghan equation of state (Poirier (2000)), the parameters of which were then fitted as polynomial functions of . We have repeated these calculations for the present work, and as expected the results are virtually identical to those reported earlier.
To allow for variation of , we have performed additional calculations of for in the range from 1.48 to 1.72, with going from 5.5 to 10.5 Å3/atom, and going from 2000 to 8000 K. All technical parameters, such as the Monkhorst-Pack sampling set, were kept the same as in the calculations. To represent the results, we define the deviation of the perfect-lattice free energy from its value at a chosen of , denoted by : . In the present case, has the fixed value 1.60 throughout. We find that can be very accurately represented at all by the quadratic form:
| (11) |
At each value, and can be accurately fitted as linear functions of , the coefficients of which are in turn fitted linearly in . These fits give a virtually perfect representation of the results. Writing , and with and similarly for , and , the numerical values of the parameters are , , , , , , and . Units of coefficients are such that is in eV, in K and in Å3.
The equilibrium value of the perfect lattice, denoted by , is obtained by minimising with respect to . At , we find a very weak dependence of on , going from 1.590 at 7.0 Å3/atom to 1.578 at 10.0 Å3/atom. The -dependence of is also very weak, with decreasing linearly from 7.4 to 6.2 eV, and increasing from 1.59 and 1.62 as temperature varies from 2000 to 8000 K. If we now use the results to predict for the (hypothetical) high- perfect lattice, we find a variation of at most 0.04 at a volume of 10.0 A3. The insignificant - and -dependence of is noteworthy, because it implies that any significant variation of at high temperatures can come only from lattice vibrations, to which we now turn.
3.2 Vibrational free energy
The basal-plane and axial frequencies and , and the four anharmonic vibrational coefficients , , and were calculated as follows. For given values of and , a supercell was constructed in which one of the atoms, the ‘walker’ is displaced from its equilibrium position. The ‘walker’ is given a series of equally spaced displacements in the three directions , and , the maximum displacements in each direction being chosen so that the Boltzmann factor for the maximum temperatures of interest. Directions were selected to allow the terms in (Eqn. (7)) to be determined as simply as possible by least squares fitting. Size convergence in terms of supercells is essential to ensure that the walker cannot ‘see’ its image. We discuss the results of a simple convergence test below. All the calculations described here are performed at a fixed electronic temperature of 6000 K, since statistical mechanical considerations will dominate the temperature dependence of . At this temperature, vibrational coefficients were fully converged with respect to -point sampling at each cell size. Monkhorst-Pack (Monkhorst and Pack (1976)) sampling was used, with -points for the 8 atom cell, -points for 16 atoms and for 36. Calculations were performed over a range of volumes from 5.5 Å3/atom to 11.5 Å3/atom with a fixed axial ratio of as before. Using 5th order polynomials to obtain a high quality fit, the quantities , , , and were then parameterised in terms of volume. Finally, a correction due to relaxation of is added to the harmonic free energy, as for that of the perfect lattice, by performing a parameterisation of in terms of , which we describe below. Parameterisation of higher order coefficients in terms of yielded only negligible corrections to the – curve.
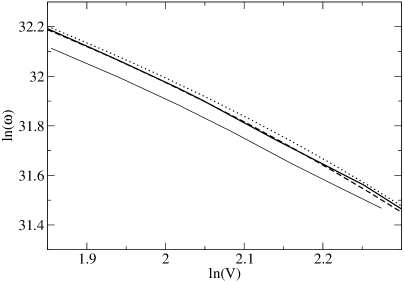
As noted in Sec. 2.1, the harmonic free energy is completely determined by the geometric-mean frequency (Eqns. (6) and (8)), and we consider first our PIC results for as a function of for the fixed ratio . We report in Fig. 1 our results from calculations using supercells of 8, 16 and 36 atoms, compared with the results from our earlier calculations of the full phonon spectrum (Alfè et al. (2001)). We note two important points. First, the PIC results are almost independent of supercell size, so that the calculations appear to be fully converged with respect to size effects. Second, the PIC differs from the full-phonon only by a volume-independent shift of . Since such a -independent shift cannot affect most thermodynamic quantities, we expect the PIC calculations to agree rather closely with full-phonon calculations.
We now consider the dependence of on ratio , defining the logarithmic deviation from its value at by . In terms of this, the harmonic free energy can be written as:
| (12) |
Calculations of were made for -values going from 1.48 to 1.72 at a series of volumes. We find that decreases with increasing . Not surprisingly, increase of at constant yields an increase of the basal-plane frequency and a decrease of axial frequency . The decrease of succeeds in outweighing the increase of in the formula for (Eqn. (8)), but nevertheless the resulting decrease of is a fairly marginal effect. Over the -range studied, we found that the quadratic form gives an accurate fit, and this fit was performed at volumes of 5.5, 7.0 and 10.5 Å3/atom. The -dependence of the resulting and coefficients was obtained by a quadratic fit. Writing and similarly for , the values of the parameters are , , , , and . Units of parameters are such that is in rad s-1 and is in Å3.
From the values of the four anharmonic coefficients at each and , we calculate also the anharmonic vibrational free energy . As explained in Sec. 2.1, the most accurate way of doing this is by explicit calculation of (Eqn. (4)) by numerical evaluation of the integral over displacement , from which is obtained as the difference . Alternatively, we can use Eqn. (10) to calculate the coefficient of the leading term in the temperature expansion of (see Eqn. (9)). In practice, we find that the two methods yield almost indistinguishable results, and everything that follows is based on evaluation of the coefficient.
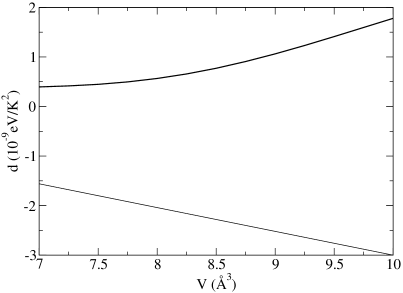
We report in Fig. 2 the volume dependence of for , compared with the corresponding anharmonicity coefficient obtained from the vibrationally correlated results of Alfè et al. (2001). The coefficients of this fit are as follows: , , , , , where , being in eV K-2 and in Å3. Corresponding data is given in Alfè et al. (2001). The striking and important feature of this comparison is that the PIC anharmonic free energy is positive, whereas the results of Alfè et al. (2001) show that in reality it is negative. This means that for high- hcp Fe, the PIC approximation gives a completely incorrect account of anharmonicity, the electronic structure techniques in both works being identical. However, we note that is in any case very small. For example, at Å3/atom, K, meV/atom. Because it is so small, we ignore its dependence on in the following, and use a polynomial fit to the results for .
3.3 Temperature dependence of ratio
The equilibrium value of the ratio at given and is obtained by minimising the total free energy with respect to . The variation of with comes from the - and -dependence of the perfect-lattice free energy , for which we presented results in Sec. 3.1, and from the -dependence of the mean vibrational frequency (Eqn. (6)). (Since we neglect the -dependence of the anharmonic component of free energy, anharmonicity does not contribute to the -dependence of here.)
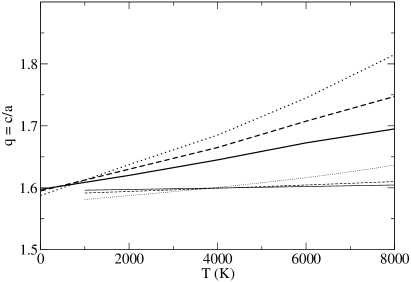
Our results for at three different volumes are reported in Fig. 3, where we compare them with the earlier PIC predictions of Steinle-Neumann et al. (2001, 2002). The present results are very different from the earlier ones. At all volumes, we find only a very weak increase of with , which is between 5 and 10 times smaller than the variation reported in Steinle-Neumann et al. (2001). We note that this gross discrepancy can come only from a difference in the -dependence of the harmonic mean frequency . The reason for this is that the roughly linear dependence of on seen in both our results and those of Steinle-Neumann et al. (2001) cannot originate either from thermal electronic excitations or from anharmonicity, since both of these free-energy components vary as . The cause of the discrepancy, and its implications for understanding the elastic anisotropy of the inner core, are discussed further in Sec. 4.
3.4 Thermodynamic functions
All thermodynamic functions can be calculated by taking appropriate derivatives of the PIC free energy , with its perfect-lattice, harmonic and anharmonic components parameterised as described above. All the results to be presented include the dependence of the equilibrium ratio on and . Our PIC predictions will be compared with the earlier PIC results of Wasserman et al. (1996) and with the vibrationally correlated results of Alfè et al. (2001).
We begin by considering the thermal pressure , which is one of the most basic quantities in interpreting the properties of the inner core. This is defined as the difference between the pressure in the material at a given and and the pressure at the same volume but at zero temperature:
| (13) |
Fig. 4 shows a comparison of our PIC results for with the vibrationally correlated results of Alfè et al. (2001) on isotherms at , 4000 and 6000 K. The rather close agreement shows that the PIC approximation gives an accurate account of the thermal pressure. This is expected from our results for , since in the harmonic approximation is given by the electronic thermal pressure, which is exactly the same in both calculations, plus a vibrational contribution equal to . We have seen that for hcp Fe, the PIC value of differs from the exact value by an almost constant offset, which has no effect on the derivative of with respect to . Small differences between the PIC and vibrationally correlated thermal pressure may be due to small variations in the offset between the values of .
The situation is similar for the thermal energy , defined as the difference between the internal energy at a given and and the internal energy at the same but zero temperature: . The electronic part of the thermal energy is identical in both PIC and vibrationally correlated calculations, and the harmonic vibrational energy is exactly /atom in both cases, so that any difference arises only from the small anharmonic contribution. Results for the thermal energy are not presented here.
The good accuracy of PIC for thermal pressure and thermal energy explains why it has also been found to give a good account of shock measurements (Wasserman et al. (1996)). A conventional sequence of shock experiments on samples in the same initial state generates a path through thermodynamic state-space known as the Hugoniot. On this path, the pressure , volume and internal energy are related by the Rankine-Hugoniot formula (Poirier (2000)):
| (14) |
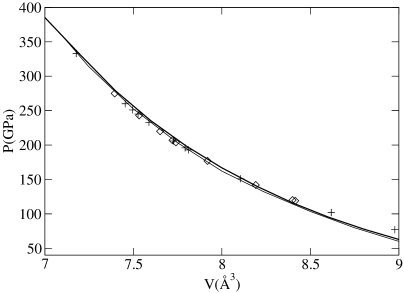
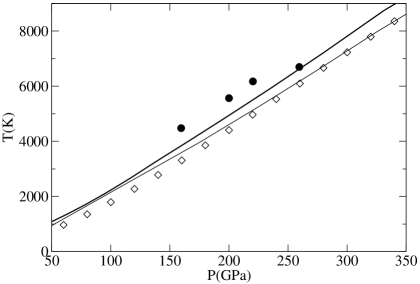
where , and refer to the initial state, which usually corresponds to ambient conditions. For given , the Hugoniot and temperature can be determined by going to the calculated and functions and seeking the value of for which and satisfy eqn (14). Fig. 5 shows our calculated PIC on the Hugoniot compared with the experimental results and with the fully correlated results of Alfè et al. (2001). The almost exact agreement between the three sets of results confirms the excellence of PIC for this particular purpose. Similar comparisons are shown for the relation on the Hugoniot in Fig. 6. Here there is a discrepancy, which corresponds to a difference in internal energy between the two theoretical models. This difference is fully accounted for by the neglect of temperature dependence of in the present work.
We conclude the presentation of results by examining three thermodynamic quantities for which our comparisons between vibrationally correlated calculations and the earlier PIC results of Wasserman et al. (1996) and Stixrude et al. (1997) revealed significant differences (Alfè et al. (2001)).
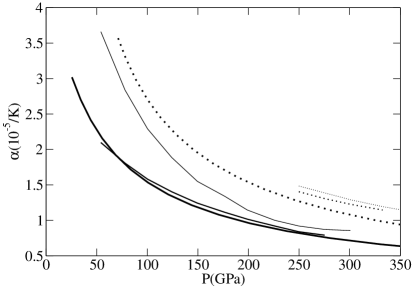
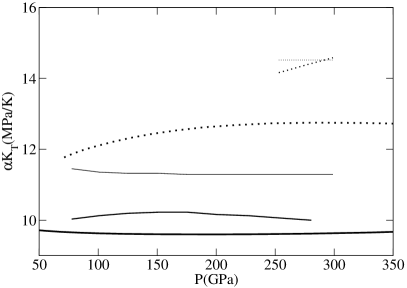
Fig. 7 compares the present PIC results for thermal expansivity with earlier calculations. At 2000 K, the present results are in very close agreement with the vibrationally correlated results, and in strong disagreement with the earlier PIC results at low pressures. At higher , the present results fall somewhat below both previous sets of results. The product (Fig 8) of expansivity and isothermal bulk modulus is important in high-pressure work, because it can sometimes be assumed to be independent of and over a wide range of conditions. The vibrationally correlated calculations showed that for high-/high- hcp Fe constancy with is a good approximation, but constancy with is not. The present PIC results show a reduction of with respect to vibrationally correlated and earlier PIC results of, at most, around 15% at 6000K.
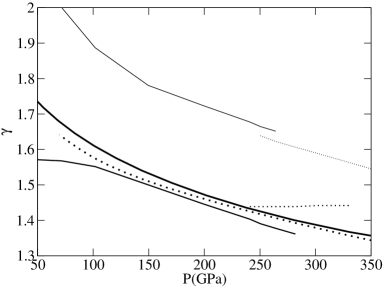
The thermodynamic Grüneisen parameter is particularly important, because it relates thermal pressure to thermal energy, and assumptions about are often used in reducing shock data from Hugoniot to isotherm. The large differences between the earlier PIC results and the vibrationally-correlated results for are therefore a cause for concern (Alfè et al. (2001)). The present PIC results (Fig. 9) agree quite closely with the vibrationally-correlated results, and this suggests that the cause of the earlier disagreement was not the PIC approximation itself.
4 Discussion
Our comparisons with more exact calculations have shown that the PIC approximation gives very good results for a range of important thermodynamic properties of hcp Fe at Earth’s core conditions. A noteworthy example of this is that on the Hugoniot agrees almost perfectly with the more exact results. Our analysis of the free energy into different components makes clear why PIC is so good. The perfect-lattice component is exactly the same in the two approaches. For the harmonic component, the sole requirement for good results is that the logarithmic derivative of the geometric mean frequency be correct. But we have seen that for hcp Fe the PIC differs from the given by calculation of the full phonon spectrum by an almost constant factor over a wide range of volumes, so that this requirement is satisfied. The basic reason for this is that the phonon dispersion relations of hcp Fe scale by a uniform factor with changing volume (see Fig. 3 of Alfè et al. (2001)). Finally, the anharmonic component of free energy is very small, and has only a very minor effect on most thermodynamic functions. The reliability of PIC actually requires that anharmonic effects be small, since we have shown that the PIC approximation misrepresents these effects in predicting the wrong sign of the anharmonic free energy.
Surprisingly, even though PIC appears to be so good, we find important discrepancies with the earlier PIC results of Stixrude et al. (1997) and Wasserman et al. (1996). In particular, our calculations of the thermodynamic Grüneisen parameter agree much more closely with the calculations of Alfè et al. (2001). These discrepancies are clearly not due to PIC itself, but must come from other technical differences. We note that in the work of Wasserman et al. (1996), the PIC calculations actually employed a tight-binding representation of the total energy function, the parameters in the tight-binding model being fitted to ab initio calculations. Conceivably, the tight-binding fit might have led to errors.
Even more surprising is that the strong increase with temperature of the axial ratio predicted by recent PIC calculations is not reproduced at all by the present PIC work. According to Steinle-Neumann et al. (2001), at the atomic volume of 7.11 Å3, increases from 1.63 to 1.75 as goes from 2000 to 8000 K, whereas in the present PIC calculations at the similar volume of 7.0 Å3, increases only from 1.594 to 1.610 over the same temperature range. The correctness of the weak variation found here is supported by preliminary calculations (Alfé (2002)) using the techniques of Alfè et al. (2001, 2002). The reasons for this discrepancy are completely unclear at present. The discrepancy has major implications for our understanding of the Earth’s inner core, because the recently proposed re-interpretation of the elastic anisotropy of the inner core appears to depend crucially on a strong variation of . We believe it is highly desirable that this question be re-examined by other research groups.
Our work sheds light on the usefulness of the PIC approximation. Since we have seen that PIC cannot be relied on for anharmonic contributions, it should be regarded as a way of calculating the geometric-mean harmonic frequency . But PIC requires ab initio calculations on a periodic system in which a single atom is displaced from its perfect-lattice site. These are precisely the same calculations that are performed in order to obtain the force-constant matrix used to compute the full phonon spectrum (Alfè et al. (2001, 2002)). For an ab initio method that yields forces on all ions – which includes the pseudopotential and PAW implementations of DFT, among others – the net result of the PIC procedure is to discard all the information contained in the ionic forces, retaining only the variation of total energy with displacement. This suggests that it may be better to use the force information to compute the force-constant matrix and hence the full phonon spectrum, rather than adopting the PIC approach.
References
- Alfé (2002) Alfé, D., 2002. Unpublished.
- Alfè et al. (2000) Alfè, D., Kresse, G., Gillan, M. J., 2000. Structure and dynamics of liquid iron under Earth’s core conditions. Phys. Rev. B 61, 132.
- Alfè et al. (2001) Alfè, D., Price, G. D., Gillan, M. J., 2001. Thermodynamics of hexagonal-close-packed iron under Earth’s core conditions. Phys. Rev. B 64, 045123.
- Alfè et al. (2002) Alfè, D., Price, G. D., Gillan, M. J., 2002. Iron under Earth’s core conditions: Liquid-state thermodynamics and high-pressure melting curve from ab initio calculations. Phys. Rev. B 65, 165118.
- Belonoshko et al. (2000) Belonoshko, A. B., Ahuja, R., Johansson, B., 2000. Quasi-ab initio molecular dynamic study of Fe melting. Phys. Rev. Lett. 84, 3638.
- Blöchl (1994) Blöchl, P. E., 1994. Projector augmented-wave method. Phys. Rev. B 50, 953.
- Brodholt et al. (2002) Brodholt, J., Oganov, A., Price, D., 2002. Computational mineral physics and the physical properties of perovskite. Phil. Trans. Roy. Soc. 360, 2507.
- Brown and McQueen (1986) Brown, J. M., McQueen, R. G., 1986. Phase-transitions, Grüneisen-parameter and elasticity for shocked iron between 77-GPa and 400-GPa. J. Geophys. Res., [Space Phys] 91, 7485.
- Cohen and Gülseren (2002) Cohen, R. E., Gülseren, O., 2002. High-pressure thermoelasticity of body-centered-cubic tantalum. Phys. Rev. B 65, 064103.
- Cowley et al. (1990) Cowley, E. R., Gross, J., Gong, Z. X., Horton, G. K., 1990. Cell-cluster and self-consistent calculations for a model sodium-chloride crystal. Phys. Rev. B 42, 3135.
- Creager (1992) Creager, K. C., 1992. Anisotropy of the inner core from differential travel-times of the phases pkp and pkikp. Nature 356, 309.
- Frenkel and Smit (1996) Frenkel, D., Smit, B., 1996. Understanding Molecular Simulation. Academic, San Diego.
- Gillan (1989) Gillan, M. J., 1989. Calculation of the vacancy formation energy in aluminium. J. Phys.: Condens. Matter 1, 689.
- Gülseren and Cohen (2001) Gülseren, O., Cohen, R. E., 2001. Thermal equation of state of tantalum. Phys. Rev. B 63, 224101.
- Hirshfelder et al. (1954) Hirshfelder, J. O., Curtiss, C. F., Bird, R. B., 1954. Molecular Theory of Gases and Liquids. John Wiley and Sons, Inc, New York.
- Hohenberg and Kohn (1964) Hohenberg, P., Kohn, W., 1964. Inhomogeneous electron gas. Phys. Rev. 136, B864.
- Holt et al. (1970) Holt, A. C., Hoover, W. G., Gray, S. G., Shortle, D. R., 1970. Comparison of the lattice-dynamics and cell-model approximations with Monte-Carlo thermodynamic properties. Physica 49, 61.
- Holt and Ross (1970) Holt, A. C., Ross, M., 1970. Calculations of the Grüneisen parameter of some models of the solid. Phys. Rev. B 1, 2700.
- Jones and Gunnarsson (1989) Jones, R. O., Gunnarsson, O., 1989. The density functional formalism, its applications and prospects. Rev. Mod. Phys. 61, 689.
- Kohn and Sham (1965) Kohn, W., Sham, L., 1965. Self-consistent equations including exchange and correlation effects. Phys. Rev. 140, A1133.
- Kresse and Furthmüller (1996a) Kresse, G., Furthmüller, J., 1996a. Efficiency of ab initio total energy calculations for metals and semiconductors using a plane-wave basis set. Comput. Mater. Sci. 6, 15.
- Kresse and Furthmüller (1996b) Kresse, G., Furthmüller, J., 1996b. Efficient iterative schemes for ab initio total-energy calculations using a plane-wave basis set. Phys. Rev. B 54, 11169.
- Kresse and Joubert (1999) Kresse, G., Joubert, D., 1999. From ultrasoft pseudopotentials to the projector augmented-wave method. Phys. Rev. B 59, 1758.
- Laio et al. (2000) Laio, A., Bernard, S., Chiarotti, G. L., Scandolo, S., Tosatti, E., 2000. Physics of iron at Earth’s core conditions. Science 287, 1027.
- Mermin (1965) Mermin, N. D., 1965. Thermal properties of the inhomogeneous electron gas. Phys. Rev. 137, A1441.
- Monkhorst and Pack (1976) Monkhorst, H. J., Pack, J. D., 1976. Special points for Brillouin-zone integrations. Phys. Rev. B 13, 5188.
- Oganov et al. (2001) Oganov, A. R., Brodholt, J. P., Price, G. D., 2001. The elastic constants of MgSiO3 perovskite at pressures and temperatures of the Earth’s mantle. Nature 411, 934.
- Perdew et al. (1992) Perdew, J. P., Chevary, J. A., Vosko, S. H., Jackson, K. A., Pederson, M. R., Singh, D. J., Fiolhais, C., 1992. Atoms, molecules, solids and surfaces - applications of the generalized gradient approximation for exchange and correlation. Phys. Rev. B 46, 6671.
- Poirier (2000) Poirier, J.-P., 2000. Introduction to the Physics of the Earth’s Interior, 2nd Edition. Cambridge University Press, Cambridge.
- Ree and Holt (1973) Ree, F. H., Holt, A. C., 1973. Thermodynamic properties of the alkali-halide crystals. Phys. Rev. B 8, 826.
- Song and Helmberger (1993) Song, X. D., Helmberger, D. V., 1993. Anisotropy of Earth’s inner-core. Geophys. Res. Lett. 20, 2591.
- Steinle-Neumann et al. (1999) Steinle-Neumann, G., Stixrude, L., Cohen, R. E., 1999. First-principles elastic constants for the hcp transition metals Fe,Co, and Re at high pressure. Phys. Rev. B 60, 791.
- Steinle-Neumann et al. (2002) Steinle-Neumann, G., Stixrude, L., Cohen, R. E., 2002. Physical properties of iron in the inner core. In: Dehant, V., Creager, K., Zatman, S., Karato, S.-I. (Eds.), Core structure, dynamics and rotation. American Geophysical Union, Washington, DC, pp. 137–161.
- Steinle-Neumann et al. (2001) Steinle-Neumann, G., Stixrude, L., Cohen, R. E., Gülseren, O., 2001. Elasticity of iron at the temperature of the Earth’s inner core. Nature 413 (6851).
- Stixrude and Cohen (1995) Stixrude, L., Cohen, R. E., 1995. High-pressure elasticity of iron and anisotropy of Earth’s inner-core. Science 267, 1972.
- Stixrude et al. (1998) Stixrude, L., Cohen, R. E., Hemley, R. J., 1998. Theory of minerals at high pressure. Rev. Mineral. 37, 639.
- Stixrude et al. (1997) Stixrude, L., Wasserman, E., Cohen, R. E., 1997. Composition and temperature of Earth’s inner core. J. Geophys. Res., [Space Phys] 102, 24729.
- Tromp (1993) Tromp, J., 1993. Support for anisotropy of the Earth’s inner-core from free oscillations. Nature 366, 678.
- Wang and Perdew (1991) Wang, Y., Perdew, J. P., 1991. Correlation hole of the spin-polarized electron gas, with exact small-wave-vector and high-density scaling. Phys. Rev. B 44, 13298.
- Wasserman et al. (1996) Wasserman, E., Stixrude, L., Cohen, R. E., 1996. Thermal properties of iron at high pressures and temperatures. Phys. Rev. B 53, 8296.
- Wentzcovitch et al. (1992) Wentzcovitch, R. M., Martins, J. L., Allen, P. B., 1992. Energy versus free-energy conservation in 1st-principles molecular-dynamics. Phys. Rev. B 45, 11372.
- Westra and Cowley (1975) Westra, K., Cowley, E. R., 1975. Cell-cluster expansion for an anharmonic solid. Phys. Rev. B 11, 4008.
- Yoo et al. (1993) Yoo, C. S., Holmes, N. C., Ross, M., Webb, D. J., Pike, C., 1993. Shock temperatures and melting of iron at Earth core conditions. Phys. Rev. Lett. 70, 3931.