Reversible BA Transitions in Single DNA Molecule Immersed in A Water Drop
Abstract
Clarification of the detailed mechanisms involved in the DNA polymorphism is an important challenge for computational molecular biophysics. This paper reports about reversible AB transitions in DNA observed in silico in a simulated titration experiment by smooth variation of the size of a water drop around a double helical solute. The estimated range of hydration numbers corresponding to the BA transition roughly agrees with experimental data. The chain length dependence was studied and it appeared that the transition to A-form is hindered when the fragment becomes shorter than one helical turn. Dynamics of the AB transition at low hydration is cooperative and is driven mainly by medium range electrostatic interactions of counterions sandwiched between phosphate strands in the major groove. The correspondence of these computational observations to common experimental conditions of AB transitions is discussed.
Introduction
The transformation from B-DNA Watson:53 to dehydrated A-DNA Franklin:53 in fibers was one of the first reversible structural transitions observed in a biomolecule. These structures represent right-handed helical duplexes with identical topologies and hydrogen bonding, and yet they have strongly different shapes Saenger:84 ; Calladine:92 . The B helix is long and narrow, with stacked base pairs forming the core of the helix. In contrast, the A-DNA structure is short and thick, with strongly inclined base pairs wrapping around a 6 Å solvent accessible cylindrical hole. The B-form is the dominant biological conformation of DNA whereas the A-form is considered as a high energy state that some sequences can adopt temporarily during various biological functions Ivanov:95 . Indeed, local A-DNA motives are rather common in crystal structures of protein-DNA complexes Timsit:99 ; Lu:00 . The AB polymorphism is currently considered as one of the modes for governing protein-DNA interactions Ng:00 .
A complete BA transition in a long mixed sequence DNA can be obtained in vitro in a few special conditions. In crystalline Franklin:53 ; Leslie:83 and amorphous Piskur:95 fibers as well as in films Tunis-Schneider:70 , it is induced by equilibrating the samples under reduced relative humidity or with the concentration of organic solvents increased to 80% Zimmerman:83a . Organic solvents can also provoke BA transition in an isolated DNA molecule in solution Ivanov:83 . The transition is reversible and cooperative, Ivanov:73 ; Ivanov:74 which means that it occurs concertedly in an extended DNA fragment rather than randomly in separate nucleotides. The characteristic length of such fragment, however, is is rather small. Originally, it was estimated as 20 base pairs Ivanov:74 , but later this estimate was reduced to 10 base pairs Ivanov:83 , that is approximately one helical turn. DNA fragments shorter than this length generally do not go to the A-form in solution Fairall:89 ; Galat:90 . For some sequences, however, short DNA fragments could be crystallized in the A-form Conner:82 ; NDB: . Under physiological conditions in vitro, the A/B balance depends upon the environment, notably, the types of solvent counterions Ivanov:73 and the temperature Nishimura:86 . It is also sequence dependent, with some sequences exhibiting in solution the features of both forms Fairall:89 ; Wolk:89 ; Lindqvist:01 . The transition is significantly facilitated in groups of consecutive guanines (G-tracts) whereas in A-tracts it is more difficult Leslie:83 ; Peticolas:88 ; Ivanov:96 . The A/B-philicity of different base pair steps and triplets has been parametrized and used successfully for predicting the properties of mixed sequences Ivanov:95 ; Basham:95 ; Tolstorukov:01 .
Several different ideas concerning detailed molecular aspects and the driving forces of AB transitions in DNA were discussed in different years Ivanov:73 ; Alden:79 ; Calladine:84 ; Calladine:92 ; Saenger:86 ; Hunter:93 ; Cheatham:97b ; Cheatham:97c ; Jayaram:98 . Both the sugar phosphate backbone Saenger:86 and base pair stacking Calladine:84 were proposed as one of the possible actors in the transition, with water as an evident second partner. Water bridges between certain DNA atoms may stabilize either B-DNA Calladine:84 or A-DNA Saenger:86 , and the hydrophobic effect possibly favors a B-DNA type of stacking Ivanov:73 ; Hunter:93 . It has been suggested that the reduced water activity is a universal factor that shifts the equilibrium towards A-DNA Malenkov:75 , which was later replaced by a less specific ”economics of hydration” Saenger:86 . Although the BA transition induced by increased salt concentration has been reported for poly-dG, the low water activity in high salt generally does not induce BA transitions Ivanov:73 ; Zimmerman:80 . In any case, it is not clear how the reduced amount of water around DNA affects its structure at the atomic level Fuller:88 . Molecular dynamics simulations suggest, in addition, that accumulation of metal cations in the major groove may specifically stabilize A-DNA Cheatham:97b ; Cheatham:97c .
The cooperativity of the BA transition is poorly understood. Its physical origin was initially attributed to the sugar puckering Ivanov:73 ; Ivanov:74 . The furanose ring conformation is C3’-endo (North) in A-DNA (with the C3’-carbon puckered above the furanose plane towards the nucleobase), and C2’-endo (South) in B-DNA Saenger:84 . For a single nucleoside in vacuum, the C2’-endo conformation is slightly lower in energy, with the barrier of 2-3 kcal/mole between the two states Foloppe:99 , and this is the only significant local energy barrier between the A- and B-DNA conformations. Until recently, it was assumed that the switch in the sugar pucker is strictly linked with the base pair orientation. The latter is restrained due to stacking interactions with the neighbors, therefore, the sugar conformations can change only simultaneously in at least several consecutive base pairs. These views, however, were always questioned Calladine:84 and the recent X-ray and spectroscopic studies really demonstrated that the North sugar puckers are accessible without the BA transition Fairall:89 ; Wolk:89 ; Lindqvist:01 , and even with all sugars in the C3’-endo conformation the overall B-DNA structure can persist Ng:00 . It appears, therefore, that the sugar conformations are only weakly restrained by the stacking and the observed cooperativity can hardly be due to the sugar pseudorotation barrier. At the same time, the ensemble of the currently available X-ray DNA structures agrees with the cooperative character of the BA transition. Although some A-DNA structures have B-like features near the termini Malinina:99 , and there exist a series of structures classified as A/B transition intermediates Vargason:01 the A- and B-forms generally do not mix in the same DNA fragment. The two forms may even coexist in a crystal, but in different samples of the same fragment Doucet:89 .
Many aspect of the A/B polymorphism were earlier studied by theoretical methods. Its thermodynamics is well described by an analytical theory based upon the Ising model Ivanov:74 . Reduced Calladine:84 ; Hunter:93 ; Mazur:89 and all atom Ivanov:79 models in continuous dielectric were used for studying its mechanism and sequence dependence. On the other hand, different analytical theories combined with simplified DNA representation were used for modeling solvent effects Jayaram:96 . Steady progress in MD simulations of DNA since the pioneering calculations by Levitt Levitt:83b recently made possible detailed modeling of A/B transitions in realistic environment including explicit water and metal counterions Cheatham:97b ; Cheatham:97c ; Jayaram:98 ; Cheatham:96 ; Yang:96 ; Cieplak:97 ; Sprous:98 ; Langley:98 ; Soliva:99 . They shed new light upon the putative molecular mechanisms involved in the DNA A/B polymorphism despite limited time of MD trajectories and some forcefield artifacts Feig:98 .
In the present study I try to get new insight in this problem by using a different MD approach. It has recently been shown that the particle-mesh Ewald (PME) algorithm allows one to follow the dynamics of a DNA double helix put in a small salty water drop Mzjacs:02 . An evident question one asks, what happens if the size of the drop is reduced? By analogy with drying fiber samples it should be expected that DNA would go from B to A-form. A series of simulations described here confirms that this is really the case. Although these conditions have never been used in experiments our simulations give the best currently possible prediction of the properties of such systems. Moreover, the transition is reversible in the time scale accessible in the calculations, that is both BA and AB transitions can be observed in the nanosecond time range. This allows one to test different hypotheses concerning the factors governing the transition. The results suggest that the AB transitions in an isolated water drop are driven by medium range electrostatic interactions between DNA backbone and counterions accumulated in the major groove. Moreover, several evidences suggest that AB transitions in other conditions are actually governed by the same mechanism.
Methods
In the series MD simulations presented here the Dickerson-Drew double helical dodecamer (CGCGAATTCGCG Wing:80 ) and its derivatives are used as examples. Similar results were also observed for several other test sequences. This particular DNA fragment is preferred because it is neither A-philic or B-philic and because its dynamic structure with Cornell et al. force field Cornell:95 is rather close to experimental data Cieplak:97 ; Young:97b ; Duan:97 . The simulation protocols were similar to the earlier water drop simulations Mzjacs:02 . We use the internal coordinate molecular dynamics (ICMD) method Mzjcc:97 ; Mzbook:01 adapted for DNA Mzjacs:98 ; Mzjchp:99 with the time step of 0.01 ps. The electrostatic interactions are evaluated with the shifted Coulomb law by using the SPME method Essmann:95 ; Mzjacs:02 and the long range cut-off of 50 Å which was always larger than the system size. The Van-der-Waals and SPME direct sum interactions were truncated at 9 Å with the value of Ewald parameter .
The initial state for BA transitions was prepared as before Mzjacs:02 with the canonical B-DNA Arnott:72 used a standard conformation. The DNA molecule was first immersed in a large rectangular TIP3P Jorgensen:83 water box of and next external solvent molecules were removed by using a spherical distance cut-off from DNA atoms. The cut-off radius was adjusted to obtain the desired number of water molecules remaining. The drop was neutralized by randomly adding the necessary number of Na+ ions. Simulations of AB transitions started from the final structure of a BA transition obtained with the lowest hydration.
Every system was energy minimized first with the solute held rigid and then with all degrees of freedom. Dynamics were initiated with the Maxwell distribution of generalized momenta at 250K and equilibrated at this temperature during several picoseconds. Production trajectories were computed with the temperature bound to 300 K by the Berendsen algorithm Berendsen:84 with a relaxation time of 10 ps. For better comparison with earlier simulations of AB transitions, the original Cornell et al. force filed Cornell:95 was used. Several test simulations showed, however, that qualitatively similar results are obtained with the subsequent modifications of the AMBER force filed Cheatham:99 ; Wang:00 . Duration of production runs varied from 5 to 25 ns depending upon the character of dynamics observed. The conformations were saved with a 2.5 ps interval. Programs Curves, Curves: XmMol XmMol: and Mathematica by Wolfram Research Inc. were employed in the data processing.
Results and Discussion
| Size | Transition | RMSD-A | RMSD-B | Xdisp | Inc | Time |
|---|---|---|---|---|---|---|
| 400(16.7) | BA | 2.1 | 6.5 | -4.2 | 23.0 | 1.5 |
| 500(20.8) | BA | 1.8 | 6.4 | -4.0 | 21.2 | 18.0 |
| 600(25.0) | BA | 1.8 | 6.1 | -4.0 | 20.2 | 20.0 |
| 800(33.3) | AB | 3.3 | 3.4 | -2.9 | 9.9 | 5.0 |
| 1000(41.7) | AB | 3.3 | 3.4 | -3.2 | 9.4 | 1.0 |
| 2000(83.3) | AB | 3.5 | 3.8 | -3.4 | 9.9 | 1.5 |
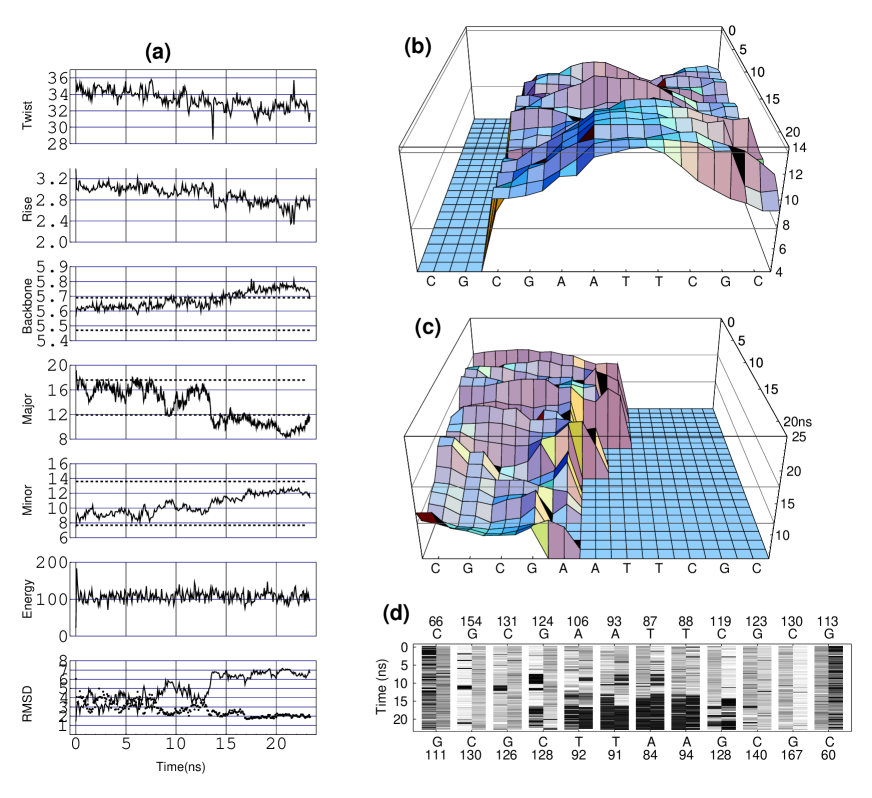
(a) Time traces of some important parameters. From top to bottom: the average twist and rise; the average backbone length computed as the distance between the centers of consecutive sugar rings; the average width of the major and minor grooves; the total energy; the rmsd from the canonical A-DNA (dotted line) and B-DNA (solid line). The horizontal broken lines in some frames mark the canonical B and A-DNA values.
(b) The time evolution of the minor groove profile. The surface is formed by 23 minor groove profiles equally spaced in time and each averaged over a 75 ps interval. The profile on the front face corresponds to the final DNA conformation. The groove width is evaluated by perpendicular cross-sections of space traces of C5’ atoms Mzjmb:99 , with the measured distances assigned to the sequence of the upper (”Watson”) strand. The empty zone on the left corresponds to the region where the groove could not be measured. The width is given in angströms and the corresponding canonical A- and B-DNA levels of are marked in all plates by the thin straight lines.
(c) The time evolution of the major groove profile. The surface is constructed similarly to plate (b). The empty zone on the right corresponds to the region where the groove could not be measured.
(d) Dynamics of sugar pucker pseudorotation. Only the pucker phase values from 0 to 180 were considered. Sugars with phases beyond this interval were assigned the closest of the two boundary values. The minimal and the maximal phases obtained were assigned the white and the black colors, respectively, with intermediate values mapped linearly to the gray scale levels. Each base pair step is characterized by a column consisting of two sub-columns, with the left sub-columns referring to the sequence written above in 5’-3’ direction from left to right with the time averaged phases given on top. The right sub-columns refer to the complementary sequence shown below together with the corresponding time averaged phases.
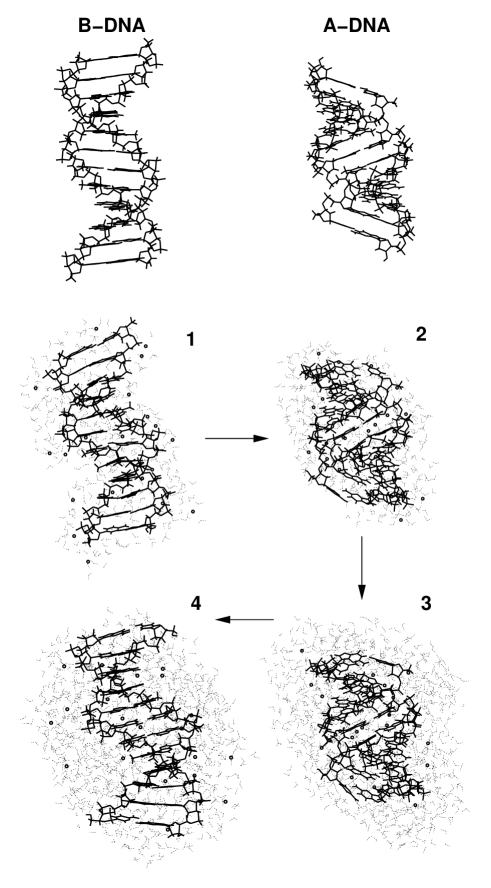
An example of the molecular transformation we study is shown in Fig. 1. The top row exhibits the canonical B- and A-DNA structures. The process begins with plate 1 where we see a snapshot of the first saved state during a production run started from the canonical B-DNA conformation. This system involves a dodecamer DNA fragment with 22 Na+ and 400 water molecules. It is seen that after the equilibration some ions have already entered the major groove while a thin water shell covers the surface of the DNA molecule. One may notice also a small narrowing in the middle of the minor groove which is a well-known distinctive feature of the crystal structure of this dodecamer. This initial trend is only temporary, however. The number of water molecules in the system is about 17 per nucleotide, which is less than the limiting hydration number for B-DNA Saenger:84 . In dynamics, water tries to form a smooth spherical drop around the DNA fragment and this is achieved owing to a BA transition. Plate 2 shows a snapshot after 2 ns of dynamics. It is seen that the DNA molecule went to the characteristic A-form conformation with a wide minor and narrow major grooves. Note that a substantial part of the Na+ ions is sandwiched in the major groove between the two opposite sugar-phosphate strands. The more compact A-form structure allows water to form a nearly spherical drop that covers the DNA fragment. After the transition the structure remains stable during the time accessible in calculations.
The final state of the previous trajectory was used as a starting point for the second run to obtain an inverse AB transition. For this purpose the system was surrounded by 600 additional water molecules to increase their number to 1000. Plate 3 in Fig. 1 displays a snapshot from the beginning of the second production run. Now the number of water molecules is about 42 per nucleotide, which corresponds to B-DNA hydration numbers. The last plate in Fig. 1 shows a snapshot after 2 ns of dynamics. As we see, the DNA molecule really went back from A- to B-DNA conformation and the narrowing in the middle of the minor groove re-appeared.
The sequence of transitions shown in Fig. 1 suggests that there exists a critical level of hydration characterized by an equal probability of A and B-forms, if the transition is cooperative, or by some structures intermediate between the two. In order to get a rough estimate of this midway point, a series of MD simulations was carried out with the size of the water drop systematically varied. The results obtained are summarized in Table 1. The corresponding trajectories were started from standard A-DNA and B-DNA states and continued as long as necessary to reach either AB or BA transition. For intermediate hydration values, notably, for 21 and 25 water molecules per nucleotide, very long trajectories were necessary. In all cases a transition in one direction only was obtained. For instance, with 25 water molecules per nucleotide an alternative trajectory starting from A-DNA was continued to 10 ns, but no transition occurred. The results summarized in Table 1 suggest that the hydration of 25 water molecules per nucleotide can serve as a rough estimate of the transition point.
As seen in Fig. 1, the A-DNA structure obtained in dynamics is more compact than the canonical conformation. The major groove width in the structure averaged over the last nanosecond is about 2 Å below the canonical value. The final A-DNA structures obtained for higher hydration levels had slightly wider major grooves. Note that, in Table 1, their rmsd from the canonical A-DNA is lower. In all cases, however, structures with the major groove width similar to that in the canonical A-DNA were observed only temporarily in intermediate transition phases, and they seemed to be unstable with respect to the more compact conformation shown in plate 2 of Fig. 1. Visual inspection reveals that in such structures the phosphate groups opposed across the major groove are similarly close or even closer to each other than the neighboring phosphates in the same strand. They are linked by multiple water bridges and at least one such bridge is usually replaced by a Na+ ion slightly shifted either inside or outside the helix. With intermediate hydration numbers, however, this pattern was less clear, with both Na+ and the opposite phosphate groups often hydrated separately.
One of the trajectories mentioned in Table 1 is detailed in Fig. 2. This simulation started from the canonical B-DNA with a water shell of 500 molecules (20.8 per nucleotide). Plate (a) exhibits time plots of several structural parameters. Three of them, namely, the backbone length and the average width of the two grooves deserve preliminary comments. The backbone length is computed as the average distance between the centers of consecutive sugar rings. Note that its value is larger in A-DNA than in B-DNA because, in a BA transition, the sugars are moved to the outer surface of the double helix, with the helical diameter of the sugar trace increased by nearly 6 Å. The widths of both grooves are evaluated by perpendicular cross-sections of spatial traces of C5’ atoms Mzjmb:99 . Near the helical termini, however, the grooves are not measurable and, in fact, the groove lengths vary in dynamics. The last feature is very clear in the dynamics of the major groove profile shown in plate (c). The average widths were computed for the zones where the corresponding groove was defined in each given structure.
The BA transition seen in Fig. 2 is relatively slow, with the final structure established only after 18 ns. An early BA transition occurred close to one of the termini at around 10 ns. However, it was incomplete and inverted two nanoseconds later. According to the two rmsd traces, the final transition started at 13 ns. Until that the dynamics sampled midway conformations between A- and B-forms, which is not that far from normal B-DNA dynamics with the same potentials Cieplak:97 ; Young:97b ; Duan:97 . It may be seen that the minor groove profile periodically switched from narrowing to widening in the middle. At about 13 ns the two rmsd traces drastically moved close to their final levels. Simultaneously the major groove width fell by almost 10 Å and went below the A-DNA level. At that time the molecule already looked very much like A-DNA, with the instantaneous rmsd-A values around 2 Å, but almost all sugars still had their puckers in the South region. The final phase of the transition is slower and during this phase the sugars in the middle AATT tetraplet switch to the North. In this middle zone the transition to the A-form is complete whereas the three terminal base pairs remain in an intermediate conformation with South sugar puckers.
Although the structural parameters shown in plate (a) differ by the amplitudes of fluctuations they all reveal a slow overall drift suggesting a downhill motion of the system on a free energy surface. In contrast, the total energy remains stable throughout the trajectory except the initial phase. This means that, already during heating, the system finds a balance of internal interactions maintained afterwards, and, consequently, the observed steady downhill character of the transition has an entropic origin. The precise nature this entropic force is not clear. The backward AB transitions have qualitatively similar kinetic suggesting that this feature is not due to the properties of the A and B-DNA forms, but results from the specific setup of simulations.
In the backward AB transitions, the sequence of events is inverted, that is, the sugar puckers quickly switch to the North whereas the rmsd’s and the groove widths need sometimes many nanoseconds to reach stationary B-DNA values. Such kinetics does not depend upon the amount of water added and it is slower than in earlier reported AMBER simulations Cheatham:96 ; Sprous:98 . The apparent reason is that during the BA transition a large number of metal ions enter the major groove when it is still wide. A high ion concentration in the major groove is one of the factors that supposedly stabilize the A-DNA conformation Cheatham:97b ; Cheatham:97c . In contrast, when the trajectory is to be started from the canonical A-DNA, the major groove is narrow from the beginning, and very long equilibration period should be necessary for the same number of ions to reach optimal positions.
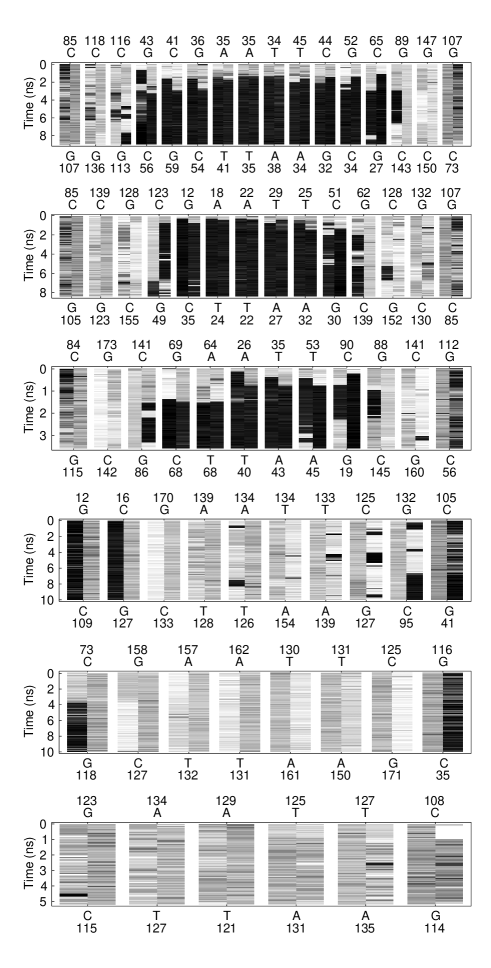
The possibility of BA transitions in longer and shorter DNA fragments has been checked in a series of simulations summarized in Fig. 3. The foregoing results suggested that the BA transitions in a water drop are mainly driven by electrostatic interactions between counterions and backbone phosphates across the major groove. A characteristic A-form major groove can be formed starting from eight base pairs and, as seen in Fig. 2c, its length in a dodecamer A-DNA is between for and five nucleotides. One could expect, therefore, that BA transitions would progressively become more difficult as the DNA is shortened. All trajectories shown in Fig. 3 started from B-DNA with the lowest degree of hydration used in Table 1. The number of Na+ and the size of the water drop were changed according to the DNA chain length. As expected, relatively rapid BA transitions are observed in the original dodecamer and its longer derivatives. In contrast, the transition did not occur in shorter fragments. The hexamer always remained in a typical B-DNA conformation with high rise and negative inclination. The octamer and decamer fragments exhibited dynamics somewhat similar to that of the dodecamer, with accumulation of Na+ ions in the major groove and noticeable compression of the DNA structure, however, the BA transition did not occur. Moreover, one of the terminal base pairs in the decamer was broken, with water bridges formed between the two nucleotides, which apparently helped to move closer the opposite phosphate strands in the major groove. This effect was reproduced in a repeated run with hydrogen bonds in terminal base pairs enforced by weak additional restraints. The last observation suggested that the three shorter fragments in Fig. 3 would not go to A-form even in much longer dynamics.
Based upon the described qualitative character of DNA dynamics, one can consider two main physical factors as the possible driving forces of the BA transition under low hydration. First, water tends to reduce its contact surface with vacuum and forms a spherical drop forcing the DNA fragment to shrink. This force can be considered as surface tension or as a particular case of the hydrophobic effect, with vacuum in place of a nonpolar solvent. The second factor is the increased concentration of Na+ ions, which reduces the water activity. These two alternatives were checked in additional simulations under modified conditions. To check separately the role of the surface tension, the counterion effects were suppressed by discharging the DNA fragment and next running dynamics without counterions. The partial charges of OP atoms were reduced by by 0.5 eu and two long trajectories were computed starting from the canonical B-DNA structure under the lowest and the highest hydration, respectively. The DNA structures sampled in both these simulations turned out to be similar. These were slightly underwound B-DNA conformations with the average twist around 30∘. Under the low hydration the duplex looked slightly compressed, but no signs of a BA transition could be noticed.
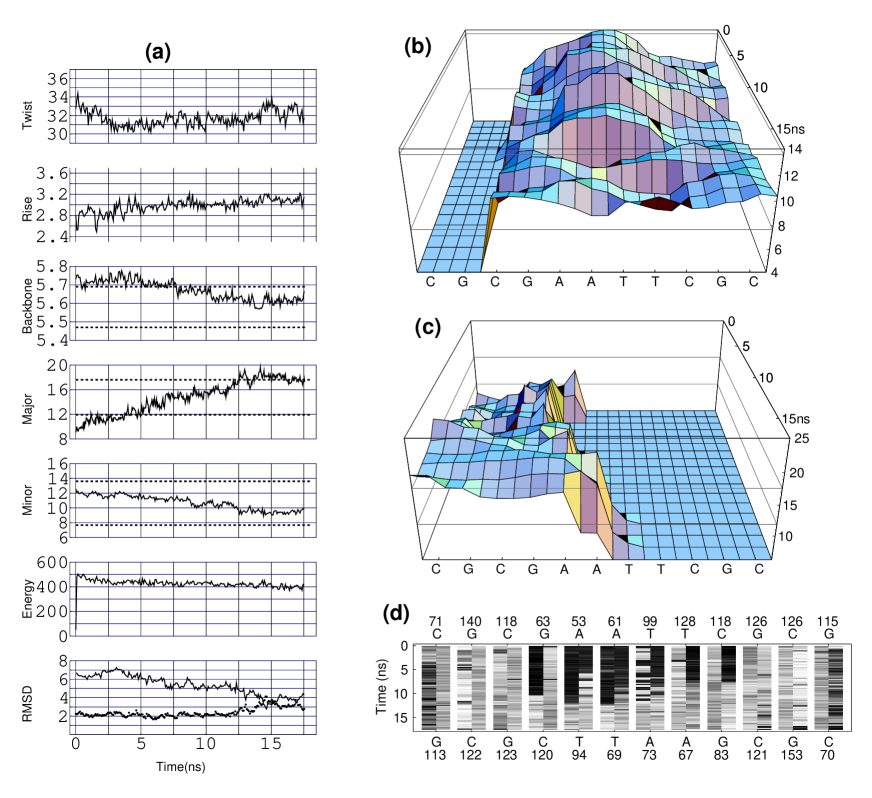
The effect of the high counterion concentration upon the water activity was separately checked in two simulations with added NaCl. Earlier it was reported that high NaCl does not cause BA transitions in conventional simulations with periodical boundaries Cheatham:97c . To make a more stringent test, here the NaCl concentration was increased under the midway hydration as estimated in Table 1. It was hoped that under such conditions an increased salt concentration can produce a clear qualitative effect upon the dynamics. The initial A and B-DNA states in a water shell of 600 molecules were modified by replacing 66 randomly chosen water molecules with 33 Na+ and 33 Cl- ions. After that, 66 water molecules were added to maintain the earlier hydration level. The effective concentration of Na+ was thus raised from 2M to 5M. The two systems were re-equilibrated with the standard protocol and long trajectories were computed to obtain either AB or BA transition. In contrast to the tests in Table 1, here an AB transition was obtained after about 13 ns dynamics as shown in Fig. 4. The dynamics exhibited in this figure is typical of the AB transitions described above although its kinetics are much slower than those in Table 1. The second trajectory was similarly long, but only B-DNA structures were sampled.
In the animations of these trajectories, progressive crystallization of NaCl was seen, with large blocks of typical cubic NaCl lattice found in the major DNA groove in the end of both trajectories. Addition of NaCl is supposed to stimulate AB transitions in fiber DNA crystalsCooper:66 . Moreover, NaCl crystallization occurs in DNA fibers at 75% relative humidity if the salt content is above 6% of the DNA weightCooper:66 , which gives 4.8M effective concentration of NaCl according to the reported water/DNA adsorption curvesFalk:62 . One may note, therefore, that the overall effect of the added salt in our simulations qualitatively agrees with experiments. The observed shift towards the B-form may be caused by the NaCl crystallization either directly, by forcing the major groove to open, or indirectly, by pushing water out from the major groove together with some free Na+ ions. In any case, however, these results suggest that it is not the water activity reduced by ions that causes the BA transitions in small drops.
The last simulations suggest that BA transitions are induced by a united effect of the limited water shell and counterions, and not by one of these factors considered separately. A simple and attractive mechanism that accounts for all the above results is as follows. The BA transition is caused by direct electrostatic interactions between mobile metal cations and phosphate groups in the opening of the major DNA groove. When the local cation concentration exceeds a certain critical value, the inter-phosphate repulsion is inverted to attraction. A similar idea is long discussed in the context of DNA bendingMirzabekov:79 ; Levene:86 ; Rouzina:98 and it was earlier proposed by Cheatham and Kollman as one of the possible mechanisms responsible for stability of the A-form Cheatham:97b ; Cheatham:97c . The strong inter-phosphate attraction immediately results in local DNA bending and, eventually, in a BA transition at the opposite side of the double helix. When the length of the major groove exceeds one helical turn the apparent bend becomes uniform shrinking. The role of the limited water shell consist in pushing the counterion cloud surrounding DNA inside the diameter of the double helix. The counterions avoid loosing their hydration shells and are forced to come closer to DNA. The surface tension at the drop boundary plays a certain role, but it is the reduced overall space available for counterions that seems more important. This simple model explains well our results, and below we consider why and how it may work in other conditions as well.
Concluding Discussion
Clarification of the detailed mechanisms involved in the DNA polymorphism is an important challenge for rapidly progressing computational methods in molecular biophysicsCheatham:00 . Here, for the first time, reversible BA transitions were obtained in silico in a simulated titration experiment by smooth variation of water content. The environment conditions used were not earlier encountered in experiments, nevertheless, the qualitative features found seem credible and likely to exist in analogous experimental conditions. First, the computed pattern of DNA transformations is physically sensible and agrees with known experimental trends, notably, as regards the principal effect of the amount of bound water. Second, these calculations give the most accurate currently possible prediction of the true properties of DNA fragments in small water drops. Really, the Cornel at al. force field Cornell:95 was earlier shown to produce DNA dynamics in good agreement with experiments Cheatham:00 . Its parameters were fitted with small molecule data only, and they were never specifically adjusted for periodical boundary conditions. In our case, no artificial interactions are introduced, while those between periodical images are eliminated Mzjacs:02 . There are all reasons to believe, therefore, that our simulations reproduce correctly the dynamics of DNA transformations in such unusual conditions.
Qualitatively, the results obtained here agree with earlier studies. Cheatham and Kollman were the first to obtain an AB transformation in pure water, and stable A-DNA dynamics in 85% EtOH Cheatham:96 ; Cheatham:97b . Visual inspection of the reported A-DNA snapshots Cheatham:97a shows that our structures are quite similar to those in EtOH as regards the width of the major groove, preferred positions of Na+ ions, and a B-like character of the DNA termini, which gives the molecule a strong apparent bend to the major groove. Moreover, the reported stabilization of A-DNA in EtOHCheatham:97b required that the molecule was first covered by water and then by EtOH as an outer shell. The necessity of such double phase hydration was confirmed by Sprous et al. Sprous:98 . Although water and EtOH could mix in dynamics, it seems evident that, in order to be stable in simulations, the A-form should be contained in a small water shell. Cheatham and Kollman showed also that a BA transition can be provoked by placing polycationic ligands to the major groove between the opposite phosphate strands Cheatham:97c . Our results confirm that the accumulation of positively charged counterions in the major groove of B-DNA is, perhaps, the major driving force of this transition.
Although one cannot exclude that the AB transitions in different conditions are due to radically different mechanisms, it is attractive to consider the possibility that the electrostatic model outlined above in fact operates in all such cases. This model is obviously transferable from water drop to DNA in fibers under different humidity. One can argue, tough, that the computed A-DNA systematically differs from the canonical and single crystal A-DNA fragments by a very narrow major groove. However, the major groove in the A-DNA conformations available in NDBNDB: varies so strongly that this parameter can hardly be considered as a well defined attribute of the A-form. It is possible also that the parameterization of Na+ ions in the Cornell et al. force fieldCornell:95 underestimates its binding to water with respect to negatively charged atoms. In our dynamics, correct canonical major groove width was observed during transitions as long as Na+ ions kept their first hydration shells and avoided direct contacts with the phosphate groups.
Another defect of the computed A-DNA consists in the strong B-philicity of the termini accompanied by bending to the major groove. These two features are mutually related because it is long known that the boundaries between A and B-forms are bentSelsing:79 . This defect, however, is only apparent because it qualitatively agrees with experimental data. The B-philicity of DNA ends has to be assumed when AB transitions in solution are consideredMinchenkova:86 . Moreover, many single crystal A-DNA structures appear smoothly bend to the major groove when analyzed with the Curves programCurves: , with this trend being particularly evident for complete helical turns Malinina:99 ; Verdaguer:91 ; Bingman:92 . In our simulations, these features are just accentuated due to the excessively narrow major groove, which requires stronger bending, and also because our sequences are not A-philic as in all single crystal A-DNA fragments.
The solution AB transitions caused by non-polar organic solvents can also be interpreted in terms of the above electrostatic model. For this purpose it is sufficient to imagine what would happen if our water drops were put in EtOH, for instance. The water activity inside the drop is strongly reduced by DNA itself and its counterion shell. In infinite water, the activity coefficient grows with the distance from the double helix and becomes close to one outside the counterion cloud, that is at around 10 Å from DNA. EtOH is easily mixable with normal water, but not with the low activity water near DNA. This argument can be illustrated by the above discussed crystallization of NaCl in the DNA environment at concentrations much below its standard solubility limit. The water molecules would leave the drop and go to EtOH until the outer water activity becomes equal to that inside the drop. In other words, the water activity in the added nonpolar phase determines the size of the drop and, consequently, the state of the AB equilibrium. That is why BA transition curves in different solvents converge when water activity is used as parameterMalenkov:75 . More polar solvents like MetOH and ethylene glycol do not cause BA transitions possibly because they solvate counterions rather than push them inside the double helix.
Both the apparent B-philicity of the DNA ends and the chain length dependence of the BA transitions observed in our simulations agree with experiments in solutionMinchenkova:86 ; Fairall:89 ; Galat:90 . Another salient feature nicely reproduced is the cooperative character of the transition, with the minimal length of the cooperative fragment of around one helical turn. This cooperativity is not caused by the sugar pseudorotation barrier because during BA transitions the sugars switch last. Instead it is conditioned by the A-DNA geometry and the character of the electrostatic interactions in the major groove. In the A-DNA major groove the phosphate of the nth base pair is positioned against that of the (n-8)th. These eight base pairs represent the minimum DNA length that is to be mechanically involved if the transition is caused by a force applied between these groups. The positive energy of this mechanical deformation should be compensated by the negative electrostatic energy of solvent cations sandwiched between the phosphates. One step of such ”electrostatic sandwich” is probably insufficient, and octamer DNA should not generally go to the A-form. However, already in a nanomer the sandwich length is increased by one while the deformation energy is increased only by a fraction of the initial gap. Therefore, the energetic balance is progressively shifted in favor of A-form as the chain length is increased. In long DNA, the boundary between the A and B-forms has higher energy because the energy gap of the initial octamer remains effectively shared between the two opposite boundaries. The foregoing qualitative pattern exactly corresponds to the one dimensional Ising model of cooperative transitionsIvanov:74 .
References
- (1) J. D. Watson and F. H. C. Crick, A structure for deoxyribose nucleic acid, Nature 171, 737 (1953).
- (2) R. E. Franklin and R. G. Gosling, Molecular configuration in sodium thymonucleate, Nature 171, 740 (1953).
- (3) W. Saenger, Principles of Nucleic Acid Structure (Springer-Verlag, New York, 1984).
- (4) C. R. Calladine and H. R. Drew, Understanding DNA: The Molecule & How it Works (Academic Press, London, 1992).
- (5) V. I. Ivanov and L. E. Minchenkova, The A-form of DNA: in search of biological role (a review), Mol. Biol. 28, 780 (1995).
- (6) Y. Timsit, DNA structure and polymerase fidelity, J. Mol. Biol. 293, 835 (1999).
- (7) X. J. Lu, Z. Shakked, and W. K. Olson, A-form conformational motifs in ligand-bound DNA structures, J. Mol. Biol. 300, 819 (2000).
- (8) H.-L. Ng, M. L. Kopka, and R. E. Dickerson, The structure of a stable intermediate in the A-B DNA helix transition, Proc. Natl. Acad. Sci. U.S.A. 97, 2035 (2000).
- (9) A. G. W. Leslie, S. Arnott, R. Chandrasekaran, and R. L. Ratliff, Polymorphism of DNA double helices, J. Mol. Biol. 143, 49 (1980).
- (10) J. Pis̆kur and A. Rupprecht, Aggregated DNA in ethanol solution, FEBS Lett. 375, 174 (1995).
- (11) M. J. Tunis-Schneider and M. F. Maestre, Circular dichroism spectra of oriented and unoriented deoxyribonucleic acid films: A preliminary study, J. Mol. Biol. 52, 521 (1970).
- (12) S. B. Zimmerman and B. H. Pheiffer, DNA structures and transitions: X-ray diffraction studies of solvated fibers, Cold Spring Harb. Symp. Quant. Biol. 47, 67 (1983).
- (13) V. I. Ivanov, L. E. Minchenkova, E. E. Minyat, and A. K. Schyolkina, Cooperative transitions in DNA with no separation of strands, Cold Spring Harb. Symp. Quant. Biol. 47, 243 (1983).
- (14) V. I. Ivanov, L. E. Minchenkova, A. K. Schyolkina, and A. I. Poletaev, Differen conformations of double-stranded nucleic acids in solution as revealed by circular dichroism, Biopolymers 12, 89 (1973).
- (15) V. I. Ivanov, L. E. Minchenkova, E. E. Minyat, M. D. Frank-Kametetskii, and A. K. Schyolkina, The B to A transition of DNA in solution, J. Mol. Biol. 87, 817 (1974).
- (16) L. Fairall, S. Martin, and D. Rhodes, The DNA binding site of the xenopus transcription factor IIIA has a non-B-form structure, EMBO J. 8, 1809 (1989).
- (17) A. Galat, A note on seuqence-dependence of DNA structure, Eur. Biophys. J. 17, 331 (1990).
- (18) B. N. Conner, T. Takano, S. Tanaka, K. Itakura, and R. E. Dickerson, The molecular structure of d(CpCpGpG), a fragment of right-handed double helical A-DNA, Nature 295, 294 (1982).
- (19) H. M. Berman, W. K. Olson, D. L. Beveridge, J. Westbrook, A. Gelbin, T. Demeny, S. H. Hsieh, A. R. Srinivasan, and B. Schneider, The nucleic acid database. a comprehensive relational database of three-dimensional structures of nucleic acids, Biophys J. 63, 751 (1992).
- (20) Y. Nishimura, C. Torigoe, and M. Tsuboi, Salt induced B to A transition of poly(dG)-poly(dC) and the stabilization of A form by its methylation, Nucleic Acids Res. 14, 2737 (1986).
- (21) S. Wolk, W. N. Thurmes, W. S. Ross, C. C. Hardin, and I. Tinoco, Jr., Conformational analysis of d(C3G3), a B-family duplex in solution, Biochemistry 28, 2452 (1989).
- (22) M. Lindqvist and A. Gräslund, An FTIR and CD study of the structural effecst of G-tract length and sequence context on DNA conformation in solution., J. Mol. Biol. 314, 423 (2001).
- (23) W. L. Peticolas, Y. Wang, and G. A. Thomas, Some rules for predicting the base-sequence dependence of DNA conformation, Proc. Natl. Acad. Sci. U.S.A. 85, 2579 (1988).
- (24) V. I. Ivanov, L. E. Minchenkova, G. Burckhardt, E. Birch-Hirschfeld, H. Fritzsche, and C. Zimmer, The detection of B-form/A-form junction in a deoxyribonucleotide duplex, Biophys. J. 71, 3344 (1996).
- (25) B. Basham, G. P. Schroth, and P. S. Ho, An A-DNA triplet code: Thermodynamic rules for predicting A- and B-DNA, Proc. Natl. Acad. Sci. U.S.A. 92, 6464 (1995).
- (26) M. Y. Tolstorukov, V. I. Ivanov, G. G. Malenkov, R. L. Jernigan, and V. B. Zhurkin, Sequence-dependent B-A transition in DNA evaluated with dimeric and trimeric scales, Biophys. J. 81, 3409 (2001).
- (27) C. J. Alden and S.-H. Kim, Solvent-accessible surfaces of nucleic acids, J. Mol. Biol. 132, 411 (1979).
- (28) C. R. Calladine and H. R. Drew, A base-centered explanation of the B-to-A transition in DNA, J. Mol. Biol. 178, 773 (1984).
- (29) W. Saenger, W. N. Hunter, and O. Kennard, DNA conformation is determined by econimcs in the hydration of phosphate groups, Nature 324, 385 (1986).
- (30) C. A. Hunter, Sequence-dependent DNA structure. The role of base stacking interactions, J. Mol. Biol. 230, 1025 (1993).
- (31) T. E. Cheatham, III, M. F. Crowley, T. Fox, and P. A. Kollman, A molecular level picture of the stabilization of A-DNA in mixed ethanol-water solutions, Proc. Natl. Acad. Sci. U.S.A. 94, 9626 (1997).
- (32) T. E. Cheatham, III and P. A. Kollman, Insight into the stabilization of A-DNA by specific ion association: Spontaneous B-DNA to A-DNA transitions observed in molecular dynamics simulations of d[ACCCGCGGGT]2 in the presence of hexaamminecobalt(III), Structure 5, 1297 (1997).
- (33) B. Jayaram, D. Sprous, M. A. Young, and D. L. Beveridge, Free energy analysis of the conformational preferences of A and B forms of DNA in solution, J. Am. Chem. Soc. 120, 10629 (1998).
- (34) G. Malenkov, L. Minchenkova, E. Minyat, A. Schyolkina, and V. Ivanov, The nature of the B-A transition of DNA in solution, FEBS Lett 51, 38 (1975).
- (35) S. B. Zimmerman and B. H. Pheiffer, Does DNA adopt the C form in concentrated salt solutions or in organic solvent/water mixutres? An X-ray diffraction study of DNA fibers immersed in various media, J. Mol. Biol. 142, 315 (1980).
- (36) W. Fuller, A. Mahensdasingam, and V. T. Forsyth, DNA and the hydration economy, Nature 335, 596 (1988).
- (37) B. Wolf and S. Hanlon, Structural transitions of deoxyribonucleic acid in aqueous electrolyte solutions. II. The rolge of hydration, Biochemistry 14, 1661 (1975).
- (38) L. Malinina, L. G. Fernandez, T. Huynh-Dinh, and J. A. Subirana, Structure of the d(CGCCCGCGGGCG) dodecamer: A kinked A-DNA molecule showing some B-DNA features, J. Mol. Biol. 285, 1679 (1999).
- (39) J. M. Vargason, K. Henderson, and P. S. Ho, A crystallographic map of the transition from B-DNA to A-DNA, Proc. Natl. Acad. Sci. U.S.A. 98, 7265 (2001).
- (40) J. Doucet, J.-P. Benoit, W. B. Cruse, T. Prange, and O. Kennard, Coexistence of A- and B-form DNA in a single crystal lattice, Nature 337, 190 (1989).
- (41) J. Mazur, A. Sarai, and R. L. Jernigan, Sequence dependence of the B-A conformational transition of DNA, Biopolymers 28, 1223 (1989).
- (42) V. I. Ivanov, V. B. Zhurkin, S. K. Zavriev, Y. P. Lysov, L. E. Minchenkova, E. E. Minyat, M. D. Frank-Kamenetskii, and A. K. Schyolkina, Conformational possibilities of double-helical nucleic acids: Theory and experiment, Int. J. Quantum. Chem. 16, 189 (1979).
- (43) B. Jayaram and D. L. Beveridge, Modeling DNA in aqueous solutions: Theoretical and computer simulation studies on the ion atmosphere of DNA, Annu. Rev. Biophys. Biomol. Struct. 25, 367 (1996).
- (44) M. Levitt, Computer simulation of DNA double-helix dynamics, Cold Spring Harb. Symp. Quant. Biol. 47, 251 (1983).
- (45) T. E. Cheatham, III and P. A. Kollman, Observation of the A-DNA to B-DNA transition during unrestrained molecular dynamics in aqueous solution, J. Mol. Biol. 259, 434 (1996).
- (46) L. Yang and B. M. Pettitt, B to A transition of DNA on the nanosecond time scale, J. Phys. Chem. B 100, 2564 (1996).
- (47) P. Cieplak, T. E. Cheatham, III, and P. A. Kollman, Molecular dynamics simulations find that 3’-phosphoramidate modified DNA duplexes undergo B to A transition and normal DNA duplexes an A to B transition, J. Am. Chem. Soc. 119, 6722 (1997).
- (48) D. Sprous, M. A. Young, and D. L. Beveridge, Molecular dynamics studies of the conformational preferences of a DNA double helix in water and an ethanol/water mixture: Theoretical considerations of the A-B transition, J. Phys. Chem. B 102, 4658 (1998).
- (49) D. R. Langley, Molecular dynamic simulations of enviroment and sequence dependent DNA conformatinos: The development of the BMS nucleic acids force field and comparison with exeprimental results, J. Biomol. Struct. Dyn. 16, 487 (1998).
- (50) R. Soliva, F. J. Luque, C. Alhambra, and M. Orozco, Role of sugar re-puckering in the transition of A and B forms of DNA in solution: A molecular dynamics study, J. Biomol. Struct. Dyn. 17, 89 (1999).
- (51) M. Feig and B. M. Pettitt, Structurl equilibrium of DNA represented with different force fields, Biophys. J. 75, 134 (1998).
- (52) A. K. Mazur, DNA dynamics in a water drop without counterions, J. Am. Chem. Soc. 124, 14707 (2002).
- (53) R. Wing, H. Drew, T. Takano, C. Broka, S. Tanaka, K. Itakura, and R. E. Dickerson, Crystal structure analysis of a complete turn of B-DNA, Nature 287, 755 (1980).
- (54) W. D. Cornell, P. Cieplak, C. I. Bayly, I. R. Gould, K. M. Merz, D. M. Ferguson, D. C. Spellmeyer, T. Fox, J. W. Caldwell, and P. A. Kollman, A second generation force field for the simulation of proteins, nucleic acids and organic molecules, J. Am. Chem. Soc. 117, 5179 (1995).
- (55) M. A. Young, G. Ravishanker, and D. L. Beveridge, A 5-nanosecond molecular dynamics trajectory for B-DNA: Analysis of structure, motions, and solvation, Biophys. J. 73, 2313 (1997).
- (56) Y. Duan, P. Wlkosz, M. Crowley, and J. M. Rosenberg, Molecular dynamics simulation study of DNA dodecamer d(CGCGAATTCGCG) in solution: Conformation and hydration, J. Mol. Biol. 272, 552 (1997).
- (57) A. K. Mazur, Quasi-Hamiltonian equations of motion for internal coordinate molecular dynamics of polymers, J. Comput. Chem. 18, 1354 (1997).
- (58) A. K. Mazur, in Computational Biochemistry and Biophysics, edited by O. M. Becker, A. D. MacKerell, Jr., B. Roux, and M. Watanabe (Marcel Dekker, New York, 2001), pp. 115–131.
- (59) A. K. Mazur, Accurate DNA dynamics without accurate long range electrostatics, J. Am. Chem. Soc. 120, 10928 (1998).
- (60) A. K. Mazur, Symplectic integration of closed chain rigid body dynamics with internal coordinate equations of motion, J. Chem. Phys. 111, 1407 (1999).
- (61) U. Essmann, L. Perera, M. L. Berkowitz, T. Darden, H. Lee, and L. G. Pedersen, A smooth particle mesh Ewald method, J. Chem. Phys. 103, 8577 (1995).
- (62) S. Arnott and D. W. L. Hukins, Optimised parameters for A-DNA and B-DNA, Biochem. Biophys. Res. Commun. 47, 1504 (1972).
- (63) W. L. Jorgensen, J. Chandreskhar, J. D. Madura, R. W. Impey, and M. L. Klein, Comparison of simple potential functions for simulating liquid water, J. Chem. Phys 79, 926 (1983).
- (64) H. J. C. Berendsen, J. P. M. Postma, W. F. van Gunsteren, A. DiNola, and J. R. Haak, Molecular dynamics with coupling to an external bath, J. Chem. Phys. 81, 3684 (1984).
- (65) T. E. Cheatham, III, P. Cieplak, and P. A. Kollman, A modified version of the Cornell et al. force field with improved sugar pucker phases and helical repeat, J. Biomol. Struct. Dyn. 16, 845 (1999).
- (66) J. Wang, P. Cieplak, and P. A. Kollman, How well does a restrained electrostatic potential (RESP) model perform in calculating conformational energies of organic and biological molecules, J. Comput. Chem. 21, 1049 (2000).
- (67) R. Lavery and H. Sklenar, The definition of generalized helicoidal parameters and of axis curvature for irregular nucleic acids, J. Biomol. Struct. Dyn. 6, 63 (1988).
- (68) P. Tuffery, XmMol: An X11 and motif program for macromolecular visualization and modelling, J. Mol. Graphics 13, 67 (1995).
- (69) A. K. Mazur, Internal correlations in minor groove profiles of experimental and computed B-DNA conformations, J. Mol. Biol. 290, 373 (1999).
- (70) P. J. Cooper and L. D. Hamilton, The A-B conformational change in the sodium salt of DNA, J. Mol. Biol. 16, 562 (1966).
- (71) M. Falk, K. A. Hartman, Jr., and R. C. Lord, Hydration of deoxyribonucleic acid. I. A gravimetric study, J. Am. Chem. Soc. 84, 3843 (1962).
- (72) A. D. Mirzabekov and A. Rich, Asymmetric lateral distribution of unshielded phosphate groups in nucleosomal DNA and its role in DNA bending, Proc. Natl. Acad. Sci. U.S.A. 76, 1118 (1979).
- (73) S. D. Levene, H.-M. Wu, and D. M. Crothers, Bending and flexibility of kinetoplast DNA, Biochemistry 25, 3988 (1986).
- (74) I. Rouzina and V. A. Bloomfield, DNA bending by small, mobile multivalent cations, Biophys. J. 74, 3152 (1998).
- (75) T. E. Cheatham, III and P. A. Kollman, Molecular dynamics simulations of nucleic acids, Annu. Rev. Phys. Chem. 51, 435 (2000).
- (76) T. E. Cheatham, III and P. A. Kollman, Molecular dynamics simulations highlight the structural differences among DNA:DNA, RNA:RNA, and DNA:RNA hybrid duplexes, J. Am. Chem. Soc. 119, 4805 (1997).
- (77) E. Selsing, R. D. Wells, C. J. Alden, and S. Arnott, Bent DNA: Visualization of a base-paired and stacked A-B conformational junctions, J. Biol. Chem. 254, 5417 (1979).
- (78) L. E. Minchenkova, A. K. Schyolkina, B. K. Chernov, and V. I. Ivanov, CC/GG contacts facilitate the B to A transition of DNA in solution, J. Biomol. Struct. Dyn. 4, 463 (1986).
- (79) N. Verdaguer, J. Aymami, D. Fernandez-Forner, I. Fita, M. Coll, T. Huynh-Dinh, J. Ingolen, and J. A. Subirana, Molecular structure of a complete turn of A-DNA, J. Mol. Biol. 221, 623 (1991).
- (80) C. A. Bingman, G. Zon, and M. Sundaralingam, Crystal and molecualr structure of the A-DNA dodecamer d(CCGTACGTACGG): Choice of framgent helical axis, J. Mol. Biol. 227, 738 (1992).