kxl014 \gridframeN\cropmarkN\fpage2943 \lpage2956 \MonthMay \Year2003
Perfect and near perfect adaptation in a model of bacterial chemotaxis
Abstract
The signaling apparatus mediating bacterial chemotaxis can adapt to a wide range of persistent external stimuli. In many cases, the bacterial activity returns to its pre-stimulus level exactly and this “perfect adaptability” is robust against variations in various chemotaxis protein concentrations. We model the bacterial chemotaxis signaling pathway, from ligand binding to CheY phosphorylation. By solving the steady-state equations of the model analytically, we derive a full set of conditions for the system to achieve perfect adaptation. The conditions related to the phosphorylation part of the pathway are discovered for the first time, while other conditions are generalization of the ones found in previous works. Sensitivity of the perfect adaptation is evaluated by perturbing these conditions. We find that, even in the absence of some of the perfect adaptation conditions, adaptation can be achieved with near perfect precision as a result of the separation of scales in both chemotaxis protein concentrations and reaction rates, or specific properties of the receptor distribution in different methylation states. Since near perfect adaptation can be found in much larger regions of the parameter space than that defined by the perfect adaptation conditions, their existence is essential to understand robustness in bacterial chemotaxis. Preprint produced by the authors
doi:
doi: 10.1016/S0006-3495(03)70021-6INTRODUCTION
The motion of coliform bacteria (such as E-coli) is driven by rotation of several flagella attached to the cell body. When the flagella rotate counter-clockwise (CCW), the flagella form a bundle that pushes the bacterium in a smooth motion (runs) with a high degree of directionality. On the other hand, when the flagella rotate clockwise (CW), the flagella bundle flies apart and the bacterium tumbles, randomizing the direction of the subsequent run. The frequency with which the tumbling motion occurs decreases with increasing concentration of attractant (or decreasing concentration of repellent). As the result, the bacterium performs a biased random walk towards higher concentration of attractant. This mechanism gives the bacterium its ability to follow the gradient of chemical concentration, i.e., chemotaxis.
From the sensing of external stimulus to the activation of motor regulator protein, a series of chemical reactions are involved in relaying and regulating the signal. For recent review on bacterial chemotaxis signaling pathway, see references (Falke, 1997; Bren, 2000; Bourret, 2002). The major players in the chemotaxis signal transduction pathway are the transmembrane chemotaxis receptors and 6 cytosolic proteins: CheA, CheB, CheR, CheW, CheY and CheZ. The receptor forms a complex with the histidine kinase CheA through the adaptor protein CheW. The receptor has a ligand binding domain located at the periplasm to sense the external signal, such as the concentration of attractant (or repellent). The activity of CheA is affected by the properties of the receptor, for example, whether the receptor is ligand bound or not. When chemoattractant binds to receptor, CheA activity is suppressed. The histidine kinase CheA, once activated, acquires a phosphate group through autophosphorylation, and subsequently transfers the phosphate group to the response regulator protein CheY or the demethylation enzyme CheB. The phosphorylated CheY (CheY-P) then interacts with the motor and increases the motor’s CW rotation bias. This is the “linear” signal transfer part of the bacterial chemotaxis pathway. Like many other biological sensory systems, the bacterial chemotaxis pathway also has the ability to adapt to persistent external stimulus. The adaptation in bacterial chemotaxis is facilitated by the methylation and demethylation of the receptor, which serves as the feedback control of the system. The methylation and demethylation processes are catalyzed by CheR and CheB-P respectively and are slow in comparison with the other reactions.
Because of the excellent understanding of each individual reaction of the pathway, mathematical modelling of bacterial chemotaxis signal transduction has been very fruitful (Bray, 1993; Hauri, 1995; Barkai, 1997; Spiro, 1997; Morton-Firth, 1998; Morton-Firth, 1999; Yi, 2000). Besides being useful in understanding specific aspects of chemotaxis experiments, modelling is essential in gaining insight about general properties of biochemical networks. One important general problem is to understand the functional stability of biochemical networks under changes of various pathway parameters, such as concentrations of enzymes and reaction rates. Parameter fluctuations are inherent for biological systems in the real world, so robustness, i.e., the insensitivity of important system properties with respect to parameter variation and fluctuation of protein concentrations, is crucial for the proper functioning of the biological systems.
Experimentally, it was observed that after initial response to some external stimulus, such as sudden changes of aspartate concentrations, the bacteria tumbling frequency often reverts to its original value with high accuracy, independent of the strength of the external stimulus (Berg, 1972). This accurate adaptation is generally believed to contribute to the high sensitivity of bacterial chemotaxis to a wide range of external stimulus (5 orders of magnitude). In a recent work, Barkai and Leibler (Barkai, 1997) investigated the robustness of perfect adaptation in bacterial chemotaxis, they used a two-state (active or inactive) model (Asukura, 1984) for the receptor complex in explaining the phenomena. In their model, they assumed that CheB only demethylates active receptors, whereas CheR methylates all receptors indiscriminately. They showed, by extensive simulation of the two-state model, that as long as the above conditions are satisfied, adaptation is achieved with high precision, independent of specific values of the rate constants or enzyme concentrations. In a subsequent study, Alon et al. (1999) provided experimental evidence for the robustness of the perfect adaptation over large variations in chemotactic protein concentrations.
The Barkai-Leibler (BL) model clearly captured one of the essential ingredients for perfect adaptation in bacterial chemotaxis. Recently, Yi, Huang, Simon and Doyle (Yi, 2000) further studied the Barkai-Leibler model analytically, and summarized all the conditions for perfect adaptation within the BL model beyond those identified in the original paper. However, the BL model is a simplified description of the real chemotaxis pathway. For example, the BL model neglects the phosphorylation part of the pathway altogether and assumes the saturation of methylation enzyme CheR, which is questionable (Morton-Firth, 1999).
In this work, we study a more complete model of the chemotaxis signal transduction pathway, similar to the deterministic version of the model proposed by Morton-Firth et al. (1998), where both the methylation and phosphorylation processes are taken into account. Our goals are to understand whether (mathematically) perfect adaptation, defined as when steady-state CheY-P concentration is independent of ligand concentration, can be achieved for the full model, and to identify the conditions for such perfect adaptation. The sensitivity of the perfect adaptability, or robustness, is then studied by perturbing these conditions. Such study can help us understand adaptation in real biological systems where not all the perfect adaptation conditions are satisfied, it can also provide possible explanations for cases where perfect adaptation is not achieved, e. g., for serine response (Berg, 1972).
MODEL
| Species | Description | Concentration |
|---|---|---|
| Total taxis aspartate | ||
| receptor (Tar) | ||
| Receptor with methyl groups, | ||
| ligand binding site occupied | ||
| () or vacant () | ||
| Free (CheR and CheB | ||
| unbound) receptor | ||
| Phosphorylated receptor | ||
| Unphosphorylated receptor | ||
| CheR | ||
| Free (not bound to ) CheR | ||
| CheB | ||
| Free (not bound to ) CheB | ||
| Phosphorylated CheB | ||
| Free phosphorylated CheB | ||
| CheY | ||
| Phosphorylated CheY |
For the purpose of this study, we consider only those receptors that form complex with CheW and CheA. We label the receptor complex by , where is the number of methyl groups added to the receptor and represents the ligand occupied () and vacant () state of the receptor. Superscripts are also used to describe whether the receptor complex is phosphorylated () or un-phosphorylated (), bound to CheR/CheB-P or free (). Superscript () is used to label total concentrations of different proteins. The superscripts are not mutually exclusive, e. g., is the concentration of phosphorylated free (not bound to receptor) CheB. In table 1, some of the chemical species of the chemotaxis pathway are shown, where the values of the total concentrations are taken from (Morton-Firth, 1999), except for the total CheR concentration, which we have reduced slightly in order to have the same average methylation level as reported in (Morton-Firth, 1999), where receptors other than Tar were included in the simulation.
| Ligand binding | ||
|---|---|---|
| Methylation | ||
| Phosphorylation | ||
The bacterial chemotaxis pathway can be divided into 3 processes: receptor ligand binding, receptor methylation/demethylation and phosphorylation of CheA, CheB and CheY. The reactions involved in each of the three processes are listed in table 2. Since the ligand binding process is much faster than the other two, the ligand binding reaction can be considered to be always in quasi-equilibrium. The receptor’s ligand binding status directly affects both the CheA auto-phosphorylation rate and the receptor methylation/demethylation rates. The CheA auto-phosphorylation rate is also affected by the methylation state of the receptor. Finally, since only the phosphorylated CheB can efficiently demethylate the receptor, the methylation process is also affected by the phosphorylation process.
Some conformational change of the receptor complex is probably responsible for the signaling from binding of ligand to methylation and phosphorylation of the receptor complex (Bren, 2000; Falke, 1997; Liu, 1997). The two-state model proposes that the receptor complex has two states, active and inactive, with only the active state capable of auto-phosphorylation. For a receptor with methyl groups and a ligand occupancy status described by (vacant, , or occupied, ), the probability of being active is denoted by . However, there has been no direct experimental evidence in support of the two-state model (Yi, 2000). More generally, can be simply understood as the relative receptor activity for receptor and the CheA auto-phosphorylation rate is proportional to :
| (1) |
where is a constant independent of and .
In the following, we write down all the equations for the reactions listed in table I.
-
1.
The ligand binding reaction is given by:
(2) Since the time scale for ligand binding is much shorter than the other reactions, the ligand binding reaction can be assumed to be in quasi-equilibrium and the two populations for each methylation level can then be written as:
(3) (4) where , is the receptor occupancy rate, is the ligand concentration and is the total receptor population in methylation level . The ligand receptor dissociation constant probably depends on the methylation level of the receptor (Dunten, 1991; Borkovich, 1992; Bornhorst, 2000; Sourjik, 2002), however it will become clear later that this does not affect the perfect adaptation conditions.
-
2.
The methylation/demethylation reactions can be written as:
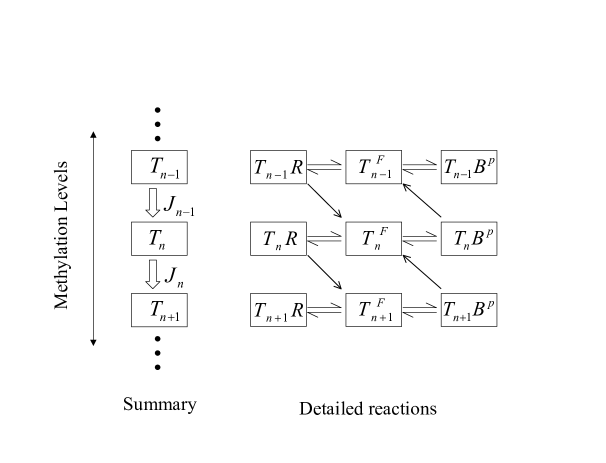
(5) where the enzyme is either R (CheR) or B (CheB-P). Here we assume the methylation/demethylation process at the 4 methylation sites follows a preferred sequence, and therefore the existence of only 5 methylation states described by . Though this assumption is still an open question, it is supported by some experiments (Shapiro, 1994; Shapiro, 1995). The network of methylation/demethylation reactions are illustrated in Fig. 1.
If we assume the above reactions follow Michaelis-Menten kinetics and the dissociation rates for the bound state are independent of , i.e., whether the receptor is ligand bound or not, the bound state concentration can be written as:
(6) where is the Michaelis constant of the combined (vacant and ligand-bound) receptor state and the superscript denotes the free enzyme and the free substrate (receptor) concentrations.
Since the receptors and the enzymes can exist either in their free form or bound to each other, the total concentrations of enzymes, and the concentration of receptors with methylated sites are given by the following equations:
(7) (8) (9) where the , and are the concentrations of CheR, phosphorylated CheB and receptors with methyl groups, respectively.
The kinetic equation for the receptor concentrations at each methylation level can be written as:
(10) where is the net flux from methylation level to level , which is just the difference of methylation and demethylation rates between these two states. Using the bound state concentration given in Eq. 6, can be written as :
(11) where and are the catalytic constants for the methylation and demethylation reaction respectively, which are assumed to be independent of , the ligand binding status of the receptor. The boundary conditions for the methylation flux are: .
-
3.
The auto-phosphorylation of CheA reaction is given by:
(12) the phosphate group is subsequently transferred from CheA-P to CheB and CheY:
(13) (14) While CheB-P dephosphorylates spontaneously, the CheY-P hydrolysis is enhanced by the phosphatase CheZ, an effect that is included in the high hydrolysis rate for CheY-P (Lukat, 1991):
(15) (16) The kinetic equations for these reactions are:
(17) (18) (19) where , and . is the net phosphorylated receptor flux between methylation level n and , given similarly as for in Eq. 11 with the free receptor concentration replaced by the phosphorylated free receptor concentration . In all the above equations, the dependence on is omitted, so the autophosphorylation rate and the phosphate transfer rates should all be considered as the rate for the combined receptor state (ligand occupied and unoccupied): , , . It is also assumed that only CheB-P can bind with the receptors, which leads to the equation relating different subspecies of CheB:
(20)
To describe the kinetics of the signal transduction pathway in full, we need to consider the interactions among the concentrations of all the 65 states for the 4 chemical species: 60 receptor states = 2 ligand binding states 5 methylation states 3 enzyme binding states 2 phosphorylation states, 1 free CheR state, 2 free CheB states and 2 CheY states. Using the fact that ligand binding kinetics is fast and the enzymatic reactions are governed by Michaelis-Menten kinetics, the number of independent receptor concentrations is reduced from 60 to just 10, consisting of the 5 free methylation states and the 5 phosphorylation states. Now, the whole system is described by kinetic equations Eq. 10 and Eq. 17-19 plus conservation equations given by Eq. 7-9 and Eq. 20.
Concentration of the phosphorylated CheY ([YP]), which determines the tumbling frequency of bacteria, can be considered as the output of the whole chemotaxis signal transduction pathway. In the next section, we study how the steady state concentration of CheY-P depends on the external ligand concentration , in particular, we derive a set of conditions for [YP] to be independent of , i.e., perfect adaptation.
CONDITIONS FOR PERFECT ADAPTATION
All the concentrations in our model fall naturally into two categories: the local variables defined for one particular methylation level, such as , the concentration of receptors with methyl groups, and the global variables, such as , the concentration of the free CheR. The system adapts by adjusting the local variables with the ligand concentration, e. g., the steady-state values of varies with . However, perfect adaptation is achieved when the equilibrium value of [YP], a global variable, is independent of the ligand concentration (Othmer, 1998). This is generally not possible because the global variables are coupled with the local ones. One goal of this paper is to discover the conditions under which becomes independent of .
The strategy in obtaining the perfect adaptation conditions is to consider only global equations, such as the conservation equations of the chemical species (e.g., Eq. 7, 8 and 20) and the steady-state equations of global variables (e.g., Eq. 17 and 18), which do not depend on any one specific methylation level. In these global equations, there is no explicit dependence on ligand concentration, and composite variables, such as in Eq. 7, enter as weighted sums of the methylation level specific receptor concentrations. Another kind of global equation can be constructed by summing steady-state equations at all methylation levels (e.g., Eq. 9, 11 and 19). The price to pay for such global equations is the introduction of new composite variables. However, if the reaction rates involved in different reactions are related in certain ways, the same composite variables appear in different global equations so that there are enough global equations to determine all the independent global and composite variables. In other words, if certain conditions between reaction rates are satisfied, the steady-state concentrations of all the global and composite variables including can be independent of the ligand concentration, i.e., perfect adaptation.
We leave the detailed derivation for the perfect adaptation conditions to the appendix. In the following, we list these conditions, discuss their meaning and compare them with those found in previous works (Barkai, 1997; Yi, 2000). The perfect adaptation conditions can be grouped for each of the three pathway processes: condition 1 is for the ligand binding and unbinding, conditions 2-4 are required for the methylation process and conditions 5-6 are related to the phosphorylation process:
-
1.
The time scale for ligand binding is much shorter than the methylation and phosphorylation time scale. This condition allows us to neglect ligand binding/unbinding kinetics.
-
2.
The association rates between the receptor and the methylation/demethylation enzymes, CheR and CheB-, are linearly related to the activity of the receptor and are zero for and , respectively: and . The dissociation rates of the enzyme receptor bound states are independent of .
-
3.
The receptor activities of the non-methylated and the maximally methylated receptors are independent of : , .
-
4.
The ratios between the CheR catalytic rate () and the CheB-P catalytic rate of the next methylation level () are the same for all methylation states : .
-
5.
The phosphate transfer rates from CheA to CheB or CheY are proportional to CheA auto-phosphorylation rate: , .
-
6.
The explicit dependence on [] distribution can be removed from the expression
(21) This condition can only be strictly satisfied when .
Condition 1 is necessary to decouple the ligand binding process from the rest of the reactions. This is verified experimentally and assumed in all the previous models (Barkai, 1997; Morton-Firth, 1998; Spiro, 1997; Yi, 2000).
Condition 2 for the methylation process requires that the CheR and CheB methylation/demethylation rates depend linearly on the receptor’s auto-phosphorylation rate (activity) . This is a generalization of the key ingredient for perfect adaptation found in Barkai and Leibler’s work (Barkai, 1997). In the special case of and , condition 2 means that CheB-P only bind to active receptors and CheR only bind to inactive receptors, the latter is missed in the original work of BL and later found to be necessary for perfect adaptation in (Morton-Firth, 1999) through a direct numerical simulation of the full system.
The requirement in condition 3 that and be independent of is needed so that both the ligand-bound and vacant receptors have the same range of activity. This requirement for perfect adaptation is necessary in case the extreme methylation states or become populated with receptors.
Condition 4 was first pointed out in (Yi, 2000), it is a more general form of the assumption that both and are independent of made in the original BL model. The justification of this condition may be related to a common evolutionary origin of CheR and CheB, resulting in a similar anchoring position to the receptor for CheR methylating site and CheB-P demethylating site (Shapiro, 1994; Shapiro, 1995; Djordjevic, 1998; Barnakov, 1999).
Condition 5 for the phosphorylation process is very similar to condition 2, in the sense that the phosphate transfer rates of the receptors have to be linearly related to their activity. This condition was not discovered before because the phosphorylation process was neglected in previous works (Barkai, 1997; Yi, 2000).
Condition 6 can only be satisfied exactly when one tunes the parameters such that the pre-factor in front of the sum in Eq. 21 is zero. This condition was overlooked by most of the previous studies because the activities of the CheR or CheB-P bound receptors were neglected. However, in equilibrium, the population of enzyme bound receptors can be as high as (Morton-Firth, 1999).
| Symbol | Description | Value | ||||||||||||||||||
|---|---|---|---|---|---|---|---|---|---|---|---|---|---|---|---|---|---|---|---|---|
| Relative activity of |
|
|||||||||||||||||||
| CheR Michaelis constant | ||||||||||||||||||||
| CheB Michaelis constant | ||||||||||||||||||||
| CheR catalytic constant | ||||||||||||||||||||
| CheB catalytic constant | ||||||||||||||||||||
| CheA autophosphorylation rate | ||||||||||||||||||||
| CheACheY phosphorus transfer rate | ||||||||||||||||||||
| CheACheB phosphorus transfer rate | ||||||||||||||||||||
| CheY dephosphorylation rate | ||||||||||||||||||||
| CheB dephosphorylation rate |
By imposing all the conditions above, the steady state concentrations of the global variables will be independent of the ligand concentration, and are determined by 15 parameters: the 4 total concentrations of table 1, and 11 reaction rates of table 3, including and , but not the relative activity values for the rest of the methylation states. However, for real biological system, these conditions for perfect adaptation may not be strictly satisfied. In order to understand bacteria’s ability in adapting accurately under different internal and external conditions, i. e., robustness, we need to evaluate the effect of violating these perfect adaptation conditions.
EFFECTS OF VIOLATING THE PERFECT ADAPTATION CONDITIONS
| Species | |||
|---|---|---|---|
| 0.028 | 0.025 | 0.002 | |
| 0.605 | 0.316 | 0.089 | |
| 1.104 | 0.923 | 0.637 | |
| 0.637 | 0.947 | 1.159 | |
| 0.072 | 0.289 | 0.613 | |
| 1.257 | 1.250 | 1.274 | |
| 0.202 | 0.201 | 0.204 | |
| 0.050 | 0.050 | 0.050 | |
| 1.603 | 1.602 | 1.603 | |
| 1.858 | 1.857 | 1.860 | |
| 1.191 | 1.190 | 1.193 | |
| 1.200 | 1.196 | 1.209 |
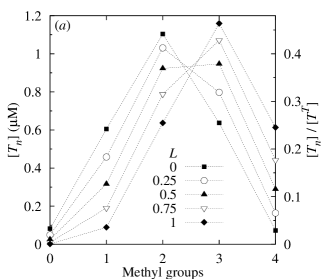
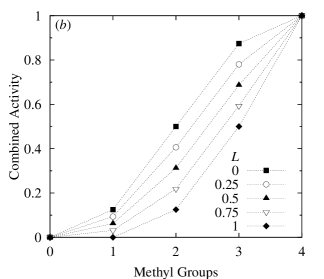
Since it is not feasible to explore the whole parameter space, we choose to mostly perturb around the parameter values that have been used in previous studies. To this end, we take most of our parameters from (Morton-Firth, 1999), which are listed here in Table II and Table III. Hereafter we refer to this set of parameters as the reference parameters. Assuming ligand occupancy rate is independent of , the steady state receptor distributions in different methylation states for different ligand occupancy rates is shown in Fig. 2 for the reference parameters. In Fig. 2 , the population-weighted average receptor activities for methylation level is also shown. As is clear from Fig. 2, when ligand (attractant) occupancy rate increases, the average receptor activity decreases for each methylation level , and the system adapts by shifting the receptor population towards higher methylation states in achieving constant total activity . The steady state concentrations of all the other relevant concentrations at 3 different ligand occupancy fractions are given in Table IV for the reference parameters, the small changes in at different ligand concentrations are caused by violation of conditions 5 and 6 in the reference model used in (Morton-Firth, 1999) as we explain later in the section “Violating condition 5”.
We have also constructed another model by modifying some of the reference parameters so that all the perfect conditions are satisfied. The results of perturbing this new model are essentially the same as for the reference model, mainly because the adaptation error in the reference model is very small (). While this new model is mathematically more rigorous for isolating different error sources, the reference model has the advantage that it is motivated biologically (from experiments or common sense), and therefore serves as a better starting point in exploring the parameter regions that are more likely to be biologically relevant. To make sure violation of conditions 5 and 6 in the reference model does not contaminate the effect of other conditions too much, we have always checked the error with and without violating the condition in consideration, and made sure most of the error does come from violating the perfect condition we study.
Since ligand binding is much faster than other relevant processes of the system, we do not consider the unrealistic situation of violating condition 1. In the following, we study the effects of breaking the other 5 perfect adaptation conditions. Our goal is to understand the general reason behind the robustness of the system with respect to breaking each perfect adaptation condition. Even though we primarily perturb the system around the reference parameters, we also explore other parameter regions, especially when the reference model becomes insensitive to violation of a given condition. This strategy allows us to gain the general understanding of where in the parameter space a given perfect adaptation condition becomes important and the reason behind it.
Violation of condition 2
Condition 2 requires that the methylation/demethylation enzyme binding rates to a receptor depend linearly on the activity of the receptor. For the reference parameters, where and , condition 2 simply means that CheR only binds to inactive receptors and CheB-P only binds to active receptors. The simplest way in violating condition 2 is to allow CheR bind to active receptor or CheB-P bind to inactive ones , which can be formally expressed as:
| (22) |
where and are the measures of violating condition 2; and are normalization factors tuned with respect to and to keep the total activity of the system constant at a given ligand occupancy rate (L=0.5) for comparison purpose. and corresponds to condition 2 being satisfied; (with ) or (with ) respectively corresponds to CheR or CheB-P binding to all receptors equally.


In Fig. 3, we show the steady-state concentration of CheY-P versus the ligand occupancy rate for various values of and . Even for the extreme cases of or , respectively corresponding to CheR or CheB-P binding to both active and inactive receptors equally, the deviation from perfect adaptation is only . Intuitively, the reason for the near perfect adaptation is that the control of the system’s total activity can be carried out by either the methylation (CheR) or demethylation (CheB-P) process, provided that at least one of the enzymes’ binding rates is strongly correlated with the receptor activity. If the receptor binding rates of both enzymes become independent of the receptor’s activity, i. e., both and , the system is only controlled through the weak effect of CheB phosphorylation and does not adapt very well.
Specifcally, condition 2 requires that CheR does not bind to the fully methylated receptors (n=4), and CheB-P does not bind to the unmethylated receptors (n=0). Therefore, the quantitative effects of breaking condition 2 (as in Eq. 22) depends on the receptor concentration at the fully methylated state or the unmethylated states (see appendix for details). Both and are relatively small for the reference parameters with (see Fig. 2), which explains the qualitative features in Fig. 3. The effect of only becomes noticeable because is not too small for .
Violation of condition 3

Since adaptation for bacterial chemotaxis relies on balancing the effect of ligand binding on the receptor’s activity with that of the methylation of the receptor, a necessary condition for perfect adaptation is for both ligand bound and vacant receptors to have the same range of activity, i.e., condition 3. For the reference parameters, condition 3 is obeyed by having: ; . Without changing the monotonic dependence of the receptor activity on their methylation level, we can break condition 3 at by increasing from to ; or at by decreasing from to . The enzyme binding rates are adjusted accordingly in keeping condition 2 satisfied. The effects are shown in Fig. 4. The system is insensitive to the opening of the activity gap at , because the receptor population is small at even at . For the same opening of activity gap at , the adaptation error is . In particular, the system has lower CheY-P concentration at higher ligand occupancy rate , because the receptor population shifts towards higher methylation levels at larger , and the effect of methylation is not large enough to cancel the decrease of activity caused by ligand binding. Quantitatively, the adaptation error increases with the activity gap; e.g., it reaches when we lower further to .
Violation of condition 4

The methylation and demethylation catalytic rates and can depend on methylation level . From Eq. 11, the steady-state properties of the system only depend on the ratios: for . Condition 4 for perfect adaptation requires that be a constant independent of , a kind of “detailed balance” condition. Indeed, if we change and while keeping constant, the system adapts perfectly. However, when we make depend on , perfect adaptation is lost. In Fig. 5, we show the effects of increasing one by a factor of 2 while keeping the rest unchanged at their reference value for respectively. The quantitative deviation from perfect adaptation depends on , with the largest deviation of occurring at , possibly because the receptors are highly populated at for the reference parameters.
Violating condition 5
Condition 5 requires that the phosphate transfer rates of a receptor is proportional to its auto-phosphorylation rate, a kind of compatibility condition. The simplest way to break condition 5 is to set the phosphate transfer rates to be a constant independent of both the ligand binding and the methylation level of the receptor. This assumption is also made in (Morton-Firth, 1998; Morton-Firth, 1999).

For the reference parameters, the steady-state change by less than 1% over the whole range of ligand occupancy as shown in Fig. 6 (curve ), indicating the insensitivity of the system’s perfect adaptation with respect to this particular choice of breaking condition 5. In the following, we explain the system’s near perfect adaptation by the existence of approximate global equations.
In deriving condition 5, a global equation is formed by summing Eq. 19 over all methylation levels and replacing by , which leads to the formation of 4 composite variables: , , and . Condition 5 is needed to make , and proportional to each other, so that the total number of global equations is enough to solve for all the independent global and composite variables (see section “Conditions for perfect adaptations” and Appendix for details). When condition 5 is broken by setting and to be constant, and are still proportional to each other, but they are now different from , the total number of global equations are now not enough in solving for all the global variables, and local equations have to be used. This leads to all the global variable depend on ligand concentration, i.e., non-perfect adaptation. However, because the concentration of (un-phosphorylated) CheY is much larger than the receptor concentrations, the phosphorylated receptor concentration is small compared with the total receptor concentration , due to efficient phosphate transfer from CheA to CheY and the subsequent high CheY-P dephosphorylation rate. As a result, is negligible relative to , leading to an approximate global equation with the same degree of reduction in independent composite variables and eventually the near perfect adaption observed in Fig. 6 .
However, reducing CheY concentration alone does not change too much the system’s ability in perfect adaptation, as shown in Fig. 6 (curve ). At low CheY concentration, the phosphate group of CheA-P goes to CheB. Because of the slow dephosphorylation rate of CheB-P, most of the CheB become phosphorylated in steady state, essentially decoupling the phosphorylation process from the adaptation process. The adaptation of the system therefore becomes insensitive to the phosphorylation related condition 5.
To amplify the effect of violating condition , we reduce the overall activity to at by making . The result is shown in Fig. 6 (curve ). The adaptation accuracy can also depend on other parameters, such as the receptor activity . In Fig. 6 (curve ), we show that a slight change in receptor activity leads to higher deviation from perfect adaptation.
Violating condition 6
The total receptor activity is directly related to the final production of CheY-P. However, only part of can be expressed in terms of other composite variables related to receptor population, i. e., the total free receptor concentration and the total activity due to free receptors . It has an extra term coming from the activity of the enzyme (CheR or CheB-P) bound receptors (see appendix for details), which is proportional to with a pre-factor (see Eq. 21). Condition 6 is required to eliminate this extra global variable by setting the pre-factor to zero.


The effect of breaking condition 6 can be small, because as deviates from its perfect adaption value , so does with the same trend, leading to small changes of the pre-factor in . Also, part of can be approximated by a linear combination of and , depending on the activity levels of different receptors . Finally, for higher total activity, the relative effect of will be small. For the reference parameters, the accuracy of adaptation is better than for 4-fold change of CheR concentration from its perfect adaptation value, as shown in Fig. 7 . The adaptation accuracy decreases as we lower the total activity by decreasing methylation rate , as shown in Fig. 7 . Finally, when we increase the activity differences between the ligand bound and the vacant receptors by setting: , ; , , the same change in can cause more than a 50% error in adaptation, as shown in Fig. 7 .
COMPARISON TO STOCHASTIC SIMULATION AND EXPERIMENTS
The results from the previous sections can be compared with both the discrete stochastic numerical simulation and real experiments. We use the reference parameters for all the comparison studies.
Comparison to stochastic simulation
Stochsim (Morton-Firth, 1998) is a general purpose stochastic simulator for chemical reactions. For our study, the volume of Stochsim simulation is set to be , and the number of molecules is therefore concentration (in M).


In Fig. 8 , we show the Stochsim simulation result for the reference parameters, which agrees well with the results from simulating our continuum equations with the same parameters. In Fig. 8 , we show the Stochsim simulation result for the parameters used in Fig. 7 with , where perfect adaptation is lost because of violation of condition 6. As predicted from our deterministic model, after sudden changes of ligand occupancy rate , does not always return to its pre-stimulus level; in fact, the maximum error () is observed when , consistent with Fig. 7 .
For most of the results shown in this paper, we have compared with the results from stochastic simulation using Stochsim (data not shown). Overall, the averaged behaviors of Stochsim simulations are consistent with our continuum model, which is interesting given the nonlinear nature of the chemical kinetics. Further work is needed in characterizing the fluctuation of the individual Stochsim simulations, and compare them with the fluctuations in behavior among different individual bacteria (Morton-Firth, 1998).
Comparison with experiment
In a recent experimental study by Alon et al (Alon, 1999), mutant bacteria lacking a certain chemotaxis protein, such as CheR, CheB, CheY or CheZ, are used, and the missing protein is reintroduced in a controlled fashion through a plasmid inserted into the mutant bacteria cells. This technique allowed these authors to study the effect of various enzyme concentration changes on the chemotaxis behavior of the bacteria. Specifically, the tumbling frequency of the bacteria is measured through a sudden increase of ligand concentration, which effectively corresponds to a sudden change of ligand occupancy rate from to .
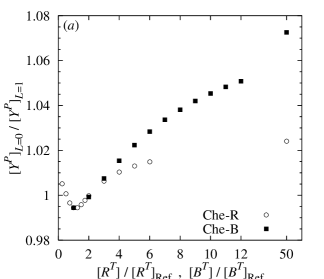
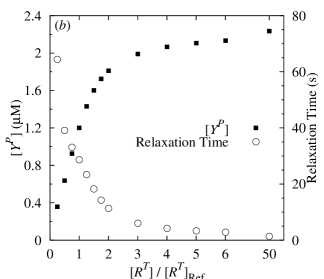
In Fig. 9 , we show the adaptation precision as the ratio between phosphorylated CheY level before and after the stimulus for various CheR and CheB concentrations. For CheR concentration change of up to 50 fold with respect to the reference value, the adaptation error is , somewhat smaller than the experimentally measured adaptation error cited in (Alon, 1999). If , instead of , is changed, the adaptation error would be much bigger, as shown in Fig. 9 . This is the case because for large values of , the low activity and the large values of make the violation of condition 5 and 6 more significant. This could explain the larger (1.09) adaptation precision reported in (Alon, 1999) when expression is 12 times that of the wild type values. Since we define adaptation accuracy based on CheY-P concentration, the quantitative difference between the adaptation error observed in (Alon, 1999) and those of our model could be explained by the signal amplification at the motor level (Cluzel, 2000).
The relaxation time of the system after a sudden change in ligand concentration can be determined by direct simulation of the full kinetic equation or by linearizing the methylation/demethylation kinetic equations around the steady state. The dependence of both the steady-state tumbling frequency and the linear relaxation time on CheR concentration is shown in Fig. 9 . They agree qualitatively with the steady state tumbling frequency and the relaxation time measured in (Alon, 1999), as depicted in Fig. 2 of their paper, although direct quantitative comparison is not possible due to different definitions of relaxation time and lack of detailed understanding on how CheY-P regulates the motor.
DISCUSSIONS AND CONCLUSIONS
In this paper, we have studied a theoretical model describing the full chemotaxis signal transduction pathway. Through systematic analysis of the steady state properties of the model, we derive a complete set of conditions for the system to adapt exactly. Some of the conditions are generalizations of the ones discovered before, but others, in particular, the conditions related to the phosphorylation part of the pathway, are discovered for the first time here. It is quite remarkable that perfect adaptation can be achieved for arbitrary ligand concentration with a small set of conditions, far less than the number of variables and the number of reaction rate constants in the problem.
The (intrinsic) state of a receptor can be described by its ligand binding status () and methylation level (). The (external) properties of the receptor complex include its abilities to interact with the methylation/demethylation enzymes, to undergo autophosphorylation, and to transfer its own phosphate group to CheY or CheB, all of which depends on the (internal) state of the receptor characterized by and . Perfect adaptation requires these three properties of the receptor complex to be correlated with each other in a linear fashion for any given receptor state (condition 2 and 5). Available experimental data that addresses the validity of such connections has been discussed extensively in (Yi, 2000). Even though the evidence for such connections is not well established and the correlation may not be linear, it is conceivable that a high degree of correlation exists among these three properties of the receptor, because they are determined by the same conformational change of the receptor protein complex for a given receptor state .
Since most of the perfect adaptation conditions are relations between different reaction rates, the system’s ability to adapt accurately can be considered “robust” in the sense that the perfect adaptation is independent of concentrations of any specific chemotaxis protein, which can fluctuate between different individual cells and at different stage of the cell development. Only one of the perfect adaptation conditions requires the fine tuning of the methylation enzyme concentrations (condition 6). Because of this condition, in the strict mathematical sense, the perfect adaptation of the system can only be achieved via fine tuning of a parameter, and therefore cannot be considered robust. However, as we have shown in this paper, the effect of violating this condition can be rather small, especially at the reference parameters.
The discovery of the perfect adaptation conditions provides an invaluable starting point in exploring the parameter space. We evaluate the sensitivity of the system’s perfect adaptation ability by perturbing the perfect adaptation conditions. We find that the system can adapt near perfectly even in the absence of some of the perfect adaptation conditions. In finding the perfect adaptation conditions, we focus on studying equations which do not depend on any individual methylation levels, these global equations are obtained by either conservation laws or summing steady-state equations over different methylation levels. The same approach is also useful in understanding the near perfect adaptation when the perfect adaptation conditions are violated. Technically, we can explain the near perfect adaptation by the existence of approximate global equations replacing the ones lost due to the violation of perfect adaptation conditions. Biologically, these approximate global equations are caused by various intrinsic properties of the system, such as separation of scales in protein concentrations and reaction rates, or specific properties of the receptor distribution in different methylation states. Since real biological systems are not likely to satisfy all the perfect adaptation conditions exactly, the abundance of such near perfect adaptation regions in the parameter space strongly limits the range of activity variation and is probably responsible for the robustness of the system’s ability to adapt almost perfectly.
Through systematic study of the system’s behavior when different perfect adaptation conditions are violated, we have also identified parameter regions where significant deviation from perfect adaptation occurs. This may provide possible explanations to bacterial chemotaxis responses that does not adapt accurately, such as the serine response as reported in (Berg, 1972), and constitute concrete predictions that can be experimentally verified.
Aside from perfect adaptation, another challenge for modelling bacterial chemotaxis is to understand the large signal amplification from ligand concentration change to the change in bacterium flagella rotation bias. To directly compare between experiments and simulation, detailed information between CheY-P concentration and the motor rotation bias is needed. Recently, the connection between CheY-P level and the motor activity was investigated in (Scharf, 1998; Alon, 1998; Cluzel, 2000). In (Cluzel, 2000), where rotation bias of single bacterium was measured for different [YP] concentrations, it was shown that the motor bias for individual bacterium should be fitted by a Hill function with a large Hill coefficient . This highly nonlinear function may explain the advantage of perfect adaptation in amplifying the gain, and also the nonlinear dependence of , the CCW rotation bias, on changes in ligand occupancy as found in (Jasuja, 1999). However, quantitatively, from (Cluzel, 2000), the maximum signal amplification from change in to the tumbling frequency is measured to be: . With the reference parameters in our model, this leads to a total signal amplification of , which is still much too small as compared with the total signal amplification measured in experiments, e.g., as reported in (Jasuja, 1999).
The gain of the system could come from receptor clustering as suggested in (Bray, 1998). However, to reconcile the existence of high gain and the wide dynamic range of response, it is highly desirable to have high gain for the signal transduction pathway itself. One of the interesting findings of our study is that if the system satisfies all the perfect adaptation conditions, the steady state activity of the system is independent of the exact values of the receptor activity for . On the other hand, the response of the system, defined here as the difference of CheY-P concentrations between its extreme value after the stimulus and its original value before the stimulus, directly depends on the difference of receptor activity between ligand bound and ligand free receptors: . The higher these differences are, the higher the response will be. In order to have high response, it is favorable to increase and to have lower total activity. Indeed, if we simply increase the activity difference between the ligand bound and vacant receptor, such as those used in Fig. 7 , the total amplification can be increased to: . Other changes, such as reducing the system’s total activity, can enhance the gain much more, as noted also in (Barkai, 2001). A detailed study of the response of the system is outside the scope of this paper and will be reported in another communication.
Overall, the current model is capable of explaining the qualitative behaviors of the chemotaxis pathway related to adaptation, in particular, the robustness of the system’s ability to adapt nearly perfectly. Much work is still needed to modify and enrich the model to understand the high sensitivity and wide dynamic range of the system (Sourjik, 2002). However, because adaptation and response occur with very different time scale and via largely different molecular processes, modification of the model in explaining the high response gain should not change the perfect adaptation conditions significantly. Indeed, it is not hard to show that even with receptor coupling added to the current model, the conditions we identified in this paper are still needed for the system to achieve perfect adaptation, the only change is that activity of each receptor now depends also on its neighbors’ activities (B. Mello and Y. Tu, manuscript in preparation). We believe that, as long as the basic structure of the protein interaction network stays intact, the perfect adaptation conditions identified here will be mostly valid. These conditions not only offer explanation for adaptation accuracy and its robustness, furthermore, they serve as constrains for constructing quantitative models in understanding other aspects of the bacterial chemotaxis.
APPENDIX
In this section, we describe the detailed derivation of the perfect adaptation conditions listed in the section “Conditions for perfect adaptation”.As described there, the approach is to construct global equations using global and composite variables that do not depend on the receptor population in any one individual methylation state.
First, we concentrate on the methylation related equations. Eq. 7, Eq. 8 and summation of Eq. 9 over gives 3 global equations. For the steady state, the methylation flux between different methylation states should be zero:
| (23) |
Condition 4 can be used in factoring out the common dependent factor from and in , after which Eq. 23 are summed over to obtain a global equation.
Using condition 2, the Michaelis constants can be expressed as and , where and are constants. If we further enforce condition 3, i.e., and , we can convert all the weighted sums of the individual receptor concentrations into two composite receptor concentrations and . is the total concentration of the free receptors; is the total concentration of the active free receptors, where is the population-weighted average activity for a receptor with methyl groups. Therefore, after applying conditions 2, 3 and 4, the 4 methylation related global equations can be written as:
| (24) | |||
| (25) | |||
| (26) | |||
| (27) |
If is a constant (i.e., CheB-P binds equally to all receptors), condition 2 is violated. However, it is not hard to see that if the receptor population in the methylation state, , is small, we can still sum up the methylation balance equations to form a global equation. The same is true if is a constant and .
Next, we focus on the phosphorylation related equations. Besides its importance in producing the final output of the signal transduction pathway CheY-P, the phosphorylation is also coupled back to the methylation process through concentration . By writing and using condition 5: and , the phosphorylation related global equations can be written as:
| (28) | |||
| (29) | |||
| (30) |
Eq. 30 is obtained by summing Eq. 19 over . There are two composite variables, and in the above equations. is the total concentration of active receptors, is phosphorylated active receptor concentrations.
If the CheA phosphate transfer rates are independent of its ligand/methylation status, i.e., and , condition 5 is broken. A new composite variable appears in the above equations, replacing in Eq. 28, Eq. 29 and part of Eq. 30. However, if , e.g., due to efficient phosphate transfer from CheA to CheY, can be neglected, and there again will be only two composite variables in the phosphorylation related global equations, and therefore the system may still adapt near perfectly in absence of condition 5, as discussed in the section “Violating condition 5”.
The methylation and the phosphorylation global equations communicate through various CheB concentrations. An extra equation is necessary to connect the concentrations of these different forms of the same proteins:
| (31) |
Finally, by using Eq. 9, we can write down the expression for the total receptor activity of the system that appears in Eq. 30:
| (32) | |||||
The above equation contains a new composite variable . Condition 6 is thus required to eliminate this extra term. Part of can be expressed in terms of the other composite variables, such as and . Therefore, the effect of violating condition 6 can not be simply measured by the value of , as we discussed in the section “Violating condition 6”.
If all the conditions listed in Conditions for perfect adaptation are satisfied, we have nine global equations: Eqs. 24-32, these 9 global equations contains 5 global variables: , , , , , and 4 composite variables: , , , . Therefore, the steady state values of all the nine global or composite variables, including , will be independent of the ligand concentration and the system can achieve perfect adaptation.
We are thankful to Jeremy Rice, Geofferey Grinstein and Gustavo Stolovitzky for helpful discussions and careful reading of the manuscript. B. Mello has a scholarship from CNPq – Brazil.
REFERENCES
-
Alon, U., L. Camarena, M.G. Surette, B. Aguera y Arcas, Yi Liu, S. Leibler, and J. B. Stock. 1998. Response regulator output in bacterical chemotaxis. EMBO J. 17:4238–4248.
-
Alon, U., M.G. Surette, N. Barkai, and S. Leibler. 1999. Robustness in bacterial chemotaxis. Nature 397:168–171.
-
Asakura, S., and H. Honda 1984. Two-state model for bacterial chemoreceptor proteins. The role of multiple methylation. J. Mol. Biol. 176:349-367.
-
Barkai, N., and S. Leibler. 1997. Robustness in simple biochemical networks. Nature 387:913–917.
-
Barkai, N., U. Alon, and S. Leibler. 2001. Robust amplification in adaptive signal transduction networks. C. R. Acad. Sci. Paris 2:1–7.
-
Barnakov, A.N., L.A. Barnakova, and G.L. Hazelbauer. 1999. Efficient adaptational demithylation of chemoreceptors requires the same enzyme-docking site as efficent methylation. Proc. Natl. Acd. Sci. USA 96:10667–10672.
-
Berg, H.C., and D.A. Brown. 1972. Chemotaxis in Escherichia coli analysed by Three-dimensional Tracking Nature 239:500–504.
-
Borkovich, K.A., L.A. Alex, and M.I. Simon. 1992. Attenuation of sensory receptor signaling by covalent modification. Proc. Natl. Acad. Sci. USA 89:6756-6760.
-
Bornhorst, J.A., and J.J. Falke 2001. Evidence that Both Ligand Binding and Covalent Adaptation Drive a Two-state Equilibrium in the Aspartate Receptor Signaling Complex. J. Gen. Physiol. 118:693-710.
-
Bourret, R.B., and A.M. Stock 2002. Molecular information processing: lessons from bacterial chemotaxis J. Biol. Chem. 277:9625–9628.
-
Bray, D., R.B. Bourret, and M.I. Simon. 1993. Computer simulation of the phosphorylation cascade controlling bacterial chenmotaxis. Mol. Bio. Cell 4:469–482.
-
Bray, D., M.D. Levin, and C.J. Morton-Firth. 1998. Receptor clustering as a cellular mechanism to control sensitivity. Nature 393:85–88.
-
Bren, A., and M. Eisenbach. 2000. How signals are heard during bacterial chemotaxis: protein-protein interactions in sensory signal propagation. J. Bacteriol. 182:6865–6873.
-
Cluzel, P., M. Suette, and S. Leibler. 2000. An ultrasensitive bacterial motor revealed by monitoring signaling proteins in single cells. Science 287:1652–1655.
-
Djordjevic, S., P.N. Goudreau, Qingping Xu, A.M. Stock, and A.H. West. 1998. Structural basis for methylesterase CheB regulation by a phosphorylation-activated domain. Proc. Natl. Acad. Sci. USA 95:1381–1386.
-
Dunten, P., and D.E. Koshland, Jr. 1991. Tuning the responsiveness of a sensory receptor via covalent modofication J. Biol. Chem. 266:1491–1496.
-
Falke, J. J., R.B. Bass, S.L. Butler, S.A. Chervitz, and N.A. Danielson. 1997. The two-component signaling pathwaty of bacterial chemotaxis. Annu. Rev. Cell Dev. Biol. 13:457–512.
-
Hauri, D.C., and J. Ross. 1995. A model of excitation and adaptation in bacterial chemotaxis. Biophys. J. 68:708–722.
-
Jasuja, R., Yu-Lin, D.R. Trentham, and S. Khan. 1999. Response tuning in bacterial chemotaxis. Proc. Natl. Acad. Sci. USA 96:11346–11351.
-
Liu, Y., M. Levit, R. Lurz, M.G. Surette, and J.B. Stock. 1997. Receptor-mediated protein kinase activation and the mechanism of transmembrane signaling in bacterial chemotaxis. EMBO J. 16:7231–7240.
-
Lukat, G.S., B.H. Lee, J.M. Mottonen, A.M. Stock, and J.B. Stock. 1991. Roles of the high conserved aspartate and lysine residues in the response regulator of bacterial chemotaxis. J. Biol. Chem., 266:8348-8354.
-
Morton-Firth, C.J., and D. Bray. 1998. Predicting temporal fluctuations in an intracellular signalling pathway. J. Theor. Biol. 192:117–128.
-
Morton-Firth, C.J., T.S. Shimizu, and D. Bray. 1999. A free-energy-based stochastic simulation of the tar receptor complex. J. Mol. Biol. 286:1059–1074.
-
Othmer, H.G. and P. Schaap. 1998. Oscillatory cAMP signaling in the development of Dictyostelium discoideum. Comments on Theoretical Biology, 5:175–282.
-
Scharf, B.E., K.A. Fahrner, L. Turner, and H.C. Berg. 1998. Control of direction of flagellar rotation in bacterial chemotaxis. Proc. Natl. Acad. Sci. USA 95:201–206.
-
Shapiro, M.J., and D.E. Koshland, Jr. 1994. Mutagenic studies of the interaction between the aspartate receptor and methyltransferase from escherichia coli. J. Biol. Chem. 269:11054–11059.
-
Shapiro, M.J., D. Panomitros, and D.E. Koshland, Jr. 1995. Interactions between the methylation sites of escherichia coli aspartate receptor mediated by the methyltransferase. J. Biol. Chem. 270:751–755.
-
Sourjik, V., and H.C. Berg. 2002. Receptor sensitivity in bacterial chemotaxis. Proc. Natl. Acad. Sci. USA 99:123–127.
-
Spiro, P.A., J.S. Parkinson, and H.G. Othmer. 1997. A model of excitation and adaptation in bacterial chemotaxis. Proc. Natl. Acad. Sci. USA 94:7263–7268.
-
Yi, T., Yun Huang, M.I. Simon, and J. Doyle. 2000. Robust perfect adaptation in bacterial chemotaxis through integral feedback control. Proc. Natl. Acad. Sci. USA 97:4649–4653.