A continuous isotropic-nematic liquid crystalline transition of F-actin solutions
Abstract
The phase transition from the isotropic (I) to nematic (N) liquid crystalline suspension of F-actin of average length m or above was studied by local measurements of optical birefringence and protein concentration. Both parameters were detected to be continuous in the transition region, suggesting that the I-N transition is higher than 1st order. This finding is consistent with a recent theory by Lammert, Rokhsar & Toner (PRL, 1993, 70:1650), predicting that the I-N transition may become continuous due to suppression of disclinations. Indeed, few line defects occur in the aligned phase of F-actin. Individual filaments in solutions of a few mg/ml F-actin undergo fast translational diffusion along the filament axis, whereas both lateral and rotational diffusions are suppressed.
pacs:
61.30.Eb, 61.30.Jf, 64.70.Md, 82.35.Pq, 87.15.-vThe isotropic (I) to nematic (N) liquid crystalline transition occurs in solutions of rodlike particles including stiff polymers Sato97 , protein filaments Buxbaum87 ; Kerst90 , and filamentous viruses Tang95 . Such a phase transition is predicted to be 1st order based on statistical mechanical theories Onsager49 ; Flory69 . Landau and de Gennes deGennes94 treated the I-N transition by a general method of free energy expansion, as a function of the nematic order parameter, which contains a 3rd order term and thus predicts the I-N transition to be 1st order. This classic analysis led to the conventional wisdom that the I-N transition belongs to a different universality class as the magnetic systems, for which the order-disorder transition is generally continuous.
In a recent theory examining topology and nematic ordering by Lammert, Rokhsar & Toner (LRT) Lammert93 , it is shown, however, that the weakly 1st order I-N transition can break into two continuous transitions if the disclination core energy is raised sufficiently high. The LRT theory has been developed with the thermotropic nematogens in mind, although no particular experimental system has been shown to date in direct support of the theory. In this report, we first present experimental features of the I-N transition of F-actin, and then discuss the relevance of our findings to the theory of LRT.
The protein filaments F-actin provide us a challenging system to study the liquid crystalline transition. On one hand, since the protein is well characterized biochemically, special techniques such as fluorescence labeling are available to probe both structure and dynamics of an F- actin solution Kas95 . On the other hand, extreme polydispersity in filament length due to the stochastic nature of actin polymerization renders the theoretical analysis of the I-N transition less definitive than for the simpler monodisperse systems. Recent experimental studies show that F-actin forms a nematic phase at slightly above 2 mg/ml protein concentrations Kerst90 ; Coppin92 ; Furukawa93 ; Suzuki91 , and the onset actin concentration for the I-N transition is inversely proportional to the average filament length, Coppin92 ; Suzuki91 . There have also been bulk measurements suggesting a concentration range in which partially aligned domains exist Suzuki91 . The goal of our study was set to determine the I-N transition phase diagram by measuring local alignment of actin filaments, the co-existing domains of aligned filaments (N) and filaments with random orientations (I), all in close correlation with variation of local protein concentrations, c. Through these measurements, we discovered surprising features suggesting that the I-N transition of F-actin is continuous as a function of c.
For a sample of an aligned array of rodlike filaments, the difference in index of refraction between the direction of the alignment and the direction perpendicular to it can be measured optically. This difference, known as the optical birefringence, , is directly proportional to the order parameter of a uniaxial nematic suspension, , where is the orientational distribution function and is the 2nd Legendre polynomial. In this report, the birefringence measurements were performed on a Nikon TE-300 microscope, equipped with a Cambridge Research Inc (CRI) Polscope package (Cambridge, MA). The Polscope software is capable of determining at each pixel position, thus reporting local , as well as the directions of slow axis throughout the sample Oldenbourg95 . In contrast, other birefringence measurement techniques average over a bulk sample, and are prone to large variability due to cancellation of random orientations of separately aligned domains. The measured values by the Polscope can also be averaged over all pixel values for the entire field of view, free of the cancellation effect due to different alignment directions at different positions.
Fig. 1
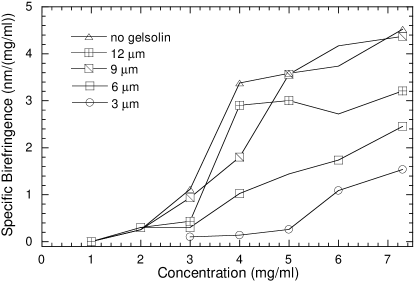
shows the birefringence of F-actin as a function of c and , measured using the Polscope technique. Rectangular capillary tubes of 0.4 mm thickness and 8 mm width were used to observe the alignment of F-actin in large domains. After injecting an actin solution of the desired concentration into the capillary tube immediately following the addition of 50 mM KCl and 2 mM to start polymerization, both ends were sealed with melted plastic. The sample was aligned by upside down inversions using a table top centrifuge. Repeated spins showed that the average birefringence of the sample reached a saturation value after two or three inversions (data not shown). Our measurements confirm the previous findings that the threshold concentration of the I-N transition is inversely related to [11, 13]. The specific birefringence, , increases with the c and reaches a saturated level at the long filament conditions. Further increase in c increased but not , suggesting that the entire sample was in the nematic state. Actin samples of shorter did not reach the saturation level for , suggesting that either the filaments were only weakly aligned, or that the measured value was the weighed average of co-existing domains. Variation of birefringence with position was observed, but usually over relatively large regions with no sharp boundaries. No clearly separated domains of either I or N phase were detected based on the birefringence measurements.
Co-existing I-N domains were expected theoretically to contain filaments of different concentrations, which is the basic criterion for a 1st order phase transition of a rodlike suspension. In order to detect the concentration difference between co-existing I-N domains of F-actin, TRITC- phalloidin (Sigma, St. Louis, MO) was added into F-actin to a ratio of 1/1000 and the intensity of fluorescence provided a quantitative report of concentration variation, especially in regions of the capillary where local birefringence varied. Measurements of birefringence and fluorescence were performed for F-actin samples in order to correlate variations of both parameters. Fig. 2
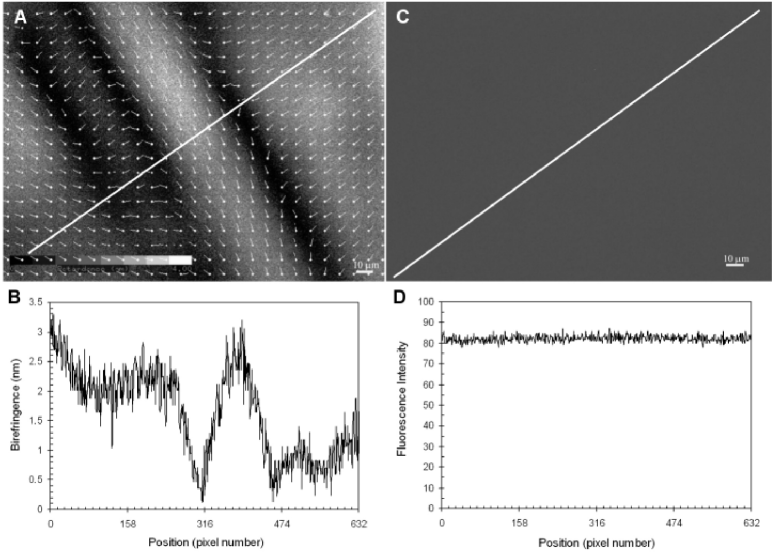
displays a set of combined measurements in one representative condition of a 7.3 mg/ml F-actin sample of m. It is shown in Fig. 1 that F-actin under this condition is in the I-N transition region. Therefore, one would expect to have I-N co-existence based on the theoretical predictions of a 1st order transition. The in the particular region shows alternating stripes of high and low values, a phenomenon reported earlier Coppin92 ; Suzuki91 . Such a zebra pattern with white stripes and black grooves appeared occasionally in both thick (up to 0.4 mm thickness using a rectangular capillary) and thin samples (m, for example, as shown in Fig. 2). Due to the continuous variation in both and direction of the slow axis over the entire region, the dark and bright areas do not correspond to separate I-N domains. The black grooves are not disclination lines Chandrasekhar86 . In most cases of our observations for the nematic samples of m, zebra patterns were either not formed, or too fuzzy to be discerned. Instead, the birefringence pictures appeared rather uniform, with few line defects. Disclinations were observed less frequent than once per hundreds of sample slides.
The corresponding fluorescence image (Fig. 2, C and D) shows constant c over the entire region of this sample. The same result of uniform concentration holds for weakly birefringent regions of less defined patterns, as well (data not shown). In all actin concentrations up to 7.3 mg/ml and m, we saw no discernable domain boundaries of co-existence based on the birefringence data. Instead, a blending of domains of comparable levels of alignment was occasionally observed, which led to either zebra patterns or other variants. In all cases, c was measured to be strictly uniform, forcing us to conclude that no co-existence occurred to F-actin spanning the region of I-N phase transition.
Additional experiments were performed to examine two possible causes for the lack of concentration variation in the I-N transition of F-actin. First, we suspected that the F-actin network at several mg/ml might be weakly crosslinked Tang99 . As a result, the polymerizing actin solution may first form a nematic phase when reaches the value required by the excluded volume effect. Further polymerization and/or annealing by the crosslinking effect may lead to gelation so that the network is unable to achieve its true thermodynamic equilibrium, with well separated I-N domains in co-existence. A second possibility is that the extremely long F-actin tend to get sufficiently entangled and thus kinetically trapped in a gel-like or glassy state with local orientational order but no global phase equilibrium. We address these concerns by mixing a small number of labeled filaments with 7 mg/ml unlabeled F-actin, both of m, and show that the labeled filaments undergo rapid thermal motions. Fig. 3
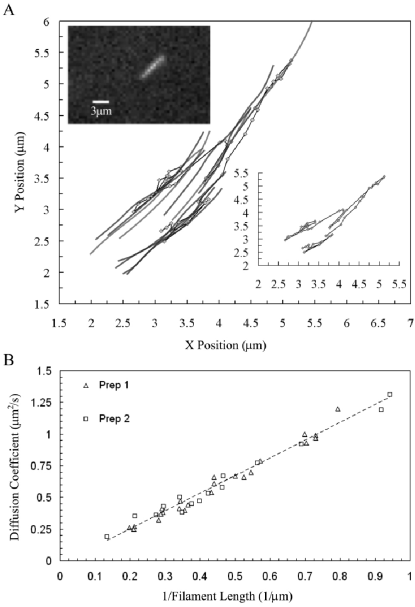
shows a time sequence of one filament in a nematic domain by overlaying images with 0.5 sec intervals. The filaments diffuse preferentially along their axis. The diffusion coefficient of each labeled filament was determined by calculating the over a movie sequence of 50–150 frames. The translational diffusion of labeled filament along its axis is found to be , where L, omitting its unit of m, is the length of the diffusing filament. The pre-factor of 1.30 obtained from the fit in Fig. 3 is smaller than the theoretical value of 3.90 for the translational diffusion along filament axis in the dilute limit. This reduction by a factor of 3 is not surprising since F-actin are highly entangled at a few mg/ml. In contrast, the lateral and rotational diffusion coefficients are suppressed by factors of at least 10 and 100, respectively, although we were unable to obtain these small values limited by the image resolution.
We propose that the I-N transition of F-actin of m corresponds to the continuous transition between a topologically ordered isotropic phase (T) and a weakly aligned nematic phase (N), as predicted theoretically by Lammert, Rokhsar & Toner (LRT) Lammert93 . First, the suspension of long (aspect ratio over 300) and stiff (persistence length m Gittes93 ) actin filaments satisfy one key criterion of defect suppression, which according to the LRT theory renders the transition continuous. The disclination lines are energetically costly for F-actin, as the bending elastic constant () is far greater than splay () and twist () for long and stiff rods Lee86 . Indeed, few line defects and nearly no disclinations were observed in F-actin samples. Second, suppression of rotational diffusion likely leads to breaking the inversion symmetry of long filaments in the concentrated F-actin. Therefore, vectorial directionality can be assigned to individual filaments, and in this context, the isotropic state becomes topologically ordered. A schematic phase diagram for F-actin as shown in Fig. 4,
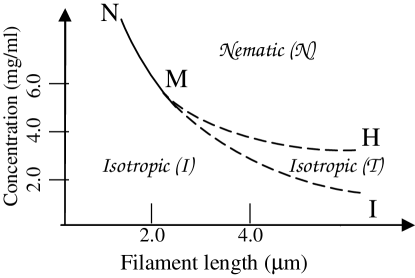
which translates the main predictions of the LRT theory, as depicted in Fig. 2 of ref. Lammert93 .
We now briefly discuss two other features that affect the I-N transition: the filament flexibility and the polydispersity of length. The flexibility is known to suppress the concentration gap between co-existing I-N domains. For instance, such a gap for the I-N transition of the semiflexible fd/M13 viruses is reduced to about 10% of the up limit concentration of the isotropic phase Tang95 , down from over 30% predicted by the Onsager theory for rigid rods Onsager49 . The fd or M13 virus has about the same diameter as F-actin, but a persistence length of m Tang95 , much shorter than that of F-actin (15–m) Gittes93 . Therefore, the effect of limited flexibility for F-actin is insufficient to lead to disappearance of the concentration gap characteristic of a 1st order transition for most polymer liquid crystals Ciferri82 . While polydispersity has been speculated as a possible cause of smearing the I-N phase boundary, calculations for bidispersed rods suggest not narrower but wider co-existing regions Vroege93 . Experimental study of polydisperse systems of short rods suggests a wider co-existence region for the I-N transition Buitenhuis95 .
Dogic and Fraden recently attempted to detect co-existence for the I-N transition of pf1, another filamentous bacteriophage of m length. Similar to our findings for the long F-actin, they observed no domain separation for the I-N transition (Dogic and Fraden, private communications). Since the pf1 virus has similar diameter and persistent length to fd/M13, but is twice as long, the different behavior between their I-N transitions implies that even the m filaments are perhaps too long to lead to domain separation. The similar behavior of pf1 to F-actin also supports the argument that polydispersity is unlikely to account for the observed continuous transition for F-actin, since pf1 viruses are monodisperse.
In summary, the I-N transition for F-actin of m is continuous in alignment and protein concentration. This experimental finding, and more importantly, its proposed relevance to the LRT theory, will likely provoke further query, such as a search for the I-T transition closely related to the T-N transition and the resultant critical fluctuations.
Acknowledgements.
We appreciate helpful discussions with Bob Pelcovits, John Toner, James Swihart, Seth Fraden, and Zvonimir Dogic. This work is supported by NSF DMR 9988389. Jorge Viamontes is a GAANN fellow, supported by the US Department of Education.References
- (1) Sato, T., Y. Jinbo, and A. Teramoto. Macromolecules, 1997. 30: 590.
- (2) Buxbaum, R.E., et al. Science, 1987. 235: 1511.
- (3) Kerst, A., et al. Proc. Natl. Acad. Sci., 1990. 87: 4241.
- (4) Tang, J.X. and S. Fraden. Liquid Crystals, 1995. 19: 459.
- (5) Onsager, L. Ann. NY Acad. Sci., 1949. 51: 627.
- (6) Flory, P.J., Statistical Mechanics of Chain Molecules. 1969, Interscience Publishers, New York.
- (7) de Gennes, P.G. and J. Prost, The Physics of Liquid Crystals. 1994, Clarendon: Oxford.
- (8) Lammert, P.E., D.S. Rokhsar, and J. Toner. Phys. Rev. Lett., 1993. 70: 1650. Phys. Rev. E, 1995, 52: 1778 and 1801.
- (9) Kas, J., et al. Biophys. J., 1995. 70: 609.
- (10) Coppin, C. and P. Leavis. Biophys. J., 1992. 63: 794.
- (11) Furukawa, R., R. Kundra, and M. Fechheimer. Biochemistry, 1993. 32: 12346.
- (12) Suzuki, A., T. Maeda, and T. Ito. Biophys. J., 1991. 59: 25.
- (13) Oldenbourg, R. and G. Mei. J. of Microscopy, 1995. 180: 140.
- (14) Chandrasekhar, S. and G.S. Ranganath. Adv. in Phys., 1986. 35: 507.
- (15) Tang, J.X., et al. Biophys. J., 1999. 76: 2208.
- (16) Lee, S.D. and R.B. Meyer. J. Chem. Phys., 1986. 84: 3443.
- (17) Gittes, F., et al. J. Cell Bio., 1993. 120: 923.
- (18) Ciferri, A., W.R. Krigbaum, and R.B. Meyer, eds. Polymer Liquid Crystals. 1982, Academic Press: New York.
- (19) Vroege, G.L. and H.N.M. Lekkerkerker. J. Phys. Chem., 1993. 97: 3601.
- (20) Buitenhuis, J., et al. J. of Colloid and Interface Science, 1995. 175: 46.