Solving the riddle of the bright mismatches:
hybridization in oligonucleotide arrays
Abstract
HDONA technology is predicated on two ideas. First, the differential between high-affinity (perfect match, PM) and lower-affinity (mismatch, MM) probes is used to minimize cross-hybridization r2 ; r3 . Second, several short probes along the transcript are combined, introducing redundancy. Both ideas have shown problems in practice: MMs are often brighter than PMs, and it is hard to combine the pairs because their brightness often spans decades r4 ; r5 ; r6 . Previous analysis suggested these problems were sequence-related; publication of the probe sequences has permitted us an in-depth study of this issue. Our results suggest that fluorescently labeling the nucleotides interferes with mRNA binding, causing a catch-22 since, to be detected, the target mRNA must both glow and stick to its probe: without labels it cannot be seen even if bound, while with too many it won’t bind. We show that this conflict causes much of the complexity of HDONA raw data, suggesting that an accurate physical understanding of hybridization by incorporating sequence information is necessary to perfect microarray analysis.
pacs:
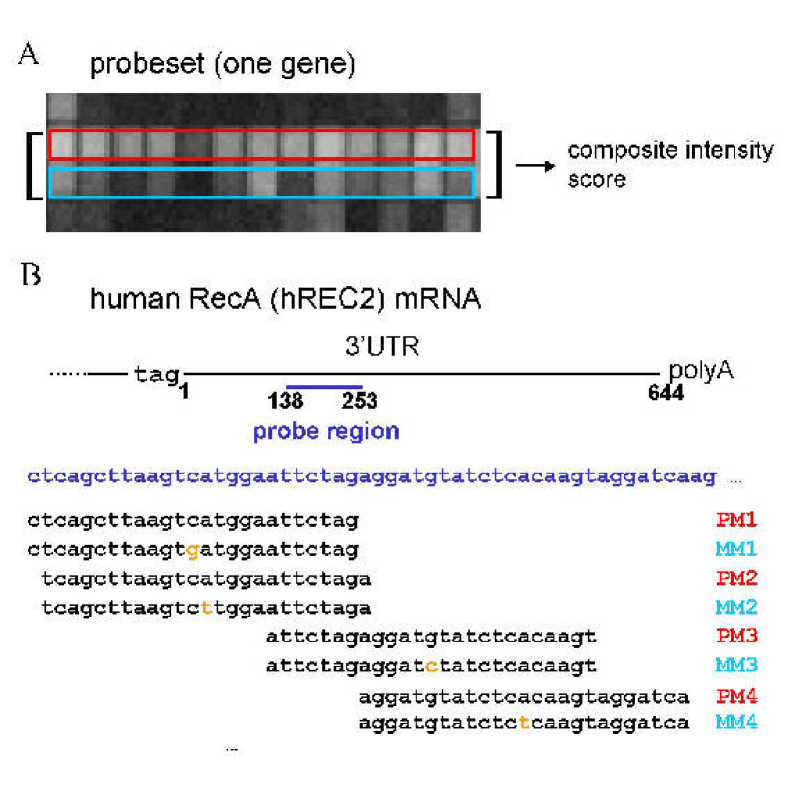
87.15.2v, 82.39.PjThere are two widespread technologies in use today for performing large-scale mRNA hybridization experiments: spotted arrays and high-density oligonucleotide arrays (HDONAs, a.k.a. GeneChip®) r1 . Such experiments have become popular for assessing global changes in gene expression patterns; they may be used, in a first instance, as screens to identify genes with interesting behaviour on an individual basis; but they also hold the promise to unravel some aspects of the tangled web of transcriptional controls r7 ; r8 . Hybridization array signal is intrinsically "dirty", resulting from compromise to trade quality for quantity, and analysis algorithms therefore need to achieve high levels of noise rejection against the real-world noise observed in the experiments. There is thus a clear need for the early stage algorithms that translate the patterns of light and dark recorded by a laser beam into numbers estimating mRNA concentrations to perform optimally. Any inaccuracies introduced at that level, i.e. loss of signal or false positive assignments cannot be recovered thereafter. In the case of spotted arrays, it seems there is little to do beyond better image analysis; HDONAs however have typically between 20 and 40 probes per transcript, and a function converting those 20-40 numbers into one number has to be supplied r4 ; r9 . As we show below, this task is not trivial, owing to the complex nature of mRNA hybridization and fluorescence detection in this system. HDONA probes are 25-base oligonucleotides grown photolithographically onto a glass surface; about a million different such probes can be synthesized on one chip at current densities. Because 25- mers can exhibit considerable cross-hybridization to a complex background, the system was built on two layers. A "differential signal" approach performs a first level of rejection of spurious signal, by computing the difference between the brightness of a PM probe complimentary to a 25-mer in the target RNA, and a MM probe in which the middle nucleotide has been changed to its complement. From the thermodynamics of DNA-RNA hybrids in solution r10 it was expected that the PM probe should have a higher affinity for the specific target than the MM probe, while cross-hybridization should be roughly equal for both. Second, redundancy was introduced by using several probe pairs corresponding to distinct 25-mers along the length of the transcript (see Figure 1).
But these ideas do not translate that easily from hybridization in solution to HDONAs. An issue long noticed was the large number of probe pairs for which the single mismatch brightness was higher than the perfect match up to a third of all probe pairs in some chip models 6. This was easy to notice since early versions of the default analysis software would not take this matter into account, and therefore some gene concentrations were reported as negative. Why this would happen has been the cause of much speculation. A two-dimensional plot of PMs vs. their MMs shows that their joint probability distribution appears to have two branches, and it was suggested that sequence specific effects are playing a crucial role 6. But in the absence of sequence information for the probe pairs, this couldn’t be verified. However, Affymetrix has recently released the necessary data for addressing the problem explicitly.
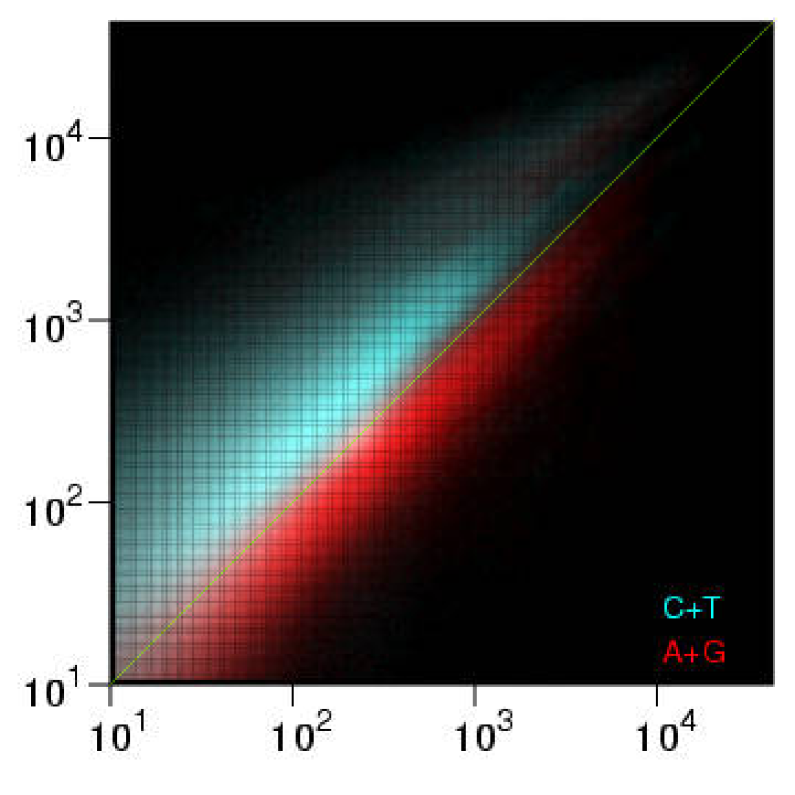
We show in Figure 2 joint probability distributions of PMs and MMs, obtained by taking every probe pair in a large set of experiments, and binning them to obtain two- dimensional histograms. We did this twice, computing two separate probability distributions which we then superimposed: in red, the distribution for all probe pairs whose 13th letter is a purine, and in cyan those whose 13th letter is a pyrimidine. The plot clearly shows two very distinct branches in two colors, which correspond to the basic physical distinction between the shapes of the bases: purines are large, double ringed nucleotides while pyrimidines are smaller single ringed ones. This underscores that by replacing the middle letter of the PM to its complementary base, the situation on the MM probe is that the middle letter always faces itself, leading to two quite distinct outcomes according to the size of the nucleotide. If the letter is a purine, there is no room within an undistorted backbone for two large bases, so this mismatch distorts the geometry of the double helix, incurring a large steric and stacking cost. But if the letter is a pyrimidine, there is room to spare, and the bases just dangle. The only energy lost is that of the hydrogen bonds.
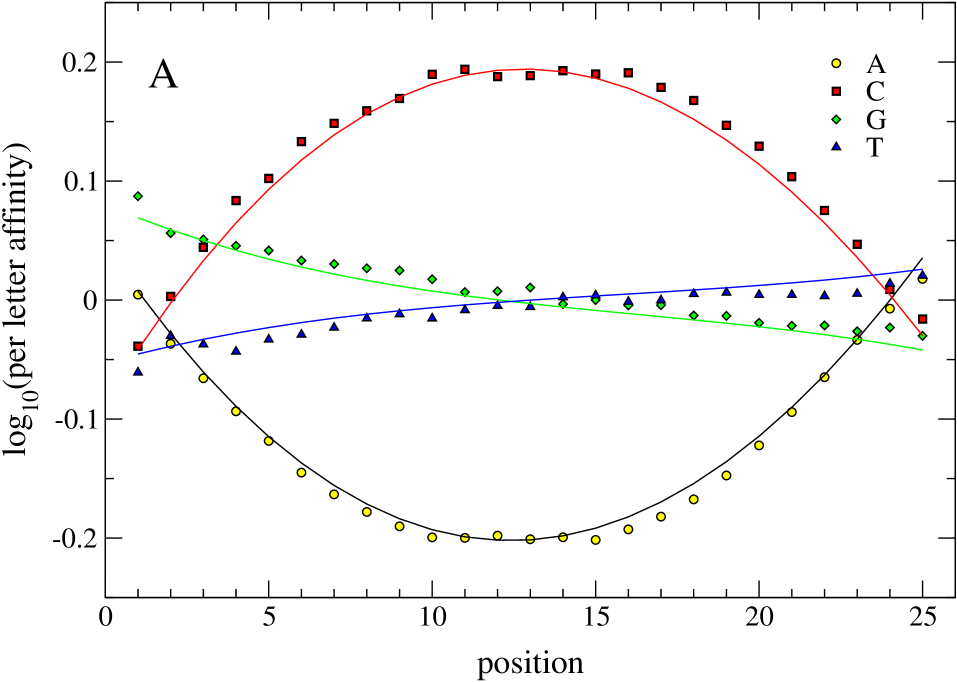
So the existence of two branches agrees with basic hybridization physics, but it still does not explain why the MMs are actually brighter than the PMs in many sequences with a purine middle letter. To understand this we will perform a finer level of analysis, concentrating momentarily only on the PM sequences. It has been pointed out that the PMs within a probeset are very broadly distributed, typically spanning two decades or more. We can try to observe whether this breadth is similarly sequence- dependent, by fitting the brightness B of PM probes (divided by the estimated RNA concentration [RNA]) against their own sequence composition:
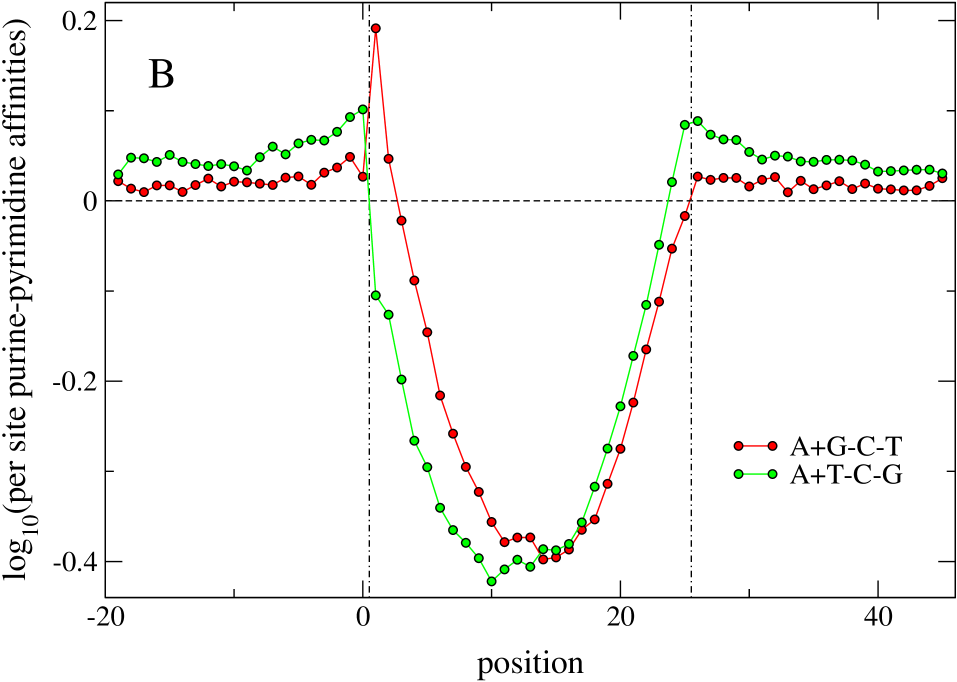
where is the letter index (ACGT) and the position (1-25) on the 25-mer; is a Boolean variable equal to 1 if the symbol equals , and thus is a per-site affinity. More accurate models would include stacking energies by looking at consecutive letters (bonds); while this contribution is important for hybridization experiments in solution r11 ; r12 , we found that it does not improve the fit substantially. On the other hand, we were surprised to discover that the key improvement comes from introducing position dependent affinities, as opposed to affinities that would depend only on the total number of occurrences of each letter. The fitted per-site affinities are shown in Figure 3, note the strength of letter specific contributions: changing an A to a C in the middle of the sequence would change the brightness of the probe by 250on mouse, drosophila, and yeast arrays lead to virtually identical affinity curves as those shown in Figure 3. Besides providing insight into physical aspects of hybridization, the fitted affinities bear an important practical value as they permit to effectively reduce the breadth of the probeset brightnesses, therefore improving the signal-to-noise ratio of probeset averages (used for instance in absolute concentration estimates). In numbers, the variance in 96by the fit is subtracted, and the reduction is larger than a factor of 2 for 65probesets. An interesting aspect of the above fits is the asymmetry of A vs. T (and G vs. C) affinities, which is shown more clearly in Figure 4.
The obvious culprits for this effect are the labels, namely, the standard protocol recommended by Affymetrix entails labeling the cRNA with biotinilated nucleotides more specifically, U and C, the pyrimidines. This suggests a rather simple explanation, namely, that the biotinilated bases somehow impede the binding; the effect diminishing to zero toward the probe edges, where the double strand breathes enough to be able to accommodate the linkers, and being maximal near the center, where the largest disruption would be effected. This would cause a catch-22 in terms of obtaining the maximal fluorescence: if a sequence has too few bases that can be labeled, it will not shine, even if it binds strongly, while if it has too many labels it will not shine because it does not bind. But this catch-22 has a curious loophole: the optimal region to have the fluorophores should then be outside the 25-mer: since the cRNA being hybridized is usually longer. Figure 4 confirms this: when including the contribution to brightness from sequence composition outside the 25-mer we find the pyrimidine contribution to be strictly positive.
Interference with binding by the biotinilated bases also solves the MM>PM riddle. As we saw before, a purine in the middle of the PM implies a gap between the two nucleotides on the MM probe; thus one could conjecture that this gap permits the linker between nucleotide and biotin not to interfere with the binding. This conjecture is quantitatively compatible with the data: according to Figure 4, the energetic penalty for a pyrimidine in the middle of the sequence is 0.2 in log10 units (about 0.5 kBT), which is comparable to (and bigger than) the excess brightness of the MMs in the purine (red) lobe of Figure 2. Indeed, the median excess brightness of the MM for the red probes is 0.1 in log10 units. In other words, when considering the effective contribution of a middle bond to brightness, a G-C* bond on the PM probe is dimmer than a C-C* bond on the MM, which in turn is dimmer than a C-G bond on the PM. Here * denotes a labeled nucleotide on the mRNA strand.
A microarray experiment carried out for a biological study provides nonetheless a quarter of a million measurements in hybridization physics. This information may be used to probe and understand the physics of the device, and indeed if an accurate enough picture emerges, it shall lead to substantial improvements in data quality. We have shown how the basic physics of the detection process in HDONAs percolates into the statistics, resulting in statistical anomalies affecting the data thereafter, and which need to be taken into account in order to optimize the experiments. Microarrays are one out of many high-throughput techniques being developed and brought to bear in important problems in Biology today. While it is usually emphasized that they pose similar analytical challenges in terms of pattern discovery, mining and visualization, our work exemplifies that in order to reach a level where analysis can be abstracted to such heights, one should be positive to understand in some detail the physics of the instrument and how it affects the data. We thank Herman Wijnen, Edward Yang, Nila Patil, Coleen Hacker and Adam Claridge-Chang for helpful discussions. Current address (MM): The Abdus Salam International Centre for Theoretical Physics, Strada Costiera 11, Trieste I-34100.
References
- (1) D. J. Lockhart and E. A. Winzeler, Nature 405, 827 (2000).
- (2) M. Chee, R. Yang, E. Hubbell, et al., Science 274, 610 (1996).
- (3) R. J. Lipshutz, S. P. Fodor, T. R. Gingeras, et al., Nat Genet 21, 20 (1999).
- (4) C. Li and W. H. Wong, Proc Natl Acad Sci U S A 98, 31 (2001).
- (5) E. Chudin, R. Walker, A. Kosaka, et al., Genome Biol 3, RESEARCH0005. (2002).
- (6) F. Naef, D. A. Lim, N. Patil, et al., Phys Rev E 040902 (2002).
- (7) D. K. Gifford, Science 293, 2049 (2001).
- (8) N. Banerjee and M. Q. Zhang, Curr Opin Microbiol 5, 313 (2002).
- (9) F. Naef, C. R. Hacker, N. Patil, et al., Genome Biol 3, RESEARCH0018. (2002).
- (10) N. Sugimoto, S. Nakano, M. Katoh, et al., Biochemistry 34, 11211 (1995).
- (11) G. Vesnaver and K. J. Breslauer, Proc Natl Acad Sci U S A 88, 3569 (1991).
- (12) N. L. Goddard, G. Bonnet, O. Krichevsky, et al., Phys Rev Lett 85, 2400 (2000).