[
Minimal model for genome evolution and growth
Abstract
Textual analysis of typical microbial genomes reveals that they have the statistical characteristics of a DNA sequence of a much shorter length. This peculiar property supports an evolutionary model in which a genome evolves by random mutation but primarily grows by random segmental self-copying. That genomes grew mostly by self-copying is consistent with the observation that repeat sequences in all genomes are widespread and intragenomic and intergenomic homologous genes are preponderance across all life forms. The model predicates the coexistence of the two competing modes of evolution: the gradual changes of classical Darwinism and the stochastic spurts envisioned in “punctuated equilibrium”.
pacs:
PACS number: 87.10.+e, 87.14.Gg, 87.23.Kg, 02.50.-r]
The genome of any organism extant is the culmination of a long history of growth and evolution that extends back to the origin of life. How much about this history can we learn from the present state of that genome? When a genome is viewed as a text composed of the four “letters” A (adenine), C (cytosine), G (guanine) and T (thymine), it is essentially a random text. This is so because, as far as we know, genomes are made by a “blind watchmaker” [1]. Whatever is not random about a genome is caused by the forces of selection that indirectly, subtly and slightly favor some random patterns over others. This is why it is such a challenge to delineate coding parts of a genome including genes and regulatory sequences from noncoding parts, and especially so when the effort cannot benefit from sequence similarity to other known coding sequences [2].
Yet the randomness of genome is not of the trivial kind. An example that hints at the potential complexity of the genome-as-text is the distribution of the frequency of occurrence of oligonucleotides. (In what follows, frequency will always mean frequency of occurrence, a -mer is an oligonucleotide of length and a distribution of frequency of -mers will be called a -mer distribution.) Frequency of short -mers has been used in studies of molecular evolution [3, 4, 5]. The frequency of a -mer is the number of times it is seen through a sliding window of width when it traverses once across the genome. If the length of the genome is , the act just described is similar to distributing objetcs (we think of the genome as being circular) into boxes, the total number of different -mers. Hence when is much greater than , the -mer distribution for a simple random genome sequence is expected to be a Poisson distribution with the mean and deviation both being . By a simple random genome sequence of a given base composition we mean the sequence that would obtain when any sequence of that base composition is thoroughly scramble.
Figure 1(a) shows the 6-mer distribution in a simple random sequence of length one million bases (1 Mb) with unbiased base composition. The mean of 244 and root-mean-deviation of 15.5 characterize the distribution as being Poisson. Figure 1(b) is the distribution obtained from the complete genome of Escherichia coli [6] whose base composition is essentially unbiased. (Microbial complete genome sequences are taken from the GenBank [7]. In this work, the frequencies of -mers in microbial complete genomes are normalized to correspond to those of a 1 Mb long sequence by multiplying each frequency by a factor equal to 106 divided by the length of the genome.) While strikingly different from Fig. 1(a), Figure 1(b) is representative of microbial complete genomes with an unbiased base composition. It has a root-mean-deviation (140) that is nine times that of the simple random sequence. Whereas simple random sequence contains no 6-mers whose frequency is greater than 400 or less than 100, the corresponding numbers of 6-mers in the genome of E. coli are about 500 and 510, respectively.
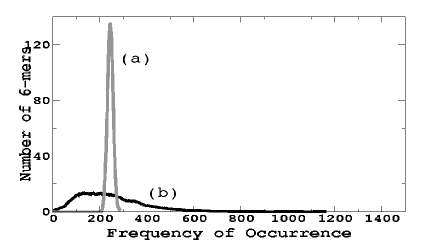
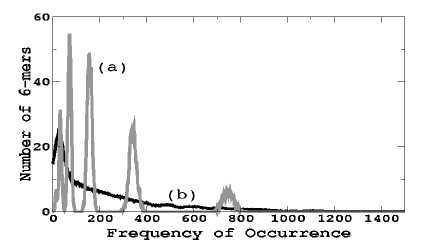
Figure 2(a) shows the distribution of a simple random sequence whose A+T content is 70% (it is a general fact of genomes that the number of A and T bases are almost the same, similarly for C and G contents). The single narrow peak seen in Figure 1(a) is now broken into seven smaller peaks whose appearance is caused by the bias in the base composition; the mean frequency of 6-mers with A or T’s is 244, giving the positions of the seven peaks to be 11.4, 26.6, 62.0, 144, 337, 787, 1837, for 0 to 6, respectively (the last peak is off scale in Figure 2). Figure 2(b) is the distribution obtained from the complete genome of Methanococcus janaschii whose A+T content is approximately 70% [8]. Although both distributions are very broad and have large values for their root-mean-deviations - 264 for (a) and 320 for (b) - that reflect an underlying highly biased base composition, that for the genome of M. janaschii is significantly greater and the two distributions are in any case again clearly dissimilar in detail.
When the 7-, 8- and 9-mer distributions are examined, the discrepancy between a random sequence and complete microbial genomes persists. We know of no previous explanation of this discrepancy. Even as one would be tempted to attribute the cause of the discrepancy to biological effects, we shall show that that would likely be a wrong conclusion and that more likely the observed distributions have an interesting stochastic origin. (When the number of -mers becomes too large for the Poisson distribution to be a reliable yardstick for judging whether a genome is simply random or not.)
Although genomes are of the order of 1 Mb long, the ratio of the mean of the 6-mer distribution to its root-mean-deviation suggests the statistical property of a much shorter sequence, perhaps as short as 10 kb. In E. coli, that ratio is 1.74 (as opposed to a ratio of =15.6 for a simple random sequence 1 Mb long). Over all the complete microbial genomes, the root-mean-deviation after bias in base composition is corrected for ranges from 96 to 218 and has an average of 154. This gives an average ratio of mean to root-mean-deviation of 1.58. In terms of a Poisson distribution such a ratio corresponds to a mean of 2.5 and a simple random sequence about 10 kb long, since there are 4096 6-mers. The 6-mer distribution of a 10 kb simple random sequence would have about 3310 of the 6-mers occur one to four times, 3 to 4 of the 6-mers occur nine times and about one 6-mer occur 10 times. It would also have 350 of the 6-mers not occurring altogether. Suppose we now duplicate this simple random sequence 100 times to produce a 1 Mb long sequence and let it undergo a number of single base mutations, then we may expect the long sequence to have a 6-mer distribution that begins to resemble Figure 2(b). That is, it should have many 6-mers occurring more than 400 many times, some occurring close to 1000 times, and many occurring fewer than 100 times.
It may not be very realistic to suggest that real genomes are approximately high multiples of a much shorter sequence, plus mutation. Sometime ago Ohno conjectured that great leaps in evolution had been the result of whole genome duplications [9]. The idea has remained controversial; the present state of gene sequence information from vertebrates makes it difficult to either prove or disprove this hypothesis [10], and phylogenetic studies of families of mammalian genes indicate that if ancient events of genome duplication did occur, they did not play an important role in structuring the mammalian chromosomes bearing such genes [11]. In any case, even if events of whole genome duplication had occurred, it probably did not occur a very large number of times. On the other hand, there certainly have been a very large number of events of duplications of shorter sequences.
Indeed most genomes have repetitive sequences (or repeat sequences) with lengths ranging from 1 base to many kbs whose numbers of copies far exceed those would be found in a simple random sequence. For example, in the human genome repeat sequences account for at least 50% and probably much more [12, 13], because most ancient repeats presumably have been rendered unrecognizable as such by degenerative mutation.
Here, we propose a minimal model for microbial genome growth that incorporates duplication of DNA of all lengths and that exhibits the observed -mer distributions of real genomes. The model employs the two types of events that drives genomic changes, mutation and DNA duplication. For simplicity mutation events are represented by single base replacement (SBR). DNA duplication events are represented by occasional random duplication (RD) of a stretch of oligonucleotide with a characteristic length of bases.
In the model genomes are single stranded and the initial state of a genome is a simple random sequence of legth with a given base composition. From the initial state the genome evolves and grows by (base composition preserving) SBR and RD events until its length just exceeds 1 Mb. In an RD event, the length of the copied sequence is first randomly chosen (see below), then a site at least sites from the end of the genome is randomly chosen and the sequence from to is copied and inserted into the genome behind a second randomly chosen site. The model has three parameters: the initial length , the ratio of the chances of having an SBR or an RD event and the length scale . For the work reported here was held fixed at 1000 and only the two parameters and were varied.
At each instance of an RD event, a length not greater than the current length of the (artificial) genome for the duplicated segment is chosen as follows. We construct a function such that, given a random number between zero and one, the duplicated segment length is . Let , the probability per unit length of selecting a segment of length , be proportional to . Then from one has . The recognition that inverse of is given by yields
| (1) |
Note that when the simplification obtains. When , when is close to zero, otherwise as long as is much greater than away from 1. In all cases . For fixed the average length of copied segments is , which approaches when becomes much greater then .
Suppose the final genome length is much greater than and (this will be the case here), then the total number of RD events will be somewhat greater than and the total number of SDR events will be somewhat greater than .
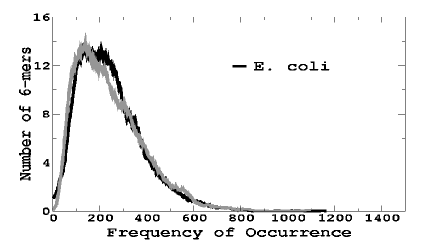
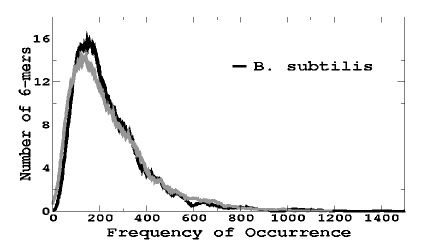
It turns out that if the model sequence is to have a 6-mer distribution similar to those of the representative real microbial genomes, the total number of mutations (for a sequence of canonical length 1 Mb) acting on the model sequence needs to be around 40,000. From the discussion in the previous section, this implies the relation should hold. The best results are obtained when . In Figure 3 the model genome with an unbiased base composition generated with the parameters and is seen to have a 6-mer distribution (gray) surprisingly similar to that of E. coli (black). No attempts were made to fine-tune the two parameters to get a “perfect” fit. In Figure 4 (5, respectively) the distributions for the model genome (gray) generated with and and for the genome (black) of Bacillus subtilis [14] (M. janaschii) are compared; both have approximately 60% (70%) A+T content. The peaks caused by biased base composition that one expects to see in a Poisson distribution (and seen in Figure 2(a)) are no longer evident in the distributions from the model genomes in Figures 4 and 5, just as they do not show in the distributions from real genomes. In particular, the model seems to succeed with ease in accounting for the very large number of 6-mers that occur with exceptionally high and with exceptionally low frequencies seen in most microbial genomes.

It is emphasized that the high degree of likeness between the distributions of the simulated and real genomes notwithstanding, no claim is made of the general similarity of the contents of the two genomes. If an alignment were to be made between, say, an 1 kb segment from the simulated genome and any segment of like length from the real genome, then the degree of similarity between them would be characteristic of that between two unrelated simple random sequences.
The 6-mer distributions of microbial genomes are well represented by the two-parameter gamma distribution:
| (2) |
The distribution has mean and mean-square deviation . In Table I the order deviations, defined as , from 2 to 5, of 6-mer distributions of real genomes are compared with those of: (a) the gamma distribution with the parameters and (in brackets) obtained from the real genome distribution; (b) the 6-mer distribution of a simple random sequence without duplication; (c) the 6-mer distribution of the corresponding sequence given by the minimal model shown in Figures 3-5. The values of in rows (a) show that the 6-mer distributions of the real genomes are well represented by gamma distributions. The values of in rows (c) show that the 6-mer distributions from the real and model genomes agree to a very high degree.
| Sequence | ||||
| E. coli (50% A+T content) | 140 | 147 | 213 | 252 |
| (a) ( = 3.05, = 80.0) | 140 | 146 | 208 | 243 |
| (b) | 15.6 | 3.6 | 20.7 | 10 |
| (c) ( = 500, = 15K) | 144 | 148 | 212 | 247 |
| B. subtilis (60% A+T) | 168 | 223 | 316 | 400 |
| (a) ( = 2.12, = 115) | 168 | 186 | 261 | 310 |
| (b) | 79 | 68 | 109 | 117 |
| (c) ( = 600, = 15K) | 169 | 194 | 266 | 311 |
| M. janaschii (70% A+T) | 320 | 465 | 650 | 810 |
| (a) ( = 0.58, = 418) | 320 | 439 | 609 | 767 |
| (b) | 264 | 369 | 500 | 603 |
| (c) ( = 600, = 15K) | 321 | 462 | 635 | 783 |
A conspicuous deviation of the -mer distribution of a real microbial genome from that of a simple random sequence is the very large numbers of extremely frequent and extremely rare 6-mers (or 7- and 8-mers) in the former. The 6-mer distribution of the real genomes looks more like the distribution of a genome that grew randomly one base at a time only to 10 kb long, but not to one (or several) Mb long. We have shown that the full-length microbial genome could have grown randomly and have such an unexpected -mer distribution provided that it grew mostly by random self-copying. And we propose that it is this stochastic process, instead of some unknown biological process, that has caused the long genome to retain the statistical characteristics of its much shorter ancient self.
Because the probability that a random stretch of DNA would be a gene (that codes an RNA or a protein that would fold and function) is so minuscule, a population of genomes that stumbled upon a self-copying mechanism would have had an enormous evolutionary advantage over another unfortunate population that did not. The preponderance of intragenomic and intergenomic homologous genes [15] across all life forms is testament to the importance of this mechanism [6, 8, 12, 13, 14].
Self-copying growth may not be the only mechanism through which microbial genomes acquire the statistical characteristics of a much shorter sequence. Such characteristics may well have an as yet unknown biological rather than stochastic origin. Our model has the virtue of simplicity. It also has several interesting implications of which two are mentioned here. The model predicates the coexistence of the two competing modes of evolution: the gradual changes of classical Darwinism and the stochastic spurts as envisioned in “punctuated equilibrium” [16, 17]. The fact that a present-day long genome shares vital characteristics of its theoretical shorter earlier self implies one knows something about its ancestor, or the common ancestor of its relatives. Perhaps, by pushing this notion harder and examining the genomes closer, one may gain a deeper understanding of our universal ancestor [18].
This work is partially supported by a National Science Council grant NSC 90-2119-M-008-019.
REFERENCES
- [1] R. Dawkins, The Blind Watchmaker, (Penguin, 1988).
- [2] J. B. Hogenesch, et al., Cell, 106, (2001) 413.
- [3] C. Burge, A. M. Campbell and S. Karlin, Proc. Natl. Acad. Sci. (USA) 89 (1992) 1358.
- [4] L. F. Luo, F. M. Ji and H. Li, Bull. Math. Biol., 57 (1995) 527.
- [5] S. Karlin, J. Mrazek and A. M. Campbell, J. Bacteriology, 179 (1997) 3899.
- [6] F. R. Blattner, et al., Science 277 (1997) 1453.
- [7] URL of GenBank is: www.ncbi.nlm.nih.gov/PMGifs/ Genomes/micr.html.
- [8] C. J. Bult, et al., Science 273 (1996) 1058.
- [9] S. Ohno, Evolution by gene duplication, (Springer Verlag, New York, 1970).
- [10] L. Skrabanek and K. H. Wolfe, Cur. Op. Gen. and Dev. 8 (1998) 694.
- [11] A. L. Hughes, J. da Silva, and R. Friedman. Genome Res., 11 (2001) 771.
- [12] International Human Genome Sequencing Consortium, Nature 409 (2001) 860.
- [13] J. C. Venter, et al.,, Science, 291 (2001) 1304.
- [14] F. Kunst, et al., Nature, 390 (1997) 249.
- [15] W. H. Li, Molecular Evolution. (Sinauer Associates, 1997).
- [16] S. J. Gould, A Wonderful Life, (Penguin, 1989), 81n.
- [17] P. Bak, C. Tang and K. Wiesenfeld, Phys. Rev. Letts. 59 (1987) 381.
- [18] C. R. Woese, Proc. Natl. Acad. Sci. (USA) 95 (1997) 6854.