Formation of an Icosahedral Structure during the Freezing of Gold Nanoclusters: Surface-Induced Mechanism
Abstract
The freezing behavior of gold nanoclusters was studied by employing molecular dynamics simulations based on the semi-empirical embedded-atom method. Investigations of the gold nanoclusters revealed that, just after freezing, ordered nano-surfaces with a fivefold symmetry were formed with interior atoms remaining in the disordered state. Further lowering of temperatures induced nano-crystallization of the interior atoms that proceeded from the surface towards the core region, finally leading to an icosahedral structure. These dynamic processes explain why the icosahedral cluster structure is dominantly formed in spite of its energetic metastability.
pacs:
61.46.+w, 64.70.Nd, 36.40.EiNano sized metal clusters containing tens to thousands of atoms have attracted great attention due to their possible applications as catalysts and surface nanostructures cluster ; HeerJensen ; MoriartyBinns . In particular, understanding and predicting the structural properties and formation of clusters produced from the liquid state or gas phase are major concerns in investigations of the controlled growth of low dimensional structures. Unlike bulk materials, small metal clusters exhibit various structural modifications, for example, for fcc metals, cuboctahedra (CO) with a face-centered-cubic (fcc) structure, twinned fcc (containing one or several parallel twin planes) Pinto ; Buffat , twinned hexagonal close packed (hcp) Yacaman , icosahedral and truncated icosahedral (Ih) Buffat ; MarksMartin ; Ino ; Komoda ; Ascencio , truncated decahedral (Dh) MarksMartin ; Ino ; Komoda , and amorphous Garzon . Notably, high-resolution electron microscopy (HREM), under typical cluster-growth conditions, routinely detected metal clusters of Ih or Dh morphology with a fivefold symmetry of noncrystallographic atomic arrangements MarksMartin .
The thermodynamical-equilibrium forms and structures of metal clusters have been exhaustively searched and discussed on the basis of theoretical calculations. In contrast to experimental observations, theoretical calculations suggest that for Au, the Ih structure is energetically metastable even for small clusters (less than atoms) with a large surface-to-volume ratio Cleveland ; BalettoJCP . With increasing cluster size, the stability of the Ih structure should decrease markedly due to accumulated strain energy Cleveland . HREM studies Buffat ; MarksMartin ; Ino ; Komoda ; Ascencio , however, have revealed that even larger clusters (up to a few thousand atoms) still have Ih or Dh morphology. Real-time microscopic studies by Iijima and Ichihashi Iijima demonstrated structural changes in gold clusters from a single crystalline form to a twinned crystalline form of the Ih or Dh structures, and vice versa, originating from electron beam irradiation (charging effect). Such experimental observations emphasize that the formation of Ih clusters is governed by kinetic rather than thermodynamic factors.
In order to understand the kinetics, we investigated the structural changes of gold nanoclusters during cooling from a molten state by employing molecular dynamics (MD) simulations. Interestingly, we found that the Ih structure originates from surface ordering not from conventional core nucleation. At the initial stage of the freezing, close-packed (111)-type planes with a fivefold Ih symmetry were formed at surfaces before the interior of the cluster crystallized. Subsequently, nano-crystallization at lower temperatures propagated inward from these (111)-type surface segments, leading to the Ih cluster.
All MD simulations of gold nanoclusters were performed using the semi-empirical embedded-atom method EAM . We used the XMD code described in Ref. XMD, . In the simulations we used an Ih cluster of 561 atoms as an initial structure. The cluster was then heated to 1500 K, well above its melting temperature to ensure complete melting, and equilibrated for a long period of more than 250 ps (, where 2.0 fs represents the time step for the integration of the equation of motion). The cluster was cooled to 300 K at K/s ( K/); the temperature was set through the mean kinetic energy of the atoms.
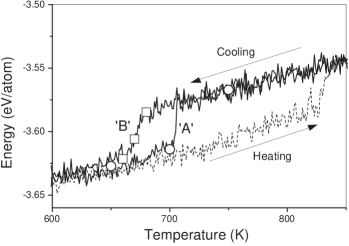
Our simulations at different initial configurations showed that most of the atom clusters were frozen to an Ih structure at a cooling rate of K/s. Typical melting and freezing behavior of the clusters is displayed by the potential energy vs. temperature curve in Fig. 1. The melting and freezing phase transition can be identified by an abrupt change in potential energy. Interestingly, we here see two different types of freezing behavior under identical cooling condition. In the first case shown by the freezing curve ‘A’ in Fig. 1, the cluster underwent a sharp liquid-solid transition and the freezing point was estimated as K. In the second case shown by the freezing curve ‘B’ in Fig. 1, the liquid-solid transition took place over tens of degrees of temperature.
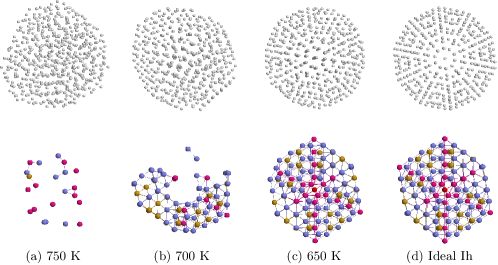
Similar MD simulation works of the melting and freezing were reported by Chushak et al. Chushak and they also found the preferential formation of an Ih structure for various cluster sizes. In spite of the MD simulations, an understanding as to why the formation of an Ih structure occurs so frequently is still lacking. For detailed analysis of the freezing behavior we looked at cluster configurations corresponding to the three open circles (at , , and K, respectively) in freezing curve ‘A’ of Fig. 1 [see Figs. 2(a), 2(b) and 2(c)]. Only for the purpose of avoiding vibrational noise effect in the analysis of the cluster structure, we relaxed the cluster-atomic configurations to the local energy-minimum structures by using the conjugate gradient minimization technique. We also showed an ideal Ih structure of a -atom cluster for comparison [see Fig. 2(d)]. At K, which is well above the freezing temperature, the cluster was in a liquid state. Forming and dissolving of very small embryos occurred within the disordered state and the cluster shape was highly fluctuating and approximately spherical. Notably, as the freezing temperature was approached, flat surface segments like solid facets started to appear temporarily. The abrupt decrease of potential energy shown in Fig. 1 indicates that the cluster at K had just frozen. At 700 K, the cluster showed ordered facets with a fivefold symmetry, apparently with an Ih shape [see Fig. 2(b)]. As the cluster was cooled further to K, the interior atoms rearranged from these surface facets to form an Ih crystalline structure [see Fig. 2(c)], which was comparable to an ideal icosahedron [see Fig. 2(d)].
The cluster configurations have been also investigated by using the local bond order parameter characterizing the local atomic arrangement around atom Fuente . The method is essentially the same in formalism as that of Ref. Chushak, , but local structure criteria are different. Thereby, we are successfully able to discriminate atoms with an hcp local symmetry for an Ih structure. Solid-like atoms with a well-defined local symmetry are shown in two-cross-sectioned views in the bottom row of Fig. 2. At high temperatures we observed typical forming and dissolving of very small embryos as expected [see Fig. 2(a)]. At 700 K, just after freezing, we clearly observed a surface-crystallized structure, representing that the nanocrystallization for an Ih structure proceeds from surfaces segments towards core regions.
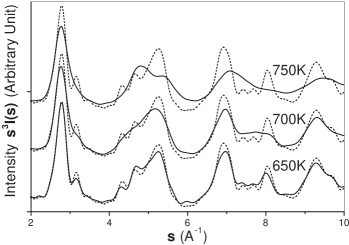
Structure evolution can also be investigated using diffraction patterns. Figure 3 shows the simulated diffraction intensity versus the diffraction parameter for the clusters at , , and K as compared to an ideal Ih cluster, denoted by a dashed line. Note that rather than was used for detailed comparisons with the ideal Ih structure Waal . At K, the diffraction pattern was somewhat broadened, due to the liquid state of the cluster [see Fig. 2(a)]. At K, some peaks started to appear, which represented a disordered structure with a short-range order [see Fig. 2(b)]. At K, fine structures of peaks were found and the overall pattern was similar to that of the ideal Ih structure.
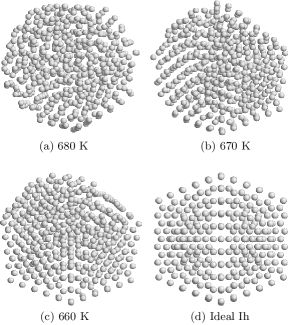
Next we consider the second case of freezing curve ‘B’ that appears to be different from freezing curve ‘A’ [see Fig. 1]. In this case, freezing took place by the advancement of the solid/liquid interface relatively gradually (over about 200 ps). This is in contrast to the freezing situation described by curve ‘A’ where freezing took place from a liquid state to a surface-ordered structure abruptly (over about ps). Figures 4(a), 4(b), and 4(c) show cluster configurations corresponding to the three open square symbols (at 680, 670, and 660 K, respectively) in freezing curve ‘B’ of Fig. 1. During the initial stage of freezing [see Fig. 4(a)], facets started to form on the local surface. In the middle stage [see Fig. 4(b)], more surface facets were formed giving the surface a fivefold symmetry, and crystallization proceeded from one part of surface to the others. In the final stage [see Fig. 4(c)], the entire cluster was crystallized, although the final cluster was not a single crystal but a multiply twined crystal.
According to classical nucleation theory based on the macroscopic concept of the interface Handbook ; RMW , nucleation should take place in the interior of the liquid cluster Bartell . In this case, the stable fcc phase is expected to be formed locally inside the cluster and to finally grow into a single fcc crystalline phase. Then, the final fcc structure would be energetically more stable than the Ih structure. However, our MD simulations revealed that the Ih structure is a prevailing cluster structure, which is in agreement with experimental observations. Inspections of the freezing cluster configurations showed that Ih cluster formation is initiated from surface ordering not from conventional core nucleation. In the freezing processes of the melted cluster shown in curve ‘A’ of Fig. 1, surface ordering took place over the entire surface. Surface ordering induces an abrupt transition from the liquid to an amorphous state. Actually, the potential energy of an amorphous cluster with an ordered surface is only slightly higher than that of the Ih cluster. In the case of curve ’B’ in Fig. 1, surface ordering took place only on parts of the local surface and propagated. Our results suggest that low kinetic barriers at surfaces make cluster formation of the meta-stable Ih skin structure kinetically favorable (although the energy barriers are not accessible under the present MD simulations). Once the ordered surface facets were formed, they would work as a crystallization seed, and thereby nano-crystallization would proceed inward, finally forming the Ih structure.
In our further simulations of different cooling conditions and cluster sizes up to atoms, including cluster sizes of 581 atoms and of 545 atoms corresponding to the magic number sizes of the fcc octahedron and of the truncated decahedron, respectively, other structures such as the truncated decahedral and fcc structures were also formed, but the Ih structure was always dominant. Kinetic competition between these structures seems to be correlated with the surface ordering of the cluster during freezing, which means that the reduction of surface energy more efficiently contributes to the determination of the cluster structure than the internal energy. In many simulation runs, we found that when surface ordering was dominant, the cluster became Ih. Otherwise, the cluster became t-Dh or fcc.
In our simulations, we investigated a structural change of clusters during cooling from the liquid state. Typically, clusters are generated from the gas phase through inert gas condensation using adiabatic expansion. Even in this case, if clusters grow as a liquid droplet and then solidify BalettoCPL , or if disordered or amorphous clusters are first formed and then these undergo solid-solid transition to nanocrystalline structures, surface ordering of the clusters might occur and have the same effect as freezing.
In summary, by performing MD simulations on gold clusters, we examined the formation mechanism of an Ih cluster experimentally observed. When -atom gold clusters were cooled from a liquid state, the Ih structure was obtained repeatedly by two different processes. In the first case, surface ordering with {}-type facets with a five-fold symmetry took place while interior atoms were frozen into a disordered structure abruptly, over about ps. The rearrangement of interior atoms then proceeded inward from the Ih-like surface, leading to an Ih cluster. In the second case, crystallization took place at a surface region and then propagated to the whole over about ps. In both cases, the formation of the Ih structure originated from ordered surface facets with a fivefold symmetry. This surface-induced mechanism explains why clusters tended to adopt an Ih structure, although it is not energetically the most stable phase.
Acknowledgements.
We gratefully acknowledge support from the Korea Ministry of Education through the Brain Korea Program (H.-S.N. and J.-K.Y.), the Korea Ministry of Science and Technology through the Creative Research Initiative Program (N.M.H.), and the Korea Science and Engineering Foundation through the ASSRC at Yonsei University (B.D.Y.). Fruitful discussions with S. C. Lee at Korea Institute of Science and Technology and P. R. Cha at Seoul National University are appreciated.References
- (1) Clusters of Atoms and Molecules, edited by H. Haberland, Springer Series in Chemical Physics Vols. 52 and 57 (Springer, Berlin, 1994).
- (2) W. de Heer, Rev. Mod. Phys. 65, 611 (1993); P. Jensen, ibid. 71, 1695 (1999).
- (3) P. Moriarty, Rep. Prog. Phys. 64, 297 (2001); C. Binns, Surf. Sci. Rep. 44, 1 (2001).
- (4) A. Pinto, A. R. Pennisi, G. Faraci, G. D’Agostino, S. Mobilio, and F. Boscherini, Phys. Rev. B 51, 5315 (1995);
- (5) P.-A. Buffat, M. Fiueli, R. Spycher, P. Stadelmann, and J. P. Borel, Faraday Discuss. 92, 173 (1991).
- (6) M. Jose-Yacaman, R. Herrera, A. G. Gomez, S. Tehuacanero, P. and Schabes-Retchkiman, Surf. Sci. 237, 248 (1990).
- (7) L. D. Marks, Rep. Prog. Phys. 57, 603 (1994); T. P. Martin, Phys. Rep. 273, 199 (1996).
- (8) S. Ino, J. Phys. Soc. Jpn. 21, 346 (1966); 26, 1559 (1969); 27, 941 (1969).
- (9) T. Komoda, Jpn. J. Appl. Phys. 7, 27 (1968).
- (10) J. A. Ascencio et al., Surf. Sci. 396, 349 (1998). J. A. Ascencio, M. Perez, and M. Jose-Yacaman, ibid. 447, 73 (2000).
- (11) I. L. Garzon et al., Phys. Rev. Lett. 81, 1600 (1998). J. M. Soler et al., Phys. Rev. B 61, 5771 (2000);
- (12) C. L. Cleveland, U. Landman, T. G. Schaaff, M. N. Shafigullin, P. W. Stephens, and R. L. Whetten, Phys. Rev. Lett. 79, 1873 (1997).
- (13) F. Balletto, R. Ferrando, A. Fortunelli, F. Montalenti, and C. Mottet, J. Chem. Phys. 116, 3856 (2002);
- (14) S. Iijima, and T. Ichihashi, Phys. Rev. Lett. 56, 616 (1986);
- (15) M. S. Daw and M. I. Baskes, Phys. Rev. Lett. 50, 1285 (1983); Phys. Rev. B 29, 6443 (1984); R. A. Johnson, Phys. Rev. B 37, 3924 (1988); J. Mater. Res. 3, 471 (1988).
- (16) The MD calculations were performed using the XMD program developed by the group of Rifkin, at the Center for Simulation, University of Connecticut, http://www.ims.uconn.edu/centers/simul.
- (17) Y. Chushak and L. S. Bartell, J. Phys. Chem. B 105, 11605 (2001).
- (18) P. J. Steinhardt, D. R. Nelson, and M. Ronchetti, Phys. Rev. B 28, 784 (1983); O. R. de la Fuente and J. M. Soler, Phys. Rev. Lett. 81, 3159 (1998).
- (19) B. W. van de Waal, J. Chem. Phys. 98, 4909 (1993); Phys. Rev. Lett. 76, 1083 (1996).
- (20) B. Mutaftschiev, in Handbook of Crystal Growth, edited by D. T. J. Hurrle (Elsevier Science, Amsterdam, 1993), Vol. 1(a).
- (21) H. Reiss, P. Mirabel, and R. L. Whetten, J. Phys. Chem. 92, 7241 (1988).
- (22) L. S. Bartell, Annu. Rev. Phys. Chem. 49, 43 (1998).
- (23) F. Balletto, C. Mottet, and R. Ferrando, Chem. Phys. Lett. 354, 82 (2002);