Charge Dependence of Temperature-Driven Phase Transitions of Molecular Nanoclusters: Molecular Dynamics Simulation
Abstract
Phase transitions (liquid-solid, solid-solid) triggered by temperature changes are studied in free nanosized clusters of () with different negative charges assigned to the fluorine atoms. Molecular dynamics simulations at constant energy show that the charge increase from =0.1 to =0.25 shifts the melting temperature towards higher values and some of the metastable solid states disappear. The increased repulsive interaction maintains the order in molecular systems at higher temperatures.
keywords:
molecular dynamics , quenching , phase transitionPACS:
36.40Ei , 64.70Kb , 61.50-f1 Introduction
Small free clusters of atoms or molecules exhibit solid-like or liquid-like properties that differ from the properties of their bulk counterpart. It has been realized that the cluster structure (microcrystalline or amorphous) [1, 2] depends on the production method. Clusters made of molecules () have already been examined in some detail by several groups [2, 3, 4, 5, 6] to establish the existence of various structures and transformations between them. Some of the microcrystalline states coexist dynamically [5, 6] in a given temperature interval and those which are only locally stable phases disappear when the cluster size increases as was confirmed both experimentally [1] and theoretically [6]. Those states correspond to a partial order of the molecular axes of symmetry. The system becomes completely orientationally ordered at very low temperatures. The transition rate between the ordered and disordered states can be retrieved from the potential energy surface (PES) of the system, [7]. It has been shown in [6] that clusters of the same numbers of or molecules exhibit different dynamics despite the same symmetry of the molecules. The reason is that the topography of PES in the case of clusters is shallower than that of clusters.
In the present study we explore the changes of the cluster PES due to the changes of the charge distribution in a single molecule. Our hypothesis is that the molecular polarization is changed by using different production methods. In order to find out the influence of the charge changes on orientational order-disorder phase transitions we have simulated the temperature behavior of molecular clusters with the help of a constant energy molecular dynamics.
2 Interaction Potential and Computational Procedure
The main feature of the intermolecular interaction is the dependence on the mutual orientations of the molecules. There are experimental indications that molecules can be considered as rigid octahedra to a reasonable extent. A small negative charge should be assigned to the fluorine atoms to account for the chemical bond [3].
The intermolecular potential is presented as a sum of atom-atom interaction (fluorine-fluorine, tellurium-tellurium, fluorine-tellurium) to account for the orientational anisotropy:
| (1) |
where denote either a fluorine or a tellurium (sulfur) atom; is the distance between an -atom in the molecule and a -atom in the molecule; is the number of the molecules in the cluster. The parameters and have been fitted to the experimental diffraction results, [2].
The Coulomb term accounts for the small negative charge assigned to the fluorine atoms and the positive charge carried by the central tellurium atom, = 6 , which ensures a neutral molecule at distances much larger than the molecular size. Here we compare the temperature-driven transitions for the case of and , where e is the electron charge.
The charge has been computed using LCAO (linear combinations of atomic orbitals) with planar basic functions () and Gaussian basic functions ().
The potential, Eq.1, has been used to solve the classical equation of motion written in the Hamiltonian form with the help of a constant-energy MD method. The velocity-Verlet [8] algorithm with a time step of has been implemented. This is a step optimized in [6] to satisfy the requirements for long MD runs necessary to detect phase changes in a computer experiment. The heating (cooling) of the system is performed by velocity rescaling and consequent thermalization [3].
3 Results and Conclusions
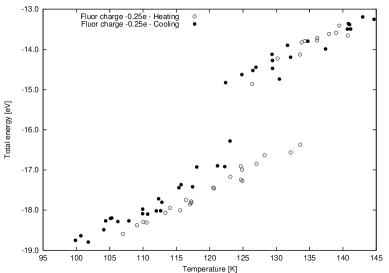
We have investigated the thermal behavior of clusters consisting of 89 () molecules in the temperature interval (50 140 K). The clusters of molecules melt above 125K () and 130K () as is seen from the caloric curves in Fig.1, Fig.2 and the Lindemann criterion, Fig.3. The Lindemann coefficient corresponds to a solid-like phase ( for bulk systems) [11]. Melting is a discontinuous transition even in the case of nanosized clusters. The heating and cooling of clusters (Fig.1) demonstrate a hysteresis, which signals a discontinuous transition. The charge increase shifts the melting point towards higher temperature: in comparison to a cluster with less charged atoms, Fig.2. [ the larger charge, the more robust is the cluster ].
The freezing point shifts towards lower temperatures.
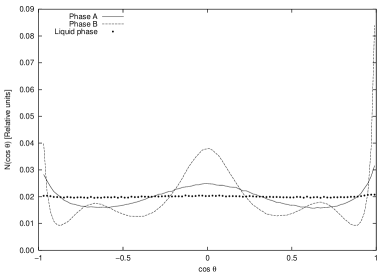
The hysteresis area is larger for the case of than for . One could speculate about a ”larger memory” in systems having a ”larger charge”. Another important distinction between less and more charged fluorine atoms is the structure adopted by the clusters below the freezing point. The distributions of the mutual molecular orientations with , Fig.4, show that they transform step by step from liquid to a partially ordered solid (phase A) to an ordered solid (phase B). The clusters with , Fig.5, transform directly from liquid to an ordered state. The radial distribution g(r) [10], Fig.6, is a diagnostic of the lattice structure adopted by clusters. We compute g(r) for the molecular center of masses which is insensitive to the molecular orientations. Fig.6 was obtained as follows: starting from a low-temperature configuration obtained from simulations of a cluster with , we change to and heat the cluster until it melts. Then the cluster is cooled to a solid state. g(r) are plotted at the same on the cooling and heating branch. The structures are obviously different. Typical configurations obtained by quenching [9] of the MD trajectory are shown in Fig.7 [(a) - for ; (b) - for ]. In both cases we obtain two orientations populated by the molecules but the arrangements of ”layers” in the clusters are different.
We conclude that the charge change influences both the melting temperature and structural transformations. Meta-stable solid states with partial order disappear for the case of larger charge. The volume of the cluster decreases when the charge increases and the cluster is more robust on heating.
Our results show that the charge increase shifts the transitions temperature towards higher values and some of the metastable states disappear. This confirms our understanding that the repulsive interaction maintains the order in molecular systems.
Acknowledgments
NATO Grant (CLG SA(PST.CLG.976363)5437 is acknowledged. The work has been partially supported by the University of Sofia Scientific Fund (2001).
References
- [1] E. Lefterova, I. Dragieva, V. Tchanev, D. Mehandjiev, M. Mikhov, Journal of Magn. and Magn. Mat. 140-144 (1995) 457-458
- [2] L.S. Bartell and Shimin Xu, J. Phys. Chem. 95 (1991) 8939.
- [3] A. Proykova and R.S. Berry, Z. Phys. D 40 (1997) 215.
- [4] J.B. Maillet, A. Boutin, S. Buttefey, F. Calvo and A. H. Fuchs, J. Chem. Phys. 109 (1998) 329.
- [5] S. Pisov and A. Proykova, in Proc. of the Meeting of Young Researchers in Physics, Heron Press 2001; I. Daykov and A. Proykova, .
- [6] A. Proykova, S. Pisov and R. S. Berry, J. Chem. Phys. (accepted: AIPID 515140JCP)
- [7] K.D. Ball, R.S. Berry, R.E. Kunz, F.Y. Li, A. Proykova, D. Wales, Science Vol.271 877-1024 (1996) 963-965
- [8] L. Verlet, Phys. Rev. 159 (1967) 98.
- [9] F. H. Stillinger and T. A. Weber, Kinam 3 (1981) 159.
- [10] M. P. Allen and D. J. Tildesley, Computer Simulation of Liquids (Clarendon Press, Oxford, 1994) p.184
- [11] J. Jellinek, Metal-Ligand Interactions (Kluwer Academic Publishers, Printed in the Netherlands, 1996) p.325-360.


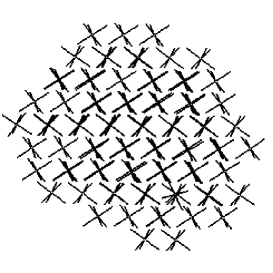 (a) (a) |
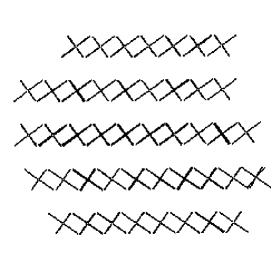 (b) (b) |