The relation of morphology and affinity maturation
in germinal centers
Michael Meyer-Hermann
Institut für Theoretische Physik, TU Dresden, D-01062 Dresden, Germany
E-Mail: meyer-hermann@physik.tu-dresden.de
Abstract: The specific morphology of germinal centers is analyzed in the context of the optimization of the humoral immune response. The relevance of dark and light zones for the affinity maturation process is investigated in the framework of a theoretical model for the germinal center reaction. Especially, it is shown that an intermediate appearance of dark zones in germinal center reactions is advantageous for the process of antibody optimization. Methodological aspects are discussed.
1 Introduction
An important part of the humoral immune response is the germinal center (GC) reaction. GCs are responsible for an optimization process of antibodies with respect to a specific antigen. This process is called affinity maturation: During the GC reaction new plasma cells are generated which secrete antibodies of considerably higher affinity to the antigen.
The GC reaction is initiated by antigen-activated B-cells that migrate into the follicle system. Here, they start to proliferate in the environment of follicular dendritic cells (FDCs). The initiation is believed to be of oligoclonal character, i.e. the number of seeder B-cells is small and of the order of three [1]. After three days of fast monoclonal expansion – the total number of proliferating B-cells (centroblasts) reaches about – a phase of somatic hypermutation is started [2]. The diversity of encoded antibodies is enhanced in this way. The centroblasts differentiate into antibody-presenting centrocytes [3] and an apoptotic process is initiated. However, they have the possibility to get into interaction with the antigen-presenting FDCs and with T-helper cells. It is believed that this interaction depends on the affinity of antibody and antigen, and that these centrocytes which successfully bind the antigen are rescued from apoptosis [4, 5]. This provides a more-step selection process [6] of these B-cells with high affinity to the antigen. Positively selected B-cells further differentiate into plasma- and memory-cells (shortly denoted as output cells). In this way the answer of the immune system is optimized with respect to the antigen.
GCs develop a very specific morphology [7, 8]. The proliferating and mutating centroblasts are collected in the dark zone while centrocytes and FDCs build up the light zone. It is unclear how long the dark zone remains present during a GC reaction. The total duration of a GC reaction is about days [7]. Dark zones have been observed to appear at day and to vanish at day [8]. However, there also exists evidence for dark zones of longer duration [7].
In the present article a possible correlation of the GC morphology and affinity maturation is investigated. in the framework of a mathematical model [9] which considers the spatial distribution of cells in the GC for the first time. The assumptions made in this model will be compared to other model architecture. The postulates of the model are summarized and shortly described in Sec. 2. Note, that all parameters of the model are quantitatively determined in narrow connection to experiment. An analysis of the robustness of the results has been performed previously [9, 10]. Here, we aim to report one major outcome of the model (Sec. 3). An interpretation and possible implications of the results as well as methodological aspects are discussed in Sec. 4.
2 The scheme of the model
A short description of a previously introduced mathematical model for the morphological organisation and cell dynamics of the GC [9] is provided in this section. The GC is simulated on an equidistant two-dimensional lattice with lattice constant . This corresponds to the average cell diameter of B-cells in GCs. The radius of the lattice is , corresponding to a typical radius of a GC. Each lattice point can be occupied by exactly one centroblast, centrocyte, or output cell. All cells actively and isotropically move on the lattice. The diffusion constants are adapted corresponding to the different diameters of centroblasts and centrocytes [11]. FDCs are represented by a soma at one lattice point and four (in 2 dimensions) dendritic arms of length. FDCs are assumed to be immobile reflecting a rather stable FDC network observed in experiment.
It has been previously shown that the development of dark zones can be explained on the basis of non-local cell-cell interactions [9]. Such an interaction may be provided by a chemotaxis gradient which acts on the motility of centrocytes and stems from FDC and/or T-cells and/or naive B-cells in the mantle zone [12]. Another possibility (which will be used in this work) is a diffusing signal molecule which is produced by FDCs and bound by centroblasts [9]. Note, that this implies a separation of signals acting on proliferation and differentiation of centroblasts, as has been proposed in corresponding experiments [13]. The signal molecules are clustered in quanta that diffuse on the lattice according to a classical diffusion equation. The diffusion is not influenced by the presence of cells at the same lattice point. One quantum corresponds to the signal concentration that is necessary to initiate the centroblast differentiation process into centrocytes. Using this non-local concept an intermediate dark zone is produced [9]. The duration of the dark zone basically is dependent on the amount of secreted signal molecules and its diffusion constant. The ratio of centroblast differentiation and proliferation rates changes the duration of the dark zone as well. However, this ratio also has influence on the total life time of the GC as a whole and, therefore, is determined independently.
The affinity of the encoded antibodies to the antigen is formulated with the well known shape space concept [14]. Each type of antibody is represented on a four-dimensional lattice which is ordered in such a way, that neighboring points have similar affinity to the antigen. A hypermutation is represented by a jump to a neighbor point. The affinity between the antibodies on a centrocyte and the antigen on an FDC is modeled by a gaussian affinity weight function centered at the optimal antibody type [10].
The dynamical properties of the different cell types
on the lattice are summarized in the following.
The parameter values have
been quantitatively determined using experimental constraints.
In many cases, indeed, the parameters were directly accessible
in experiments. Others had to be determined indirectly
using experimental observations of the general GC
properties (for more details we refer to [9, 10]):
Centroblasts proliferate with a (constant) rate of
[15].
At each division a somatic hypermutation occurs with
the probability [16].
They differentiate in dependence
on a differentiation signal that is secreted by the FDCs,
and diffuses over the lattice.
The differentiation process is activated when a centroblast
meets a threshold quantum of differentiation signal at the
same lattice point.
Activated centroblasts differentiate
with a rate of into centrocytes [17].
A finite life time of centroblasts is not imposed. However,
the effective life time is shorter than day due to centroblast
differentiation.
Centrocytes die with a rate of [11].
They bind to the FDCs according to
the affinity to the antigen according to an affinity
weight function. Bound centrocytes
remain bound for [18].
They are thought to
be rescued from apoptosis during this time.
Positively selected centrocytes further differentiate
with a rate of
into either re-proliferating centroblasts (with probability
) [10],
or into output cells (with probability ).
The differentiation into
output cells is delayed by with respect to
the starting time of hypermutation [10],
i.e. it starts at day 6 of the GC reaction.
Output cells leave the GC by diffusion and do not
further interact with other cells in the GC.
Dead cells are eliminated from the GC.
The simulations are started with randomly distributed seeder B-cells and FDCs. The fact that centroblasts proliferate at least in parts outside the FDC network during their proliferation phase turned out to be a necessary requirement for the development of dark zones [9]. This is ensured by a random distribution of the FDCs on of the (maximum) GC volume. The seeder cells are of low but non-vanishing affinity to the antigen. They can reach the optimal antibody-type with to mutations [19]. The simulations are insensitive to a change of the time-step-width which is for the presented results. In a stochastic model the outcome of the simulation depends on the used generator of random numbers and on its initialization. Therefore, the results are given with a standard deviation corresponding to this uncertainty.
3 Optimisation of affinity maturation
At first some basic properties of the GC reaction are reported as generated by the model simulation. Assuming the already introduced centroblast differentiation signal (secreted by FDCs and bound by centroblasts) a dark zone develops. It appears at day of the reaction, and remains stable for a duration that depends on the production rate of the signal molecules. In order to simulate different durations of dark zones, the signal production rate is varied. For each production rate the differentiation rate of centroblast is adjusted correspondingly (within physiological constraints) in order to ensure a comparable final state of the GC after 21 days of the reaction. The development of the dark zone as well as its depletion are not principally affected by the variation of other parameters within their physiological constraints. For example a smaller proliferation rate basically scales the whole GC reaction without changing the general behavior.
The time course of the total GC volume is in accordance with experimental observations [7, 20] provided that the dark zone vanishes between day and of the GC reaction (i.e. that the signal production rate is chosen correspondingly): After an exponential increase of the total cell population, a maximum is reached after days of the reaction. The total cell population then is diminished steadily until the end of the reaction after days. At this time only about proliferating B-cells remain in the GC [7]. Taking these results together, the general GC morphology is well described by the model results.
The average affinity of B-cells is enhanced in four phases during the whole GC reaction. This is best illustrated by a typical example with a dark zone present until day . In Fig. 1
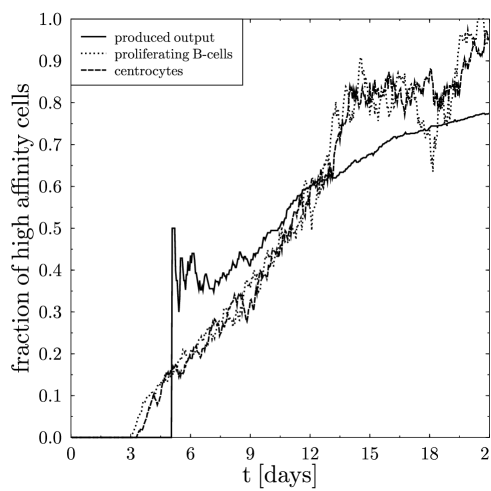
The time course of the fraction of high affinity cells (cells which bind the antigen with a probability of at least ) in the GC reaction is shown for centroblasts, centrocytes, and for the sum of all output cells produced until time of the GC reaction.
the time course of the fraction of high affinity centroblasts and centrocytes is shown [9]. High affinity denotes those B-cells which bind the antigen with a probability of more than . As can be seen, such a cell does not exist at the beginning of the GC reaction. They develop after the start of somatic hypermutations after days. Still one observes a short delay because some mutations have to occur before the first cells appear that have an above threshold affinity to the antigen. Then the relative number of high affinity cells steadily grows. In accordance with experiment, good cells already dominate around day of the GC reaction [2]. One observes an intermediate steep increase, that approximately starts when the dark zone is depleted. This correlation does not seem to be obvious in view of this single example. However, it has been observed in all simulations, especially considering different dark zone durations. In the late phase of the GC reaction the curve reaches a plateau on a high level, and the large majority of B-cells are high affinity cells.
In the same figure the fraction of high affinity output cells is shown. This curve does not show the value at each moment of the GC reaction but the sum of all output cells that has been produced until time . This value is a measure for the total quality of the produced output cells. After day the quality of the output cells is steadily increased during the GC reaction. The part of high affinity output cells reaches in the present example. The average over all simulation with dark zones that vanish between day and of the reaction is (the error is one standard deviation). In view of the fact that at the beginning of the GC reaction no high affinity B-cell existed at all, this affinity enhancement is remarkable.
The main task of the present article is to analyze a possible correlation of the duration of the dark zone and the achieved affinity maturation, i.e. the total output quality at the end of the reaction. A statistical analysis has to be based on comparable GC simulation. By changing the production rate of the centroblast differentiation signal molecule not only the duration of the dark zone is varied. Also the total duration of the reaction is changed. As stated at the beginning of this section, the centroblast differentiation rate is adjusted correspondingly so that the final numbers of B-cells after days of the reaction are of the same range. This is especially important as the affinity maturation process depends on the value of [9]. The average number of B-cells for all simulations is . The error denotes one standard deviation. Only those simulations are taken into account that generate a final number of B-cells within one standard deviation of this average value.
The output quality is plotted against the duration of the dark zone (see Fig. 2).
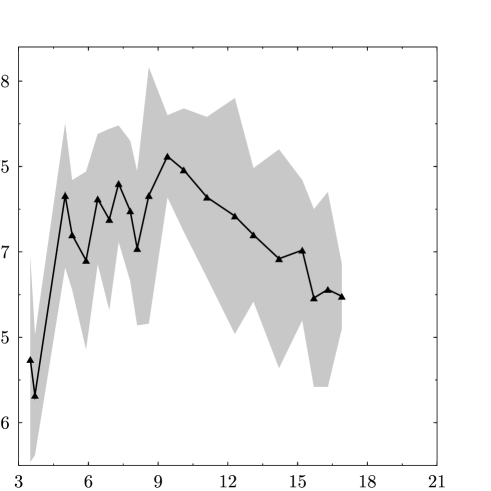
The dependence of the fraction of high affinity output cells on the duration of the dark zone. The grey area denotes one standard deviation of the average values (full line).
The quality of the produced output cells becomes optimized for dark zones that vanish between day and of the GC reaction. For shorter and longer dark zones, the resulting quality of the output cells is reduced. The same holds true for the total number of output cells (data not shown). It is worth pointing out, that intermediate dark zones vanishing around day 9 optimize affinity maturation on the level of quantity and quality of output cells.
4 Discussion
We used a previously developed model to elucidate a possible correlation between the duration of the dark zone and the efficiency of the affinity maturation process. In a first step the simulated GCs were compared to GCs observed in experiment. The essential properties of real GC reactions were correctly reproduced. This includes the appearance of the dark zone, the time course of the total volume, as well as the reached affinity maturation.
It has been previously found [9] that dark zones do not appear in simulations that are based on local cell interactions only. Therefore, it was necessary to introduce an non-local cell interaction into the model in order to understand the intermediate appearance of dark zones as observed in experiment [8].
A centroblast differentiation signal molecule has been assumed that is secreted by FDCs and consumed by the centroblasts. It has been previously shown that such a signal is a promising candidate to explain appearance and depletion of dark zones in GCs [9]. However, the signal molecule has to be understood as a hypothesis, because it is not known how the centroblast differentiation process is initiated in real GC reaction. There are experimental hints that centroblast, indeed, differentiate due to an interaction with FDCs or T-helper cells [13, 21].
Most parameters in the model are strongly constrained by experimental data and consequently the variation of parameters is restricted. However, the production of the hypothesized differentiation signal does not underly such a restriction. It turned out that the duration of dark zones strongly depends on the production rate of the differentiation signal and that other model parameters are less important. This situation opens the possibility to vary the signal production rate and in this way to test the affinity maturation process of GCs with dark zones of different duration. Note, that a corresponding test is not possible in experiments.
A statistical analysis of simulations with different durations of dark zones leads to the conclusion that the quality of the output cells averaged over all produced output cells during the whole GC reaction is optimized for intermediately appearing dark zones that vanish between day and of the GC reaction. Note that also the quantity of produced output cells is optimized for these dark zone durations. In addition, the time course of the total GC volume is in agreement with observed time courses for the same dark zone durations [9].
This result suggests a relation of two, at first sight, very different categories: The GC morphology and affinity maturation of B-cells. The morphology of the GC is basically determined by a non-local interaction with other cell-types. However, the function of the specific GC morphology is not restricted to a spatial arrangement of interacting cells. One may suspect that specific cell arrangements are advantageous for the success of the GC reaction. The duration of the dark zone does not only determine the time course of the cell distribution in GCs but also to be a critical parameter for the quality and amount of output of the GC reaction. This leads to the question of how the spatial distribution of centroblasts and centrocytes influences the affinity maturation process.
On one hand the existence of the dark zone is necessary to produce a large pool of different B-cell types, i.e. a high diversity of encoded antibody-types. This diversification is optimally realized with a fast proliferation of centroblasts without major interaction to antigens. The mutations are likely to occur randomly [22] and it is supposed that starting from low (but non-vanishing) affinity seeder cells better B-cells are found during this process, eventhough most clones will be of even less quality from a probabilistic point of view. The diversification process continues in the dark zone when the selection process has already started. Note that recycled B-cells that return into the dark zone don’t have been observed in the simulations [9]. Therefore, the B-cells that proliferate in the dark zone are not recycled B-cells but directly stem from the original seeder cells.
After about days some high affinity cells have been found and identified in the selection process that takes place in the light zone. These roughly optimized B-cells are mostly recycled cells [23] and restart to proliferate in the light zone. A further enhancement of affinity to the antigen is based on these preselected B-cells. How does the ongoing process of diversification in the dark zone develop? The cells produced in this random process cannot overcome a certain B-cell quality. Therefore, a re-proliferation of already selected B-cells is more promising for the further development of the GC reaction. This process resembles a directioned selection process that replaces the random process in the dark zone. Ongoing proliferation and mutation in the dark zone does not only become senseless (as the quality of the cells in the dark zone are below the average B-cell quality in the light zone). They would also hinder the optimization process in the light zone because B-cells of relatively low affinity would take part in the selection process. Consequently, the selection of high affinity cells would be inhibited by a repetition of a first selection process with B-cells stemming from the dark zone. An early depletion of the dark zone eliminates the low affinty B-cells from the GC and in this way allows a fine-tuning of preselected B-cells. We conclude that a dark zone is needed in an early stage of the GC reaction to give centroblasts the possibility to proliferate and mutate independently of the FDC network. At later stages a fine-tuning of already preselected B-cells in the direct neighborhood of the antigen presenting FDCs becomes more important and a persisting dark zone inhibits affinity maturation.
One should be aware that this interpretation only provides a possible explanation of the correlation between morphology and affinity maturation that has been found in the framework of a spatial model for GCs. The basic concepts used here are in accordance with a widely accepted picture of GCs. Nevertheless, the used method has to be critically reviewed. The simulation are based on a regular lattice. We can widely exclude an effect of lattice symmetries on the results by comparing results from different lattice architectures [12]. We have presented a statistical evaluation of two-dimensional simulations. Indeed, the general behaviour of the simulations does not change in three dimensions [24].
A more relevant problem is the representation of cells of different size on equal lattice nodes. We have shown that such a description leads to wrong results if considering chemotaxis as the driving mechanism for the development of the dark zone [12]. In such a scenario typical cell velocities differ in two orders of magnitude and a more reliable description of cell volumes becomes unavoidable. We have therfore tested if the results are altered using this more sophisticated cell volume concept. For cells as slow as in the present simulations the more simple volume concept turns out to be completely sufficient (data not shown).
In regular lattice simulations the number of neighboring lattice nodes is fixed. In a one-cell-one-node description this determines the number of possible interaction partners of a cell. The effect of this restriction is not easily estimated. The simulation should be compared to a lattice free description. To this end we have implemented the first three dimensional dynamical Delaunay triangulation code with variable number of vertices [25]. The cells are identified with the vertices (in a continuous space) and the Delaunay triangulation is used in order to calculate the neighbors of each cell. The triangulation has to be maintained after the movement of cells (vertices). In order to allow for proliferation and apoptosis the creation and deletion of vertices has to be included. The application of this method to GC reaction will provide another test for the stability of the results presented here.
Acknowledgments
I thank Tilo Beyer, Andreas Deutsch and Gernot Schaller for intense discussions and valuable comments.
References
- [1] Kroese, F.G. / Wubbena, A.S. / Seijen, H.G. / Nieuwenhuis, P., 1987: Germinal centers develop oligoclonally, Eur. J. Immunol. 17, 1069-1072.
- [2] Jacob, J. / Przylepa, J. / Miller, C. / Kelsoe, G., 1993: In situ studies of the primary response to (4-hydroxy-3-nitrophenyl)acetyl. III. The kinetics of V region mutation and selection in germinal center B cells, J. Exp. Med. 178, 1293-1307.
- [3] Han, S. / Zheng, B. / Takahashi, Y. / Kelsoe, G., 1997: Distinctive characteristics of germinal center B cells, Immunology 9, 255-260.
- [4] Liu, Y.J. / Joshua, D.E. / Williams, G.T. / Smith, C.A. / Gordon, J. / MacLennan, I.C., 1989: Mechanism of antigen-driven selection in germinal centres, Nature 342, 929-931.
- [5] van Eijk, M. / Medema, J.P. / de Groot, C., 2001: Cellular Fas-Associated Death Domain-Like IL-1-Converting Enzyme-Inhibitory Protein Protects Germinal Center B Cells from Apoptosis Durin Germinal Center Reactions, J. Immunol. 166, 6473-6476.
- [6] Lindhout, E. / Koopman, G. / Pals, S.T. / de Groot, C., 1997: Triple check for antigen specificity of B cells during germinal centre reactions, Immunol. Today 18, 573-576.
- [7] Liu, Y.J. / Zhang, J. / Lane, P.J. / Chan, E.Y. / MacLennan, I.C.M., 1991: Sites of specific B cell activation in primary and secondary responses to T cell-dependent and T cell-independent antigens, Eur. J. Immunol. 21, 2951-2962.
- [8] Camacho, S.A. / Koscovilbois, M.H. / Berek, C., 1998: The Dynamic Structure of the Germinal Center, Immunol. Today 19, 511-514.
- [9] Meyer-Hermann, M., 2002: A Mathematical Model for the Germinal Center Morphology and Affinity Maturation, J. Theor. Biol. 216, 273-300.
- [10] Meyer-Hermann, M. / Deutsch, A. / Or-Guil, M., 2001: Recycling Probability and Dynamical Properties of Germinal Center Reactions, J. Theor. Biol. 210, 265-285.
- [11] Liu, Y.J. / Barthelemy, C. / de Bouteiller, O. / Banchereau, J., 1994: The differences in survival and phenotype between centroblasts and centrocytes, Adv. Exp. Med. Biol. 355, 213-218.
- [12] Beyer, T. / Meyer-Hermann, M. / Soff, G., 2002: A possible role of chemotaxis in germinal center formation, Int. Immunol. 14, 1369-1381.
- [13] Han, S.H. / Hathcock, K. / Zheng, B. / Kepler, T.B. / Hodes, R. / Kelsoe, G., 1995: Cellular Interaction in Germinal Centers: Roles of CD40-Ligand and B7-1 and B7-2 in Established Germinal Centers, J. Immunol. 155, 556-567.
- [14] Perelson, A.S. / Oster, G.F., 1979: Theoretical Studies of Clonal Selection: Minimal Antibody Repertoire Size and Reliability of Self-Non-self Discrimination, J. Theor. Biol. 81, 645-670.
- [15] Hanna, M.G., 1964: An autoradiographic study of the germinal center in spleen white pulp during early intervals of the immune response, Lab. Invest. 13, 95-104.
- [16] Nossal, G., 1991: The molecular and cellular basis of affinity maturation in the antibody response, Cell 68, 1-2.
- [17] Choe, J. / Li, L. / Zhang, X. / Gregory, C.D. / Choi, Y.S., 2000: Distinct Role of Follicular Dendritic Cells and T Cells in the Proliferation, Differentiation, and Apoptosis of a Centroblast Cell Line, L3055, J. Immunol. 164, 56-63.
- [18] van Eijk, M. / de Groot, C., 1999: Germinal Center B-Cell Apoptosis Requires Both Caspase and Cathepsin Activity, J. Immunol. 163, 2478-2482.
- [19] Wedemayer, G.J. / Patten, P.A. / Wang, L.H. / Schultz, P.G. / Stevens, R.C., 1997: Structural insights into the evolution of an antibody combining site, Science 276, 1665-1669.
- [20] Hollowood, K. / Macartney, J., 1992: Cell kinetics of the germinal center reaction — a stathmokinetic study, Eur. J. Immunol. 22, 261-266.
- [21] Dubois, B. / Barthélémy, C. / Durand, I. / Liu, Y.-J. / Caux, C. / Brière, F., 1999: Toward a Role of Dendritic Cells in the Germinal Center Reaction – Triggering of B-Cell Proliferation and Isotype Switching, J. Immunol. 162, 3428-3436.
- [22] Radmacher, M.D. / Kelsoe, G. / Kepler, T.B., 1998: Predicted and Inferred Waiting-Times for Key Mutations in the Germinal Center Reaction – Evidence for Stochasticity in Selection, Immunol. Cell Biol. 76, 373-381.
- [23] de Vinuesa, C.G. / Cook, M.C. / Ball, J. / Drew, M. / Sunners, Y. / Cascalho, M. / Wabl, M. / Klaus, G.G.B. / MacLennan, C.M., 2000: Germinal centers without T cells, J. Exp. Med. 191, 485-493.
- [24] Meyer-Hermann, M. / Beyer, T., 2003: Conclusions from two model concepts on germinal center dynamics and morphology, to appear in Develop. Immunol.
- [25] Schaller, G. / Meyer-Hermann, M., 2003: Dynamic Delaunay tetrahedralizations and Voronoi tessellations in three dimensions, preprint at http://arXiv.org/abs/physics/0302018.