Specular reflection of matter waves from a rough mirror
Abstract
We have made a high resolution study of the specularity of the atomic reflection from an evanescent wave mirror using velocity selective Raman transitions. We have observed a double structure in the velocity distribution after reflection: a peak consistent with specular reflection and a diffuse reflection pedestal, whose contribution decreases rapidly with increasing detuning. The diffuse reflection is due to two distinct effects: spontaneous emission in the evanescent wave and a roughness in the evanescent wave potential whose amplitude is smaller than the de Broglie wavelength of the reflected atoms.
pacs:
03.75.Be, 32.80.Lg, 42.25.Fx, 42.50.VkAtomic mirrors are key components in the growing field of atom optics, and have been intensively studied by several groups in recent years saba:99a ; cognet:99b ; lau99a ; arnold:02a ; landragin:96a ; bongs:99 ; bloch:01 ; kadio:01 ; voigt:00a . For interferometric and lithographic applications, it is particularly important to ensure that the reflection at the mirror is specular, since diffuse scattering amounts to a loss of spatial coherence and consequently to a reduction of fringe visibility or focusing sharpness. Thus much interest has been devoted to measuring and improving the roughness of atomic mirrors, using static or time dependent magnetic fields saba:99a ; cognet:99b ; lau99a ; arnold:02a , evanescent waves landragin:96a or other techniques bloch:01 .
Most of the above mentioned experiments consisted in preparing an initial narrow velocity distribution, transverse to the direction of incidence, and measuring the broadening of this distribution due to the reflection. The effect of the mirror was characterized by a single quantity, the rms increase in the width of the velocity distribution attributable to the mirror. This increase was sometimes also given in terms of an effective rms angular deviation from a perfectly flat surface. In those experiments however, the resolution only allowed a measurement of the broadening of the atomic velocity distribution due the mirror. In this paper we present an experiment using velocity selective stimulated Raman transitions to prepare a very narrow initial velocity distribution Kasevich:91a , and to measure the distribution after reflection. For the first time we are able to resolve a final velocity distribution which is not merely broadened, but qualitatively modified upon reflection.
Much in analogy with the reflection of light from an optical mirror, we observe a double structure, with a narrow peak and a broad pedestal. The narrow peak corresponds to specularly reflected atoms. The broad pedestal corresponds to diffuse atomic reflection which has two origins: spontaneous emission and mirror roughness. If we assume that the roughness of the mirror can be viewed as a random process with variance and a correlation length much shorter than the mirror itself, one readily finds Garcia:93a ; Henkel:97b that the fraction of specularly reflected atoms is given by , reminiscent of the Debye-Waller factor, with , where is the de Broglie wavelength of the incident matter wave (8 nm in our experiment). The presence of a significant specular peak implies an effective 111Explicit calculations relating the effective mirror roughness to actual substrate roughness are given in Garcia:93a ; Henkel:97b mirror roughness smaller than .
We have studied the ratio of these two components as a function of various parameters and shown in particular that the diffuse component rapidly decreases when the atomic evanescent wave detuning increases. These observations also allow us to examine different possible mechanisms for the diffuse reflection involving either mirror roughness or spontaneous emission.
In our experiment we use an evanescent wave mirror, identical to the one described in Ref. Cognet:98a . We use a superpolished prism of TaFD30 glass 222purchased from General Optics, Moorpark California (refractive index ). The rms surface roughness given by the manufacturer is nm. The input and output faces for the laser beam which creates the evanescent wave are coated with a broadband AR reflection coating. A Ti:S laser of wavelength nm generates the evanescent wave with an incident angle . The evanescent electric field thus has a decay constant of , and a propagation vector of magnitude . We have defined the -axis to be along the evanescent wave propagation direction. The Ti:S laser is TM (p) polarized and its waist is about mm along the and -axes at the surface of the prism.
Our 85Rb magneto-optical trap (MOT) is similar to that described in Ref. Cognet:98a . Every s, we collect about atoms in the trap. By turning off the repumping beam just before (after) the trapping beams, we prepare the atoms in the () level. The MOT is situated mm above the prism.
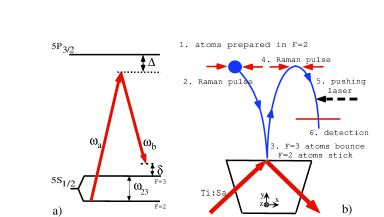
Velocity selective Raman transitions between and hyperfine levels are induced by a pair of counter-propagating laser beams detuned from the one photon atomic resonance by about 1 GHz ( in Fig. 1) Kasevich:91a . Because of the Doppler effect, the resonance condition for a two photon Raman transition depends on the atomic velocity and is given by , where is the detuning of the Raman beams from the hyperfine transition, is the projection of the atomic velocity on the Raman beam direction, and is the one photon recoil velocity of Rb, 6 mm/s. By varying the detuning , we can choose the center of the velocity class that experiences a transition.
The two Raman beams are orthogonally linearly polarized and drive the magnetic field independent Raman transition between denoted and denoted . A mG magnetic field oriented along the beam propagation direction lifts the degeneracy of the Zeeman levels in the and manifolds. Atoms which are not in the state are out of Raman resonance and make no transitions. The Raman beams propagate at with respect to the evanescent wave propagation vector in the -plane. It is therefore necessary to rotate the magnetic field adiabatically while the atoms fall to the mirror in order that they be in an eigenstate of the polarization (nearly circular) of the evanescent wave. After reflection the magnetic field is turned back to coincide with the propagation direction of the Raman beams.
To generate the Raman beams (separated by GHz), we modulate the injection current of a free running diode laser at GHz and inject the sidebands into two slave laser diodes (each diode is injected by one sideband). Before injection, the laser beam passes through a Fabry-Perot cavity of GHz spectral range, a finesse of , and locked to the two sideband wavelengths to filter out the carrier wavelength and the sidebands. After injection, each Raman beam passes through an acousto-optic modulator (AOM). An arbitrary function generator modulates these AOMs to produce Blackman pulses Kasevich:92a of the desired duration. Observation of the beat note between the two slave laser beams indicates a relative frequency spread less than Hz (equal to the resolution bandwidth of the spectrum analyser) sufficiently narrow that the Raman transition width is not limited by the Raman phase coherence.
To test our setup, we first make a velocity selection and immediately analyse it with a second Raman pulse. At , we prepare the atoms in the state. At ms we apply a Raman pulse with a detuning to transfer atoms to . Then comes a pushing beam resonant with the transition which removes all the atoms remaining in . At ms we apply a second Raman “analysis” pulse with a detuning to transfer atoms back to . The atoms in the level are detected via the fluorescence induced by a retroreflected probe laser resonant with the transition and collected in a sr solid angle on a photomultiplier tube. No repumper is present in order to avoid detection of atoms in the level.
We repeat the sequence with a different value of in order to acquire the transverse velocity distribution of incident atoms (Figure 2(a)). The half width at of the distribution is kHz. This width is consistent with what is expected for a s Blackman pulse. The curve demonstrates a velocity selection width for a single pulse of (HW at ) along the propagation direction of the Raman beams. This is about times narrower than the velocity width in the MOT. Because the analysis sequence has the same resolution as the selection sequence, our velocity resolution is times larger, that is . This resolution is times better than what was used in Ref. landragin:96a .
To observe the effect of the reflection on the transverse velocity, we proceed in a manner analogous to that described above (see Fig. 1). At we prepare the atoms in the level. The Raman selection pulse transfers a narrow velocity class to at ms. The atoms then fall onto the mirror. The frequency of the evanescent wave is tuned to the blue of the resonance to the excited state of the line, and to the red of the resonance. Atoms in do therefore not reflect from the mirror. After reflection ( ms), the analysis pulse transfers some atoms back into . Next the pushing beam removes the atoms remaining in the level and finally we detect the atoms transferred to with the probe laser and the repumper.
Atoms which have not been selected by the first Raman selection pulse can contribute to a background if they happen to be pumped into the state (by the evanescent wave, for example) during their trajectory. We measure this background using the same sequence described just above with the selection detuning tuned far from resonance. In our data acquisition we alternate between normal and background measurements and subtract the background on each shot. The detuning of the analysis pulse is scanned randomly over the desired values, and we acquire and average about measurements for each value of to acquire a spectrum such as that shown in Fig. 2(b). The peak value in Fig. 2(b) corresponds to about atoms detected per bounce. Typical values of the background in this case correspond to about atoms. Despite this subtraction, we observe a non-zero background in Figs. 2 and 3. This background appears to be due to atoms which reflect from the mirror but are pumped into the state after reflection.
With this system, we first checked that the atoms obey the law of reflection, that is the reflected angle is equal to the incident one. We vary the mean velocity of the initial distribution by choosing an appropriate , and verify that the center of the reflected velocity distribution varies by the same amount. We have noted a non-zero intercept of this linear dependence which we attribute to a slight tilt (about ) in the mirror relative to the horizontal.
For a reflection to be regarded as truly specular, the velocity distribution must remain unchanged after reflection. Figure 2(b) shows the velocity distribution (the number of atoms detected in the state after the Raman analysis pulse) after the bounce. One distinguishes a narrow peak whose width appears identical to the initial one, and a broad pedestal whose center is shifted by 7.9 kHz, an amount corresponding to a momentum transfer with respect to the narrow one along the observation direction. This transfer is in the same direction as the evanescent wave propagation vector, and remains so when the evanescent wave (Ti:S) laser direction is reversed (that is it also reverses).
In an attempt to understand the origin of the pedestal, we acquired several reflected velocity distributions under differing conditions; two examples are shown in Fig. 3. Each such distribution is fitted to a sum of two Gaussians plus a flat background. We first examined the parameters of the pedestal as a function of the evanescent wave detuning . We observed little variation of the width and the shift relative to the narrow peak. To simplify the study of the relative contribution of the two components, we fixed the width of the narrow peak at the measured width of the resolution function. We also fixed the width of the pedestal and the shift at the average values of our preliminary fits: the pedestal width was fixed to be that of the convolution of our resolution function and a Gaussian of 18 kHz rms and the shift to be 7.9 kHz. Using this analysis we can measure the fraction of atoms detected in the narrow peak as a function of . (See Fig. 4.) The data are well fit by with GHz.
The above detuning dependence immediately suggests spontaneous emission within the evanescent wave which reduces the numbre of specluarly reflected atoms by a factor of . A simple estimate of , the average number of spontaneous emissions, is given by , where MHz is the natural linewidth of the atomic transition Kasevich:90a ; voigt:00a . A better estimate includes the modification of the potential due to the van der Waals interaction Landragin:96b , the modification of the spontaneous emission rate close to the surface Courtois:96a , and an average of these effects over the mirror surface. We find, in our range of detunings, that still varies as to a good approximation but with a probability about 1.5 times higher. To calculate one must also take into account the fact that at large detunings the branching ratio for falling back into the state, the only one which we detect, is 2/3. This factor cancels the increase in due to the effects of the dielectric surface. One predicts therefore with GHz. There appears to be too little spontaneous emission (by a factor of 2) to entirely explain our results.
In addition, spontaneous emission in the evanescent wave should result in an average momentum transfer of along , that is, a shift of the broad pedestal of along the Raman beam direction instead of the that we observe. This observation confirms the above conclusion that spontaneous emission in the evanescent wave is only partly responsible for our observations. This is in contrast to the study of Ref. voigt:00a which used a very small value of to get a large number of spontaneous emissions in the evanescent wave.
Another mechanism which causes diffuse reflection is discussed in Ref. Henkel:97b . It involves scattered Ti:S light which interferes with the evanescent wave. The interference produces a rough potential which diffusely scatters the atoms. This mechanism does not involve spontaneous emission. The scattered light could come either from the surface roughness, inhomogeneities in the bulk of the prism or some other object such as a prism edge. Using the results in Ref. Henkel:97b one can show that the propagating modes of the scattered light would cause to vary as . Where depends on the amount of scattered light. The pedestal due to this effect should exhibit no shift relative to the specular peak. Since spontaneous emission is responsible for about one half the pedestal, we expect a pedestal shifted by about one half of the shift due to spontaneous emission alone in good agreement with our observations. Since both effects have the same dependence the observed shift should not depend on the detuning.
Another possible explanation for the pedestal is spontaneous emission induced by the stray light above the prism while the atoms fall towards the mirror. Indeed, in experiments in which we left the evanescent wave laser on for ms while the atoms fell towards the mirror, we observed an optical pumping of the atoms from their initial hyperfine state (F=3) to the other hyperfine state (F=2) (about of the atoms were lost in this way at MHz). This mechanism predicts that should vary as , where is a constant which depends on the mean light intensity experienced by the atoms. As shown in Fig. 4 the data are not consistent with this dependence.
Thus we believe that we have identified the source of the diffuse reflection in our experiment as the sum the effects of the scattering of atoms from a potential induced by the random interference pattern of the evanescent wave and stray light, and spontaneous emission in the evanescent wave. According to this interpretation we have and we can work out the effective mirror roughness associated with . We find nm, a value much larger than the prism’s measured surface roughness (0.07 nm). Since the effective mirror roughness due to light scattering by the prism surface is of the order of the surface roughness itself Henkel:97b , we presume that most of the stray light is from other sources.
We turn now to an analysis of the narrow peak. Since the area under the broad peak can be reduced by increasing the detuning , the essential question is “How faithfully is the initial velocity distribution reproduced in the narrow peak?”. To characterize this effect, we compare the width of the narrow peak to that of the resolution function (atomic experimental velocity distribution before the bounce) for 36 runs acquired at different values of . We now fit the experimental curves by a sum of two Gaussians with all parameters adjustable except for the width and center of the broad peak. Averaging over 36 measurements, we find , where and are the half widths at of the two curves after the bounce, and the uncertainty is the standard deviation of the weighted mean of our 36 measurements. A negative sign in the result is not necessarily unphysical because it could be due for example, to a slightly concave reflecting surface which collimates the atoms. We do not consider this deviation from zero to be statistically significant, however. We conclude that the observed reflection is consistent with a specular reflection to within about . Our limit is a factor of 10 better than our previous best result landragin:96a .
To compare our results with those of Refs. saba:99a and lau99a , we calculate the rms angular deviation of an effective reflecting surface from perfectly plane: , where is the incident atomic velocity on the mirror and is the rms transverse velocity added by the mirror. Using the upper limit , we find that the effective mirror surface is flat to within uncertainty of mrad.
Thus, we conclude that at sufficiently large detunings, it is possible to produce a highly specular mirror for atomic de Broglie waves. By analogy with photon optics, the double structure we observe suggests that we are in the regime where the roughness of the atomic mirror is small compared to the wavelength of the reflected matter wave. In that regime, the specular peak corresponds to a “perfectly” coherent reflection, and it should be possible to test this property in an atom interferometer. Interferometric experimental studies are in progress.
Acknowledgments
We acknowledge the assistance of C. Aussibal and thank C. Henkel and J. Thywissen for useful discussions. This work was supported by the European Union under grants IST-1999-11055, and HPRN-CT-2000-00125, and by the DGA grant 99.34.050.
References
- (1) A. Landragin, G. Labeyrie, C. Henkel, R. Kaiser, N. Vansteenkiste, C. Westbrook, and A. Aspect, Opt. Lett. 21, 1591 (1996).
- (2) C. V. Saba, P. A. Barton, M. G. Boshier, I. G. Hughes, P. Rosenbusch, B. E. Sauer, and E. A. Hinds, Phys. Rev. Lett. 82, 468 (1999).
- (3) L. Cognet, V. Savalli, P. Featonby, K. Helmerson, N. Westbrook, C. Westbrook, W. Phillips, A. Aspect, G. Zabow, M. Drndic, C. S. Lee, R. M. Westervelt, et al., Europhys. Lett. 47, 538 (1999).
- (4) D. Lau, A. Sidorov, G. Opat, R. M. Lean, W. Rowlands, and P. Hannaford, Eur. Phys. J. D. 5, 193 (1999).
- (5) K. Bongs, S. Burger, G. Birkl, K. Sengstock, W. Ertmer, K. Rzazewski, A. Sanpera, and M. Lewenstein, Phys. Rev. Lett. 83, 3577 (1999).
- (6) I. Bloch, M. Köhl, M. Greiner, T. Hänch, and T. Esslinger, Phys. Rev. Lett. 87, 030401 (2001).
- (7) D. Kadio, O. Houde, and L. Pruvost, Europhys. Lett. 54, 417 (2001).
- (8) D.Voigt, B. Wolschrijn, R. Jansen, N. Bhattacharya, R. J. C. Spreeuw, and H. B. van Linden van den Heuvell, Phys. Rev. A 61, 063412/1 (2000).
- (9) A. Arnold, C. MacCormick, and M.Boshier, Phys. Rev. A 65, 031601 (2002).
- (10) M. Kasevich, D. Weiss, E. Riis, K. Moler, S. Kasapi, and S. Chu, Phys. Rev. Lett. 66, 2297 (1991).
- (11) N. Garcia and M. Nieto-Vesperinas, Phys. Rev. Lett. 71, 3645 (1993).
- (12) C. Henkel, K. Molmer, R. Kaiser, N. Vansteenkiste, C. I. Westbrook, and A. Aspect, Phys. Rev. A 55, 1160 (1997).
- (13) L. Cognet, V. Savalli, G. Z. K. Horvath, D. Holleville, R. Marani, N. Westbrook, C. Westbrook, and A. Aspect, Phys. Rev. Lett. 81, 5044 (1998).
- (14) M. Kasevich and S. Chu, Phys. Rev. Lett. 69, 1741 (1992).
- (15) M. Kasevich, D. Weiss, and S. Chu, Opt. Lett. 15, 607 (1990).
- (16) A. Landragin, J.-Y. Courtois, G. Labeyrie, N. Vansteenkiste, C. Westbrook, and A. Aspect, Phys. Rev. Lett. 77, 1464 (1996).
- (17) J. Y. Courtois, J. M. Courty, and J. Mertz, Phys. Rev. A 53, 1862 (1996).