An all-cryogenic THz transmission spectrometer
Abstract
This paper describes a THz transmission spectrometer for the spectral range of 2-65 cm-1 (100 GHz to 2 THz) with a spectral resolution of at least 1.8 cm-1 (50 GHz) where the source, sample, and detector are all fully contained in a cryogenic environment. Cyclotron emission from a two-dimensional electron gas heated with an electrical current serves as a magnetic field tunable source. The spectrometer is demonstrated at 4.2 K by measuring the resonant cyclotron absorption of a second two dimensional electron gas. Unique aspects of the spectrometer are that 1) an ultra-broadband detector is used and 2) the emitter is run quasi-continuously with a chopping frequency of only 1 Hz. Since optical coupling to room temperature components is not necessary, this technique is compatible with ultra-low temperature (sub 100 mK) operation.
pacs:
PACS: 07.57.Hm, 07.57.Pt, 73.22.Lp, 73.43.FjI Introduction
Many quantum systems of contemporary interest in condensed matter physics have energy levels in the meV range. These include, but are not limited to, two dimensional electron gas (2DEG) systems in high magnetic fields exhibiting the fractional and integer quantum hall effects, quantum nano-structures such as quantum dots and carbon nanotubes, and metallic single-electron transistors. In these systems, temperature dependent behavior in dc transport measurements is observed all the way down to tens of mK. The measurement of the far-infrared (THz) transmission through such systems at ultra-low temperatures could provide complementary information about the excitation spectrum of the system.††footnotetext: a)Current address: Integrated Nanosystems Research Facility, University of California, Irvine 92697
The standard technique to measure THz transmission is with a Fourier Transform Infrared Spectrometer (FTIR) or a molecular gas laser which couples optically to a cold sample from room temperature. The disadvantage of this technique is that broadband, thermal blackbody radiation is also coupled to the sample; this is incompatible with ultra-low temperature (sub 100 mK) operation. Numerically, the (integrated) power density is 40 mW/cm2 at 300 K; typically[1] this must be attenuated to of order pW in order to avoid sample heating in many ultra-low temperature systems; at the same time the radiation in the frequency band of interest must be detectable with reasonable signal to noise for the FTIR system to operate at all. In principle, this technique can be carried out. One must construct a set of filters with the desired pass functions from microwave to optical frequencies[2].
In this paper an all-cryogenic spectrometer is presented that bypasses the necessity to construct such filters. The spectrometer is based on magnetic field tunable cyclotron resonance (C.R.) emission from a high-mobility 2DEG in a GaAs/AlGaAs heterojunction, together with a broadband detector. Figure 1 illustrates the concept. Our demonstration experiment is carried out in a 4 K environment, but the technique is compatible with ultra-low temperature (dilution refrigerator) environments.
A transmission spectrometer using C.R. emission from bulk GaAs was proposed in 1980[3]. Based on that proposal, a spectrometer was built by Knap[4] in 1992 using C.R. emission from 2DEGs in GaAs, with a spectral resolution of 1.3 cm-1 using narrow and moderate band detectors. The spectrometer presented here is an improvement on that developed by Knap it two important ways. First, an ultra-broadband detector is used in place of a narrow band detector. This allows a much wider range of frequencies to be accessed in principle; in this particular case the range of 2-65 cm-1 are immediately accessible with a single sweep of the magnetic field. Second, we use a very low chopping frequency (1 Hz). Previous studies of C.R. emission[4, 5, 6, 7, 8, 9, 10, 11, 12, 13] typically used microsecond or millisecond pulses with low duty cycle for fear of overheating the sample and inadvertently broadening the emission linewidth. The experimental results presented here indicate that low chopping frequencies do not significantly degrade the emission linewidth. Low chopping frequencies will allow the use of state-of-the-art ultra-low-noise bolometers, which have exquisite sensitivity but time constants limited to typically tens of ms[14]. In this paper, we also provide a quantitative estimate of the generated C.R. power and spectrometer noise performance, as well as quantitative estimates for the ultimate limits of this technique using current as well as future detector technology with the promise of single photon sensitivity in the THz band[15, 16, 17].

II THz source
A Principle of operation
In two-dimensional electron gas in the presence of a magnetic field perpendicular to the plane, the spectrum of states (in the absence of disorder and interactions) is given by a discrete set of Landau levels, with energies given by
| (1) |
where
| (2) |
is referred to as the cyclotron frequency. At low temperatures, the lowest energy states are filled, and higher energy states are empty. If the electrons are heated to a higher temperature, then higher energy states are populated. The higher-energy electrons can decay to the lower energy levels via phonon emission or photon emission; in the latter case the photon frequency is given by . In our technique, we heat the electrons with a dc current; the emission frequency is then tunable by magnetic field. This cyclotron emission from 2DEGs has been studied by many groups[4, 5, 6, 7, 8, 9, 10, 11, 12, 13, 18, 19, 20]. Here, we are mainly interested in characterizing the emission power and spectrum in order to use it as a THz source.
Our source consists of a 5x5 mm2 (cleaved) 2DEG formed in a GaAs/AlGaAs modulation-doped quantum well grown by molecular beam epitaxy. The mobility and density are and , respectively. Ohmic contacts of diffused Au/Ni/Ge are deposited along both edges of the sample to make low-resistance contacts. We have characterized the emission power using a broadband detector. To drive our source electrically, we apply a 0.5 Hz sinusoidal voltage to the terminals, typically with a 10 k resistor in series with the emitter. Since heating by the electrical current causes spontaneous emission, and since the power delivered to the emitter from the battery is proportional to , the emission power is periodic with a frequency given by twice the electrical drive frequency. We thus detect the synchronous voltage on the detector at the second harmonic of the drive frequency, 1 Hz.
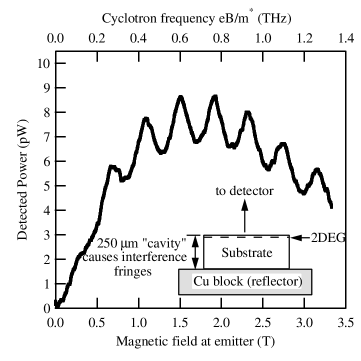
The detector is a commercially available broadband composite bolometer[21] placed at one end of a 7 ” long 1/2 ” diameter evacuated (gold plated) light pipe. It consists Ge thermistor mounted on a thin-film (NiCr) coated sapphire absorber with dimensions 4x4 mm2. The emitter is placed at the other end of the light pipe, inside the bore of a superconducting magnet. The measured emission power at the detector for an electrical input power of 1 mW (electric field of roughly 20 V/cm) is shown in figure 2 as a function of the source magnetic field. The smooth variation of power as a function of magnetic field is due to the variation of the emitter resistance (and hence the power delivered from the battery) with the magnetic field. The periodic structures are interference fringes due to the Fabry-Perot etalon formed by the substrate. This effect was modeled and measured by Zinovev[13], and provides evidence that the source is indeed quasi-monochromatic. Three important figures of merit for our source are the optical beam pattern, emitted power, and linewidth. We discuss these each in turn below.
B Optics
The emission from our sample is mostly into the substrate due to its high dielectric constant. We have mounted the sample with a thin layer of vacuum grease onto a highly-reflective (gold plated) mount. This reflects most of the light emitted into the substrate. We also tried evaporating a thin metallization layer on the back surface (Al), with no change in the output power. It is well-known that the emissivity from thin films is distributed very uniformly over the entire 2 steridian available solid angle[22]. In our case, since the beam pattern is spread out even more after reflection and passing through the dielectric/air interface, the emission is essentially isotropically distributed as a function of solid angle. We use a light-pipe to guide the radiation to the detector; in principle a lens system can be used to focus it if that is desired. The radiation is circularly polarized for vertical emission, but multiple reflections off of the light pipe walls and the substrate/sample interface at varying angles served to randomize the polarization.
C Power
The absolute power available is important, since this sets the sensitivity requirements for the detector in our arrangement. Absolute power calibrations at this frequency are typically no better than a factor of two[23], and our results for the measured signal are also reproducible to only a factor of two between cooldowns. This may be due to drift in the detector responsivity or to inherent changes in the sample between thermal cycles. We estimate the absolute power response of the detector using the method of dc substitution. In this method, we determine the detector responsivity (in V/W) to dc power, and assume the responsitivity is the same for THz power. This is generally the best agreed upon method for absolute power measurements at THz frequencies. This gives a responsivity of for our detector; we find it also has a noise equivalent power (NEP) of at a chopping frequency of 1 Hz[24]. We estimate an optical efficiency from the source to the detector of order 10%; this is mainly due to the fact the we use a diameter light pipe, but the detector is only 4x4 mm2 in size. (No cone is used to concentrate the radiation onto the detector.) Thus, from the measured power we determine the absolute output power is roughly 100 pW for an electrical input power of 1 mW. In a dilution refrigerator environment, the emitter would have to be carefully heat sunk to a thermal stage that could handle the power load. This is possible without too much difficulty.
Our results for the emission power are consistent with those of Zinovev[13], who used microsecond electrical pulses and found roughly 50 pW of ac power out for roughly 1 mW in, but inconsistent with the results of Kawano[19], who find 50 pW out for 50 mW in. These variations in the output power within the literature may be related to the sample geometry or the optical coupling techniques used.
D Linewidth
The spectral resolution of our spectrometer is limited by the linewidth of the source. In reality, the spectrum of states in a 2DEG in a magnetic field is broadened by disorder. We infer an upper limit on the linewidth of our source by measuring the transmission vs. magnetic field through a sample with a known resonant absorption behavior. This is discussed in further detail in section III. Based on these measurements, we infer an upper limit of 1.8 cm-1 (FWHM) on our source linewidth. These results are consistent with those of Knap[4] and Komiyama[18], who studied C.R. emission from samples of similar mobility. The fact that we find such a narrow linewidth even when running the emitter quasi-continuous is important; this issue is discussed in more detail below.
If the current distribution and optical emissivity as a function of position on the surface of the sample were known, it should in principle be possible to model the interference fringes in figure 3 to determine the spectral linewidth. Zinovev[13] modeled the interference fringes for the case of vertical emission only and found qualitative agreement with the measured fringe pattern. However, the emission angle is not purely vertical; in reality it is spread out over 2 steradians almost evenly (see above). Since we do not know the details of where in the sample the emission comes from, it is difficult to relate the contrast of the interference fringes to the linewidth of the radiation. Thus, while the presence of fringes indicates a component of the emission is monochromatic, it does not uniquely determine its linewidth, nor the amount of incoherent broadband radiation. The fringe pattern did not vary strongly with the mobility of the emitter sample ( vs. ), suggesting that the “contrast” of the interference fringes is not a good measure of the emission linewidth.
E Chopping technique
In contrast to most C.R. emission experiments, we run our sources quasi-continuous, and not pulsed, and still find reasonably narrow linewidth compared to the results found in the literature. This an important point if one wants to use this technique with ultimate state-of-the-art low-noise detectors. Fast detectors used for pulsed measurement typically have NEPs of [25, 26]. With the output power of our source in the 10-100 pW range, this gives limited signal to noise. Recent progress on ultra-low noise detectors for measuring the cosmic microwave background have achieved NEPs of 2 10[14] at an operating temperature of 100 mK. Although ultra-sensitive, they have time constants (typically 10 ms) that do not allow for pulsed operation. Thus, our quasi-continuous technique is important if those ultra-low noise detectors are to be used.
Initial work on fast low noise detectors based on lithographically fabricated hot-electron “microbolometers” began in the late 1980s[27]. In a later variant of the idea[28], electrical NEPs of with a response time constant of 10 s were measured. If these could be antenna coupled, they would make fast, sensitive detectors. This would obviate the need for the low chopping frequencies described in this paper. This general line of investigation is currently being pursued by several groups in order to demonstrate optical NEPs in that range or better with fast response time[16, 17, 29, 30]. Nonetheless, our results show that the development of fast, sensitive detectors is not a necessity for the technique described herein. Current state-of-the-are ultra-sensitive bolometer technology can be used without a degradation in the performance (i.e. linewidth) of the spectrometer due to the low chopping frequency.
III THz Transmission Spectrometer
A Principle of operation
In principle, our technique is simple and straightforward. The frequency of the source is tuned by its local magnetic field, and the light is guided through the sample and onto the detector. One can sweep the source frequency by sweeping its magnetic field; the power measured on the detector is a direct measure of the transmission through the sample at each frequency. An alternative mode of operation is to fix the source frequency (by fixing it’s local magnetic field) and sweep some sample parameter, to determine the transmission at a fixed frequency vs. the sample parameter. We discuss this in more detail in the next section.
B Demonstration of operation
We have carried out a demonstration experiment to measure the transmission through another 2DEG at a fixed frequency as a function of magnetic field at the sample. For a 2DEG in a magnetic field, absorption of THz photons occurs only if photon energy matches the cyclotron energy, . Thus, as a function of frequency of the emitter (or magnetic field of the sample as realized here), the transmission is unity (neglecting the vacuum-dielectric mismatch) off resonance, and minimum on resonance. If the light is randomly polarized, the absorption coefficient depends on the sample mobility and density. The transmission minimum is limited theoretically to 50%, although weaker absorption is usually observed.
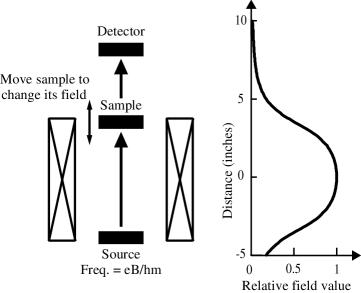
In our spectrometer, the light from the emitter passes through a ” diameter light pipe for about 3”, and is then passed through a 3 degree cone onto the transmission sample through a 1/8” hole, and then through another ” light pipe onto the detector. Instead of using two separate magnets, one to set the emitter frequency and one to set the sample magnetic field, we use a one-magnet setup indicated schematically in figure 3. By fixing the current through the superconducting magnet, we fix the magnetic field at the source and hence the emission frequency. (The emitter is located towards the bottom of the magnet at the 55 % field region.) We then monitor the detector voltage while sweeping the magnetic field at the sample; this is accomplished by physically moving the sample in the region where the field strength varies with position. The field profile is shown in figure 3; by moving the sample up and down two inches, we can vary the sample magnetic field from 25% to 75% of the value at the field center. With a 9 T superconducting magnet, we can achieve a maximum field of 5 T at the emitter, corresponding to a maximum emission frequency of 65 cm-1.
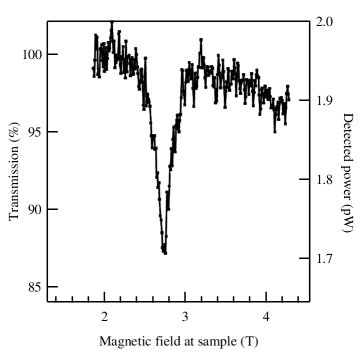
We plot in figure 4 the measured transmission coefficient as a function of sample magnetic field. The right axis is the measured power on the detector; the emitter frequency is fixed at 1.1 THz. We find a Lorentzian resonance with a FWHM linewidth of 0.26 Tesla (2.7 cm-1) for this sample (). On another sample with somewhat higher mobility (), we measure a linewidth of roughly 0.2 Tesla (1.8 cm-1). We conclude from this that the emitter linewidth is no broader than 1.8 cm-1; otherwise the sharp absorption feature in figure 4 would not be seen.
It is possible that there is a spectral component of the emitted power which is broadly distributed away from . From the measurement described, we can set an upper limit on the amount of this component. Since the absorption for randomly polarized light is at most 50% and our absorption dip is about 10%, we conclude that at most 80% of the emitted power of the source is off resonance; and that at least 20% power is concentrated in the spectral region around . However, this is only an upper limit on the out of band emission because we have not independently measured the transmission of our sample; if the true sample absorption is less than the theoretical limit of 50% on resonance, then the background component of the emission is less than 80%.
The linewidth of cyclotron resonance absorption in high mobility 2DEGs has been studied for many years by many groups. A very typical feature is that the linewidth varies periodically with filling factor , and that the linewidth is an absolute maximum at filling factor 2. Our measurements presented here are near , so that our measurement of the spectral resolution is probably an upper limit on the ultimate attainable spectral resolution using this technique.
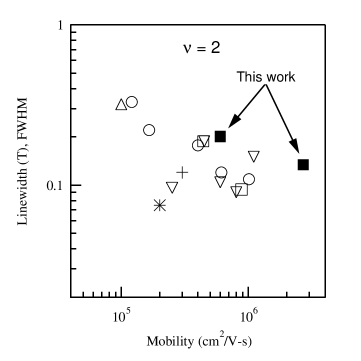
In figure 6, we plot the measured linewidth vs. sample mobility at a filling factor of , as well as several measured values from the literature[31, 32, 33, 34, 35, 36]. The temperature for the references varied between 1.3 K and 5 K. The linewidths we measure are comparable to those measured by other groups, suggesting that our emitter linewidth is narrow enough to measure roughly the correct value for the transmission linewidth.
We have also measured the transmission through the sample off of the resonant absorption as a function of source frequency. We find roughly unity transmission off resonance. We have also carried out this swept frequency transmission measurement though a blank sample (containing no 2DEG) of GaAs. In either case, we do not observe any Fabry-Perot fringes due to the finite (transmitting) sample thickness, even though the sample is not wedged. We conclude from this that the incoming radiation is equally distributed as a function of angle of incidence. This is an added advantage of this technique; the transmission samples do not need to be wedged.
Finally, even though the emitter must be placed in a magnetic field, many dilution refrigerators have compensating coils to minimize the magnetic field at the mixing chamber. By placing the transmission sample and detector near this compensated region, the technique described here can be applied to systems in low magnetic fields as well.
C Ultimate sensitivity limits
Based on the noise of our detector, we can measure the power transmitted through the sample with a statistical uncertainty of roughly 0.5 pW in a one second integration time. In figure 4, the transmitted power is roughly 2 pW off resonance; we used an equivalent noise bandwidth of approximately 1 mHz for that measurement. The statistical error on each transmission measurement point is thus about 1 %. This noise performance is clearly marginal, and underscores the need for lower noise detector technology. If the spectrometer described in this paper were to be incorporated into a low temperature environment, low-noise state of the art bolometers[14] with NEPs of as low as 2 10 could be used. This would allow for a much better measurement of the transmission coefficient, with a statistical uncertainty of 10-5 %, given the power levels we use.
For a given statistical uncertainty in the measured transmission coefficient at each frequency, we can predict the statistical uncertainty on the measured linewidth and line position for a Lorentzian absorption profile. Based on numerical simulations of typical experimental parameters, we find a statistical uncertainty in the measured linewidth of roughly 25 Gauss (or 1 GHz in frequency) per 1% error in measured transmission coefficient, and roughly 2.5 Gauss (0.1 GHz) in the measured position per 1% error in measured transmission coefficient. With a detector with NEP of 2 10, we could determine the linewidth and center frequency with a statistical uncertainty of order 1 kHz. We note that if this technique were used on samples with narrower absorption features than the emitter linewidth, it would not be possible to determine the shape of those absorption feature. However, it would be possible to determine the position (in frequency or magnetic field) of the absorption feature to a precision much better than the emitter linewidth.
Recent work on THz detectors has demonstrated single-photon sensitivity[15] with unknown quantum-efficiency and proposals exist[16, 17] for single-photon sensitivity with excellent predicted quantum efficiency. These detectors must be operated in an ultra-low temperature environment which is very compatible with the spectrometer presented here. We now consider the ultimate limits of the spectrometer developed here if single photon THz detectors were to be used.
At low (dilution refrigerator) temperatures, the thermal background of THz photons is negligible. Therefore, the statistical uncertainty in the measured signal would be limited only by the “shot” noise of the incoming photons. Roughly photons/second are generated in a 1 pW beam. For classical statistics, the fluctuations are photons/second, i.e. W; for quantum statistics the fluctuations can be lower or higher, corresponding to bunching or antibunching[37]. Generally, the statistics of the radiation depends on the emission process. To our knowledge this has not been investigated (either theoretically or experimentally) in cyclotron resonance emission. These calculations suggest that perfect (noiseless) THz detectors would not significantly improve the noise performance of our spectrometer, as compared to state-of-the-art low noise detectors with NEPs of 2 10, since the statistics of the signal dominate the noise performance. However, the ultimate limit of a few photons emitted per second with a single photon THz detector, where the photons interact with a quantum system of interest between the source and detector, may give experimentalists new tools to explore quantum information processing in condensed matter systems[38, 39].
IV Conclusions
Using a 2DEG as a cyclotron resonance source, we have developed an all-cryogenic THz transmission spectrometer for the spectral range of 2-65 cm-1, with a spectral resolution of at least 1.8 cm-1. Since a broadband detector is used, the entire frequency range can be accessed by the single sweep of the magnetic field at the emitter. Additionally, we have demonstrated that a low chopping frequency does not degrade the emission linewidth; this is important for future use with ultra-low noise detectors. The spectrometer was demonstrated by measuring the THz transmission through another 2DEG as a function of magnetic field of the 2DEG.
V Acknowledgements
This work was supported by Sandia National Labs Grant No. DE-AC04-AL85000 and DOE Grant No. DE-FG03-99ER45766. One of the authors (P.J.B.) was supported in part by the Sherman Fairchild Foundation.
REFERENCES
- [1] A. Mittal et al., Surface Science 362, 537 (1996).
- [2] J. Bock and A. Lange, Applied Optics 34, 7254 (1995).
- [3] E. Gornik, in Narrow Gap Semiconductors Physics and Applications, Vol. 133 of Lecture Notes in Physics, edited by W. Zawadzki (Springer-Verlag, Berlin, 1980), pp. 160–175.
- [4] W. Knap et al., Review of Scientific Instruments 63, 3293 (1992).
- [5] E. Gornik et al., Solid State Communications 38, 541 (1981).
- [6] E. Gornik et al., Solid State Communications 196, 339 (1984).
- [7] W. Seidenbusch, Physical Review B 36, 1877 (1987).
- [8] E. Gornik, W. Seidenbusch, and R. Lassnig, in Two-Dimensional systems, heterostructures, and superlattices, edited by G. Bauer, F. Kuchar, and H. Heinrich (Springer-Verlag, Berlin, 1984), pp. 60–68.
- [9] K. von Klitzing et al., in Proceedings of the International Conference on the Physics of Semiconductors, San Fransisco, 1984, edited by J. Chadi and W. Harrison (Springer-Verlag, ADDRESS, 1985), pp. 271–274.
- [10] E. Diessel, H. Sigg, and K. von Klitzing, Infrared Physics 32, 69 (1991).
- [11] C. Chaubet et al., Semiconductor Science and Technology 6, 160 (1991).
- [12] W. Zawadzki et al., Semiconductor Science and Technology 9, 320 (1994).
- [13] N. Zinovev, R. Fletcher, and L. Challis, Physical Review B 49, 14466 (1994).
- [14] J. Bock et al., Proceedings of the SPIE 3357, 297 (1998).
- [15] S. Komiyama et al., Nature 403, 405 (2000).
- [16] R. Schoelkopf et al., IEEE Transactions on Applied Superconductivity 9, 2935 (1999).
- [17] B. Karasik, W. McGrath, M. Gershenson, and A. Sergeev, Journal of Applied Physics 87, 7586 (2000).
- [18] S. Komiyama et al., in Proceedings of the 6th International Symposium ”Nanostructures: Physics and Technology”, edited by Z. Alferov and L. Esaki (Ioffe Institute, St. Petersburg, 1998), pp. 140–147.
- [19] Y. Kawano and S. Komiyama, Physical Review B 61, 2931 (2000).
- [20] Y. Kawano, Y. Hisanaga, and S. Komiyama, Physical Review B 59, 12537 (1999).
- [21] Haller-Beeman Assoc. Inc., El Sobrante, CA.
- [22] N. Nishioka, P. Richards, and D. Woody, Applied Optics 19, 1562 (1978).
- [23] R. Datla, E. Grossman, and M. Hobish, Journal of Research of the National Institute of Standards and Technology 100, 717 (1995).
- [24] The bolometer we used had normal metal (0.0005” diameter) brass leads for the electrical readout. If superconducting electrical leads would have been used, a lower NEP could have been achieved. We chose normal metal leads for this prototype experiment because we did not use a compensating coil at the detector to null the magnetic field; stray magnetic fields at the detector could have affected its responsivity if we used superconducting leads.
- [25] E. Brown, M. Wengler, and T. Phillips, Journal of Applied Physics 58, 2051 (1985).
- [26] G. Strasser, K. Bochter, M. Witzany, and E. Gornik, Infrared Physics 32, 439 (1991).
- [27] E. M. Gershenzon et al., Pis’ma Zh. Tekh. Fiz. .
- [28] M. Nahum and J. Martinis, Applied Physics Letters 63, 3075 (1993).
- [29] C. Cates et al., Physica E 2, 463 (1998).
- [30] J. Hergenrother, J. Lu, and M. Tinkham, IEEE Transactions on Applied Superconductivity 5, 2604 (1995).
- [31] Z. Schlesinger et al., Physical Review B 30, 435 (1984).
- [32] W. Seidenbusch, E. Gornik, and G. Weimann, Physical Review B 36, 9155 (1987).
- [33] E. Batke, H. Störmer, and A. Gossard, Physical Review B 37, 3093 (1988).
- [34] R. Nicholas et al., Physical Review B 39, 10955 (1989).
- [35] T. Englert et al., Solid State Communications 46, 545 (1983).
- [36] R. Heron et al., Semiconductor Science and Technology 15, 589 (2000).
- [37] L. Mandel and E. Wolf, Optical Coherence and Quantum Optics (Cambridge University Press, Cambridge, 1995).
- [38] M. Sherwin, A. Imamoglu, and T. Montroy, Physical Review A 60, 3508 (1999).
- [39] B. Cole et al., Nature 410, 60 (2001).