SLAC–PUB–8872
June 2001
NLC Beam Properties and Extraction Line Performance
with Beam Offset at IP 111Work supported by Department of Energy contract DE–AC03–76SF00515.
Y. Nosochkov, T.O. Raubenheimer and K.A. Thompson
Stanford Linear Accelerator Center, Stanford University,
Stanford, CA 94309
Abstract
Properties of the disrupted NLC beam at the Interaction Point (IP) and particle loss in the extraction line are analyzed as a function of beam-to-beam position and angular offset at IP. The simulations show that disruption and beam loss maximize when the vertical beam separation at IP is about 20 times the rms vertical beam size. The horizontal offset does not increase the disruption and the beam loss. The angular offsets cause particle loss in the extraction line mainly because of the beam orbit oscillations.
Presented at the 2001 Particle Accelerator Conference
(PAC 2001)
Chicago, Illinois, June 18–22, 2001
NLC BEAM PROPERTIES AND EXTRACTION LINE PERFORMANCE
WITH BEAM OFFSET AT IP ††thanks: Work supported by Department of Energy contract
DE–AC03–76SF00515.
Abstract
Properties of the disrupted NLC beam at the Interaction Point (IP) and particle loss in the extraction line are analyzed as a function of beam-to-beam position and angular offset at IP. The simulations show that disruption and beam loss maximize when the vertical beam separation at IP is about 20 times the rms vertical beam size. The horizontal offset does not increase the disruption and the beam loss. The angular offsets cause particle loss in the extraction line mainly because of the beam orbit oscillations.
1 Introduction
In the NLC [1], the strong beam-beam interaction significantly distorts beam distribution at IP. This effect, called disruption [2], increases the beam emittance and angular divergence after collision and generates a huge energy spread in the outgoing beam. The NLC extraction line was designed to minimize particle loss caused by these effects [3, 4].
So far, the NLC beam disruption and extraction line performance were studied for the ideal beam conditions at the IP. However, various incoming beam errors may affect the beam-beam interaction and the resultant disrupted distribution. In this paper, we discuss the effects of beam-to-beam transverse position and angular offsets at IP on the beam distribution and particle loss in the extraction line.
Beam-beam effects such as energy loss due to beamstrahlung occur as particles in each bunch go through the strong coherent field of the other bunch. When the beams are vertically flat, as they are in NLC, the beamstrahlung can be enhanced significantly for some vertical position and angle offsets, because the field seen by the bulk of the particles in one beam increases as the offset from the other beam increases. Of course, the field seen by each beam eventually falls off when position offsets become large enough. The interaction is further complicated by the fact that the two beams distort each other’s shape during the collision. Thus we resort to numerical simulations, where care must be taken in choosing the grids to perform beam-beam calculations as accurately as possible.
The beam parameters for the NLC design can be found in Ref. [1]. In this study, we used the Stage 1 parameters where the center-of-mass energy is 500 GeV; the IP parameters listed in Tables 1 and 2, where is the beam emittance, the beam size, and angular divergence in the horizontal and vertical plane, respectively. The listed parameters are for ideal IP conditions and zero initial energy spread. The realistic incoming energy spread is about , but it is negligible compared to the disrupted energy spread and does not affect the results of this study.
| Energy cms [GeV] | 500 |
| Luminosity [] | 22 |
| Repetition rate [Hz] | 120 |
| Bunch charge [] | 0.75 |
| Bunches/RF-pulse | 190 |
| Bunch separation [ns] | 1.4 |
| Eff. gradient [MV/m] | 48 |
| Inject. [ m-rad] | 300 / 2 |
| Bunch length [m] | 110 |
| 0.11 | |
| Pinch enhancement | 1.43 |
| Beamstrahlung [%] | 4.6 |
| Photons per | 1.17 |
| Two linac length [km] | 6.3 |
| before | after | |
|---|---|---|
| [ m-rad] | 360 / 3.5 | 1175 / 7.2 |
| [mm] | 8 / 0.1 | 2.44 / 0.14 |
| 0 / 0 | 1.852 / 0.675 | |
| [nm] | 245 / 2.7 | 245 / 4.6 |
| [rad] | 31 / 27 | 211 / 39 |
2 SIMULATIONS
In the study, the undisrupted beam parameters in Tables 1,2 were used as the input data for GUINEA–PIG code [5] to generate the incoming gaussian beams, simulate beam-beam interaction and obtain disrupted distribution at the IP. Some of the disrupted beam parameters for particles are shown in Table 2 (after collision), where the disrupted values of , and were derived from the beam distribution. The disruption significantly increases beam emittance and angular divergence and generates huge energy spread with low energy tail up to %.
The disrupted beam was then tracked from IP to the dump to compute particle loss in the extraction line. Only the primary beam particles were used in this simulation. The tracking was performed using the NLC version of DIMAD code [6] which correctly accounts for very large energy errors present in the NLC disrupted beam.
The extraction line optics used in this study is described in Ref. [4]. It consists of two multi-quadrupole systems separated by a four bend chicane with 2 cm vertical dispersion. The effects of 6 T detector solenoid were included, but no magnet errors were used.
3 POSITION OFFSET AT IP
To generate disrupted beam distributions for various values of beam-to-beam offset at IP, the colliding beams were symmetrically and oppositely displaced at IP by half of the total offset or , in the GUINEA–PIG simulations. The resultant distributions with particles were tracked in the extraction line to compute a beam loss.
For , the disrupted parameters are already given in Table 2. As the beam offset increases, the disrupted distribution should eventually converge to the incoming beam distribution since less interaction takes place, however, at very large offsets the beam loss in the extraction line may be caused by the large incoming orbit.
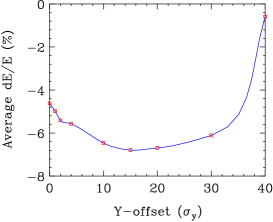
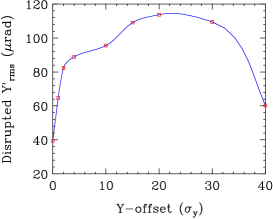
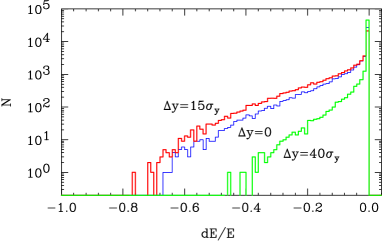
A summary of disrupted beam parameters for various beam offsets at IP are given in Table 3 where are the undisrupted beam size at IP. One can see that -offset gradually reduces the beam disruption, but the -offset initially increases the energy spread, the vertical beam size and the divergence. The disruption maximizes at 15 to 20, but the maximums are rather broad as shown in Fig. 1 and 2. Analysis of distributions in Table 3 shows that vertical emittance is blown up more than ten times at . A comparison of the energy spread at , and is shown in Fig. 3.
| Offset | |||||||
|---|---|---|---|---|---|---|---|
| [nm] | [rad] | [nm] | [rad] | [%] | [%] | ||
| 0 | 244.7 | 210.8 | 4.63 | 39.4 | -4.62 | 8.13 | |
| 1 | 244.9 | 157.7 | 4.35 | 36.9 | -4.25 | 7.71 | |
| 2 | 246.5 | 90.4 | 3.60 | 32.0 | -3.13 | 6.39 | |
| 4 | 243.0 | 62.7 | 2.75 | 27.4 | -0.78 | 2.66 | |
| 1 | 245.9 | 206.8 | 8.22 | 64.6 | -4.98 | 8.43 | |
| 4 | 245.7 | 192.4 | 11.91 | 88.9 | -5.57 | 9.06 | |
| 10 | 246.5 | 202.3 | 14.91 | 95.6 | -6.46 | 9.89 | |
| 15 | 244.6 | 196.0 | 16.23 | 109.1 | -6.79 | 10.13 | |
| 20 | 244.7 | 187.1 | 17.27 | 113.8 | -6.69 | 10.05 | |
| 30 | 245.1 | 167.8 | 17.27 | 109.5 | -6.11 | 9.50 | |
| 40 | 244.9 | 48.4 | 4.94 | 60.3 | -0.59 | 2.49 | |
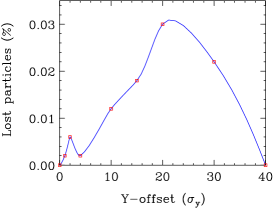
As a result of the increased energy spread and vertical beam size, one can expect higher beam loss in the extraction line for offsets near 15 to 20. The results of particle loss versus -offset are shown in Fig. 4. The maximum loss occurs at and amounts to 0.7 kW of power loss with 15 lost particles out of in tracking. Some irregularities in Fig. 4 are due to low statistics of the lost particles. As expected, tracking with the horizontal IP offsets showed no particle loss.
More detailed analysis of the beam loss with offset revealed that all of the particles except one were lost in the vertical plane. This indicates that the blow up of vertical emittance may be the source of the particle loss.
Our expectation is that the power loss caused by IP offset, even at the maximum value of 0.7 kW, can be safely disposed. In practice, the losses should be much lower since the beam offset will be controlled at the level of for a maximum luminosity. We expect that with such control of the vertical offsets the power loss will be on the order of 0.05 kW for the Stage 1 parameters.
4 ANGULAR OFFSET AT IP
Disrupted beam distributions with angular offset at IP were generated in the GUINEA–PIG code by changing the nominal initial angle at IP by or in the two beams. The resultant distributions of particles were then tracked in the extraction line.
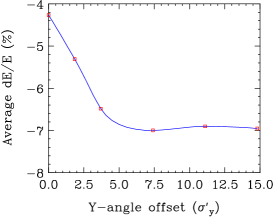
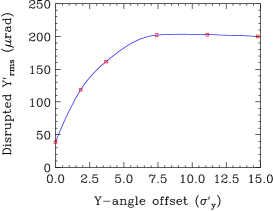
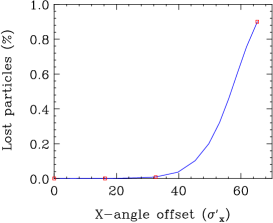
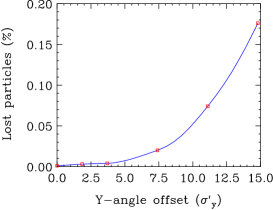
As in the case of IP position offset, a vertical angular offset results in somewhat increased beam energy spread and vertical divergence at IP as shown in Fig. 5 and 6, while the effect of a horizontal angle is small. Note that angular offset in Fig. 5 and 6 is normalized to , the undisrupted initial divergence at IP. Particle tracking in the extraction line showed, however, that large offset angles have much stronger effect on the beam loss than the position offset. The particle loss versus and is shown in Fig. 7 and 8. The large particle losses are caused by the increased beam orbit oscillations in the extraction line proportional to the IP angular offsets.
For a beam power loss below 1 kW at a center-of-mass energy of 500 GeV, the particle loss needs to be lower than 0.05%. According to Fig. 7 and 8, the corresponding maximum full angular offsets are about 40 (1.2 mrad) and 10 (0.25 mrad) for and planes, respectively. Note that the beam loss is strongly reduced at smaller angles. However, to avoid unnecessary large beam loss, the angular offsets should be kept well below the above tolerances.
5 CONCLUSION
The beam position and angular offsets at IP may increase the beam disruption. For the Stage 1 (500 GeV cms) NLC parameters, the beam vertical offset may result in up to 0.7 kW beam loss in the extraction line. In practice, the losses will be much lower for reasonably controlled IP beam positions. The angular offsets should be kept lower than 40 (1.2 mrad) and 10 (0.25 mrad) in and planes for a power loss below 1 kW.
References
- [1] http://www-project.slac.stanford.edu/lc/ and 2001 Report on the Next Linear Collider, SLAC–Report–571, Fermi–Conf–01/075–E, LBNL–Pub–47935, UCRL–ID–144077 (2001).
- [2] R. Hollebeek, NIM, 184, p. 333 (1981).
- [3] Y. Nosochkov, et al., SLAC–PUB–8096 (1999).
- [4] Y.M. Nosochkov and T.O. Raubenheimer, SLAC–PUB–8313 and LCC–0034 (1999).
- [5] D. Schulte, TESLA–97–08 (1996).
- [6] P. Tenenbaum, et al., SLAC–PUB–8136 (1999).