SLAC–PUB–8871
June 2001
Study of Beam Energy Spectrum Measurement
in the NLC Extraction Line 111Work supported by Department of Energy contract DE–AC03–76SF00515.
Y. Nosochkov and T.O. Raubenheimer
Stanford Linear Accelerator Center, Stanford University,
Stanford, CA 94309
Abstract
The NLC extraction line provides a secondary focal point with a low function and 2 cm dispersion which can be used for measurement of the beam energy spectrum. In this study, tracking simulations were performed to transport the 0.5 TeV electron beam from the Interaction Point (IP) to the secondary focus (SF), “measure” the resultant transverse beam profile and reconstruct the disrupted IP energy spread. In the simulation, the obtained energy spectrum reproduced the initial IP spread reasonably well, especially with the vertical dispersion at SF which provides larger ratio of dispersion to the betatron beam size. More details of this study can be found in Ref. [1].
Presented at the 2001 Particle Accelerator Conference
(PAC 2001)
Chicago, Illinois, June 18–22, 2001
STUDY OF BEAM ENERGY SPECTRUM MEASUREMENT
IN THE NLC EXTRACTION LINE ††thanks: Work supported by Department of Energy contract
DE–AC03–76SF00515.
Abstract
The NLC extraction line provides a secondary focal point with a low function and 2 cm dispersion which can be used for measurement of the beam energy spectrum. In this study, tracking simulations were performed to transport the 0.5 TeV electron beam from the Interaction Point (IP) to the secondary focus (SF), “measure” the resultant transverse beam profile and reconstruct the disrupted IP energy spread. In the simulation, the obtained energy spectrum reproduced the initial IP spread reasonably well, especially with the vertical dispersion at SF which provides larger ratio of dispersion to the betatron beam size. More details of this study can be found in Ref. [1].
1 INTRODUCTION
In a linear collider, the strong beam-beam interaction generates significant beamstrahlung. For the high-energy physics experiment to make optimal use of the luminosity, it is important to know the luminosity spectrum. This is done in the NLC design by measuring the energy spectrum of the disrupted beam in the beam extraction line which transports the beam from the IP to the beam dump.
The present design of the NLC extraction line optics [2, 3] is shown in Fig. 1, where the beam travels from the IP (on the left) to the dump. The optics contains two multi-quadrupole systems, where the first system performs a point-to-point focusing from the IP to a secondary focus (SF), and the second system generates a parallel beam at the dump. Between the two quadrupole sets there is a symmetric four bend chicane generating 2 cm displacement and dispersion at the SF.
To accurately measure the energy spectrum of the disrupted beam, the dispersive beam size should be large compared to the betatron beam size . The original optics was designed with the horizontal chicane as shown in Fig. 1, but vertical bends may be used as suggested by K. Kubo of KEK [4] to improve the resolution.
The on-energy functions at the SF can be derived from the IP values and linear matrix between IP and SF:
| (1) |
In this study, we used one particular set of the NLC beam parameters [5] listed in Table 1. These parameters correspond to the disrupted 0.5 TeV beam at the IP. The beam disruption occurs in the collision and significantly increases the beam divergence, emittance and energy spread. The disrupted distribution at the IP was obtained using GUINEA–PIG code [6, 7], and the corresponding emittance and lattice functions were reconstructed from this distribution as shown in Table 1.

According to Eq. 1 and Table 1, for a fixed 2 cm dispersion, optics with the vertical chicane provides a larger ratio of the dispersion to the same plane betatron size at the SF, and therefore should result in better accuracy in the energy spectrum measurement. Note, that at SF can grow significantly with due to the shift of waist.
Below we compare tracking and measurement simulations for the extraction line with the horizontal and vertical 2 cm chicane. The particle tracking was done using a version of DIMAD code with accurate handling of large energy errors [8]. Effect of the corrected 6 T detector solenoid is included.
| Emittance, (mrad) [] | 120 / 1.02 |
|---|---|
| Beam size, (nm) | 198 / 3.2 |
| Divergence, (rad) | 125 / 33 |
| (mm) | 3.259 / 0.103 |
| 1.805 / 0.306 | |
| Energy per beam (GeV) | 523 |
| Particles per bunch | |
| Bunches per train | 95 |
| Repetition rate (Hz) | 120 |
| Disruption parameter, | 0.094 / 6.9 |
| Average energy loss per particle | 9.5% |
2 SIMULATIONS
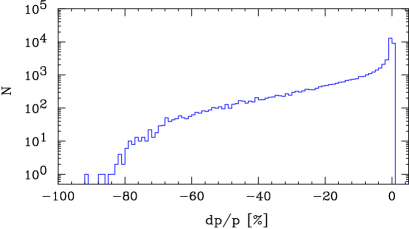
The GUINEA–PIG code was used to generate macro-particles to represent the disrupted distribution at the IP. As shown in Fig. 2, this distribution has a huge energy spread. The disrupted beam then was tracked to the secondary focus using DIMAD.
The small betatron beam size and non-zero dispersion at the SF result in a significant correlation between a particle transverse position (or for vertical ) and energy. This makes it possible to reconstruct the beam energy spectrum based on the beam profile measurement at the secondary focus. Neglecting synchrotron radiation, a particle coming into chicane on axis will have a transverse deflection
| (2) |
at the secondary focus. Equation 2 can be used to estimate the particle energy deviation based on measured (or ) and known at the secondary focus:
| (3) |
Using Eq. 3, one can also convert measured beam profile into the energy spectrum . Equation 3 is only correct if is constant and the deflections are caused entirely by dispersion. In reality, several other factors contribute to particle position at the secondary focus:
-
•
Betatron motion .
-
•
Synchrotron radiation causing random energy loss.
-
•
Quadrupole misalignment and bending field errors.
-
•
Incoming beam offsets , at the IP.
Measurement errors have to be taken into account as well. Denoting the above contributions as , particle deflection at the SF can be expressed as . Clearly, an accurate estimate of in Eq. 3 requires that .
2.1 Energy Resolution Analysis
To verify the actual dependence of particle positions on energy, the disrupted beam of particles was tracked from IP to SF. The simulation included synchrotron radiation effects, but no magnet errors were used. The resultant and distributions versus at the SF are shown in Fig. 3 for 2 cm horizontal and vertical chicane, respectively. The solid line in Fig. 3 is the analytic displacement in Eq. 2, and is the initial energy error at the IP. Note that synchrotron radiation between IP and SF reduces average particle at the SF by compared to IP .
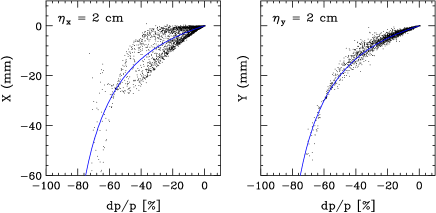
As shown in Fig. 3, the particle spread versus is wider in optics with the horizontal chicane due to a larger . Therefore, the reconstruction of beam energy spectrum based on beam profile measurement should be more accurate with the vertical chicane where the dispersive contribution (Eq. 2) is dominant.
The energy resolution can be also examined using analysis suggested by Kubo [4]. In this method, the simulated beam at SF is divided into almost monoenergetic slices with different energy which are then evaluated in terms of and size, position and orientation. Fig. 4 and 5 show these slices at different in the form of one sigma ellipses on the - plane. Clearly, the resolution between the slices is better in the vertical chicane optics.
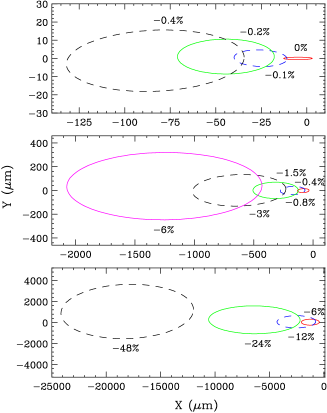
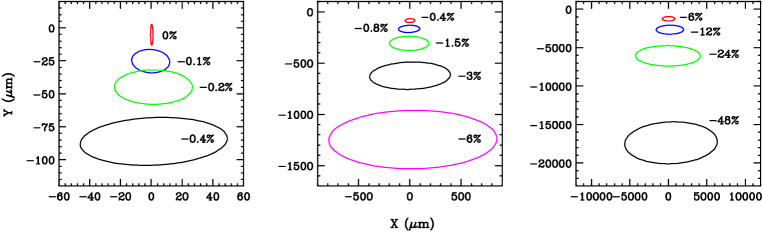
Note that the ellipse in Fig. 4 and 5 is the initial IP . Synchrotron radiation randomly reduces the energy which distorts particle deflections at the SF, but relatively it affects more the particles with . This results in a disproportionally wide ellipse in the direction of dispersion at . This effect is negligible for .
Further analysis [1] shows that the ellipse size at SF is approximately proportional to , which can be interpreted as , and that this dependence mostly comes from the shift of waist. Analysis of the ellipse size and position shows that the ratio of an average particle displacement at SF to the beam size as a function of is almost a factor of 3 larger with the vertical dispersion, and therefore is better for energy resolution.
2.2 Energy Spectrum Measurement
In the simulation, the beam profile measurement at the secondary focus was done using 50 m steps over the range of 25 mm in the direction of dispersion to simulate a wire scanner. The particles were collected for each of the 50 m bins ( or ), and the beam profile histogram was generated, where is the number of particles per bin. The range beyond 25 mm was not considered due to low statistics, and no measurement errors were included.
The beam energy spectrum can be obtained from the profile by converting the (or ) bins into bins. According to Eq. 3, the width of -bin varies with as
| (4) |
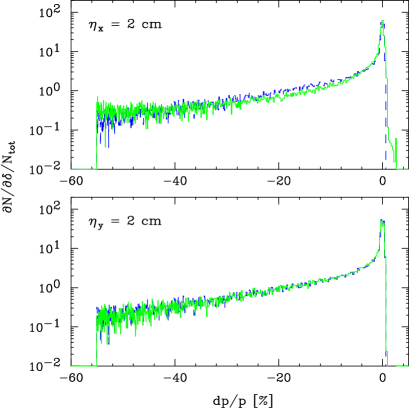
where m is the (or ) bin width. At 2 cm dispersion, the width gradually reduces from 0.25% at to 0.05% at -25 mm. To avoid dependence on the bin width, we normalized to the corresponding width . For a more general result, we also normalized to the total number of particles in the histogram. The resultant energy distribution was compared with the initial spectrum at the IP. Both histograms are shown in Fig. 6 for the horizontal and vertical chicane, where the blue line (darker shade) is for the original IP spectrum and the green line for the “measured” spectrum at SF. The range in Fig. 6 is limited at about due to 25 mm range used in the beam profile measurement.
Comparison of the histograms in Fig. 6 shows that optics with the vertical chicane provides a more accurate reconstruction of the initial IP energy spectrum. A closer view shows that the vertical measurement even reproduces the incoming double peak profile near , while the horizontal histogram is not accurate in this range. In the horizontal spectrum, there are some particles in range that are not present in the initial IP distribution. This is the result of larger horizontal betatron oscillations which are interpreted as positive in Eq. 3. This effect, though, is somewhat exaggerated in Fig. 6 due to logarithmic scale.
The most uncertainties in the measured energy spectrum appear near and at the very low energy tail. At small , the Eq. 3 may be not accurate due to relatively large betatron oscillations and effects of synchrotron radiation energy loss. At the very low energies, accuracy is reduced due to low statistics in the beam tail and smaller width. According to Eq. 4, one could obtain constant distribution for a beam profile measurement with .
3 CONCLUSION
Tracking simulations and beam analysis in the NLC extraction line show that a beam profile measurement at the secondary focus can be used to reconstruct the disrupted beam energy spectrum. Optics with the vertical chicane is preferred because of the smaller ratio of betatron size to dispersion and therefore better energy resolution.
References
- [1] Y. Nosochkov, et al., SLAC note LCC–0045 (2000).
- [2] Y. Nosochkov, et al., SLAC–PUB–8096 (1999).
- [3] Y.M. Nosochkov, et al., SLAC–PUB–8313 (1999).
- [4] K. Kubo, presented at ISG5 Workshop (2000).
- [5] K.A. Thompson, et al., SLAC note LCC–0014 (1999).
- [6] D. Schulte, TESLA–97–08 (1996).
- [7] K.A. Thompson, GUINEA–PIG simulations (2000).
- [8] P. Tenenbaum, et al., SLAC–PUB–8136 (1999).