The Electrochemical Reduction of Hydrogen in the Presence of Bisulfate on Platinum(111)
L. Blum,
Department of Physics, P.O. Box 23343,
University of Puerto Rico,
Rio Piedras, PR 00931-3343
and
Dale A. Huckaby,
Department of Chemistry,
Texas Christian University,
Fort Worth, TX 76129
Abstract
A new model for the intermediate compound of the hydrogen evolution reaction (HER) is proposed, for the electrochemical reduction of hydrogen in the presence of bisulfate on platinum(111). The formation of this compound, a regular 2 dimensional honeycomb ice lattice, occurs by a first order phase transitions that involves the reorientation of water molecules. The model is analyzed using new and simple effective cluster approach which highlights the relevant transitions in system. This method is based on the cluster variation method used successfully in our previous work on the UPD of Cu onto
Au(111), and permits us to explore a large region of parameter space, an essential feature to study this complex system. The theory makes full use of the properties of the diffuse layer: The water molecule is reoriented as the potential is changed. For positive potentials it forms linear chains which are responsible for the structure of the sulfate observed by STM. At negative potentials water turns so that its dipole points towards the Pt. Then it will form a regular honeycomb network of hydrogen
bonded molecules, with the sulfate at the center of the hexagons. Then the bisulfate is desorbed, leaving the honeycomb HER structure behind. Our model thus provides an explanation of the well known fact that only 2/3 of the Pt atoms participate in the electroreduction of the hydrogen. The theory implies geometrical constraints to the water potential: It should
be of tetrahedral coordination.
be analytical to be able to include the double layer effects, the ions and external fields, in the calculations.
The angular part of the potential must be relatively soft, since the angle O-H-O of
the hydrogen bond will be bent to keep the water near the metal surface.
The analytical tetrahedral Yukagua model of water satisfies all of these requirements.
1 Introduction
The underpotential deposition of hydrogen on platinum(111) in aqueous sulfuric acid was studied by Clavilier et al. using his pioneering techniques of preparing monocrystalline electrode
surfaces[1, 2].
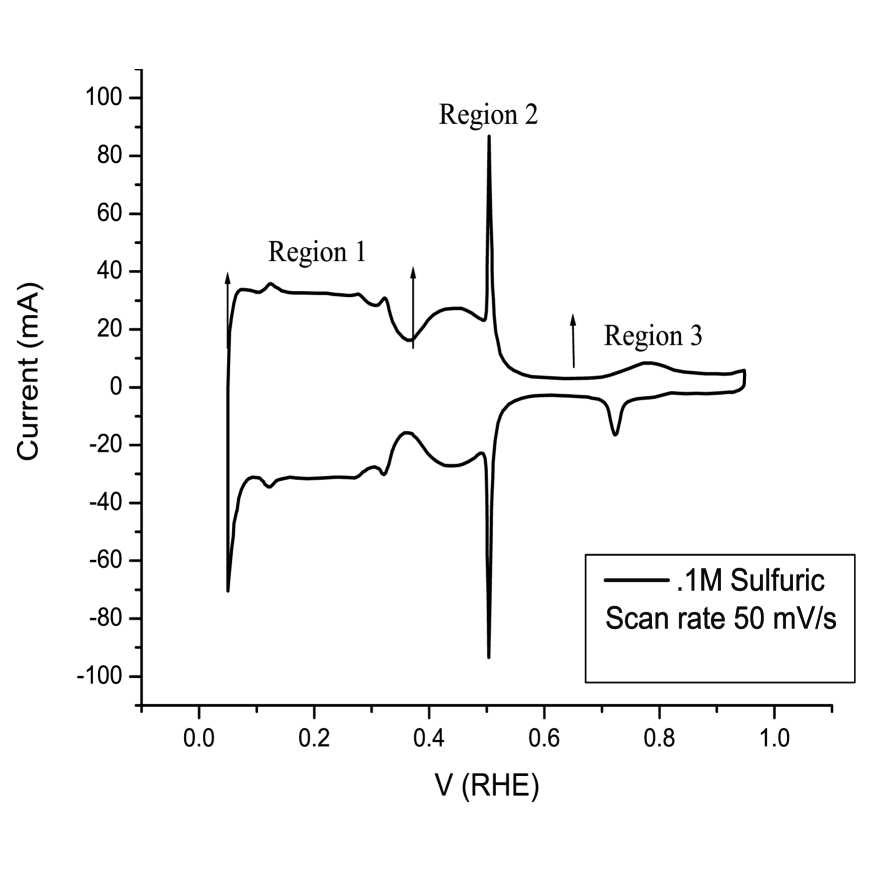
In Fig.1 1 we show a recent voltammogram for this system obtained by V. Climent [3] on a rather perfect single crystal. For our discussion we will divide this voltammogram in three regions:
-
1.
The H-UPD region: A new structure of the HER intermediate is proposed, which explains the observed 2/3 of a monolayer yield for this surface.
-
2.
the CP butterfly region: Here there are two distinct features, a sharp spike, which we identify with the formation of a lattice of water-like molecules, with its dipole pointing up.
-
3.
the positive region: In this region the structure is formed by ’polywater’ chains of water molecules with its dipole pointing down
We note that these steps are similar to the ones proposed by us for the UPD of Cu/Au(111)[4, 5, 6]: In reverse order:
- •
-
•
Region 2: The spike here is due to the co-adsorption of bisulfate and water, forming in fact the same honeycomb structure as in the Cu/Au(111) case. Now the sulfate simply leaves an empty site, while in the copper case it was replaced by a copper via a phase transition.
-
•
Region 1: In this region the transition is different because as the sulfate is desorbed, its site was filled by another atom of copper. In our present case, the hydrogen bond of the hexagons are saturated, and the sulfate is simply desorbed.
In section 2 we outline the basic formalism and our method of computing the fugacities of our active compounds. In section 3 we discuss the positive Region 3 of the voltammogram. In section 4 we present our model for the CP butterfly region, and finally in section 5 we discuss our model HER intermediate. In the final section we compare our resulting voltammogram to experiment.
2 BASIC FORMALISM
We use a microsopic model, based on the sticky site model (SSM) [12, 13, 14], in which the exact hamiltonian of the entire interface is projected onto an equivalent ’electrode’ surface lattice: This means that all solvation and double layer effects are included. For example, for dilute solutions such as the one of our present example the Gouy-Chapman approximation is quite accurate, as has been shown in previous work [6].
One of the problems in surface electrochemistry is the complexity of even seemingly simple systems, like the one of this paper. Even with modern day resources it is very difficult, if not outright impossible, to explore the parameter space of this problem by computer simulation. For this reason we have used the ’Cluster Variation Method (CVM)[15, 16, 17, 18, 19, 20] to calculate the adsorption isotherms and generated a voltammogram for the deposition of H on Pt(111) in the presence of 0.1 M aqueous sulfuric acid. In our our previous work on the UPD of Cu on Au(111)[6, 4, 5, 20] we used the ”cluster approximation”[20]. This method successfully predicted the local structure and transformations of the voltage dependent phases that were later observed.
For the UPD of hydrogen and the bisulfate anion we use
first a simplified version of this method, the PCVM ( PADE-CVM) approximation which further simplifies the calculations. This work will be described in a separate paper [21]
In our present work we will use a still simpler theory that we call the assymptotic cluster model (ACM), where the behavior of the model is described by a few assymptotically large diagrams which determine its transitions. The interaction parameters are obtained from theory or simulation.
The adsorption of species on the platinum surface primarily depend on the activities of these adsorbates and the lateral interactions existing between them[12, 13, 14]. The activity of a species is given by the product between a sticky parameter and the species contact density at the surface , as
| (1) |
The sticky parameter is a phenomenological parameter characterizing the quantum mechanical interaction between the adsorbate and surface, and will in general, be potential dependent. We write [20]
| (2) |
where is the elementary charge, is the partial charge of the adsorbate at the surface, and is a binding constant characterizing the overlap of electron orbitals between the adsorbate and surface atoms. The potential dependence of the contact density is given to a very good approximation by the Gouy-Chapman expression
| (3) |
where is the density at a smooth (i.e. without sticky sites) surface[14] with a potential of zero charge, and is the ionic charge of the adsorbate. It has been verified in previous work [6] that for our relatively dilute concentrations of sulfate ions this is a quite good approximation.
The potential dependence of the activity is then found to be
| (4) |
where is an effective electrovalence of species .
We obtain analytical expressions representing clusters of interacting adsorbates which are used to calculate the coverages of hydrogen and the bisulfate anion as a function of potential. The crucial parameters in our present theory are the water orientation and the bisulfate adsorption.
2.1 THE ADSORPTION AND ORIENTATION OF WATER AND (BI)SULFATE
We discuss first the potential dependent adsorption fugacities of bisulfate and water. In our model water is adsorbed on the atop position when its dipole is pointing down and in the hollow site when the dipole is up.
2.1.1 BISULFATE
The inner layer equivalent fugacity for the adsorption of the bisulfate is
| (5) |
where is the Boltzmann thermal factor, the electrosorption valency of the bisulfate is , and is the electrosorption reference potential, that depends on the nature of the substrate. The sticking coefficient can be interpreted as , with as the free energy change that occurs when a bisulfate ion binds to the metal surface. is the inner layer local density of bisulfate for a local potential , which is estimated from the Gouy-Chapman formula.
| (6) |
where we take
| (7) |
and the bisulfate fugacity is ()
| (8) |
The electrovalence is taken as .
2.1.2 WATER
For positive electrodes only the oxygen of the water molecule binds to the electrode metal atoms, since the strong electric field will orient the large dipole of the water molecule. The preferred position at positive potential bias is that of an inverted tripod, with two of the hydrogens pointing upwards. The adsorption fugacity of the ’oriented’ water can be written as
| (9) |
where is the density of water and the adsorption parameter is
| (10) |
Here is the orientation parameter of the water molecules in contact with the electrode, is the bulk density of water. We use the Gouy-Chapman theory to get the perpendicular component of the electric field at contact with the electrode
| (11) |
A simple estimate of the orientation parameter of the water molecules near a charged electrode, can be obtained using a suitably adapted form of the mean spherical model [22, 23, 24]:
| (12) |
To conform to the high coupling- low concentration limit we use the EXP approximation
| (13) |
The parameters in this equation are , the Debye Hueckel screening length, is the MSA screening length, , the dipole moment of water and , the diameter of the water molecule (2.8 angstrom). The polarization parameter is the MSA Wertheim parameter, obtained from
| (14) |
where is the dielectric constant of water, (78.4 at 298 oK), for which we get
From these we get for the dipole model
| (15) |
or
| (16) |
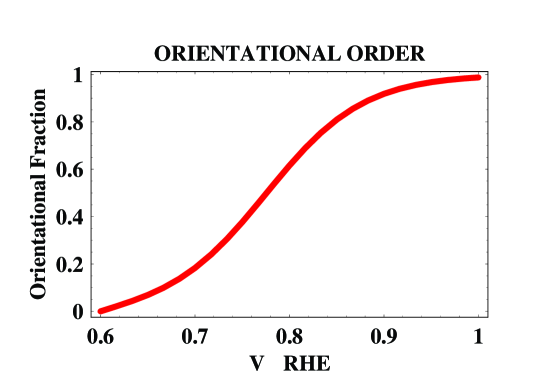
which is used in conjunction with Eq.(1) to compute the average orientation opf the water molecules. The results of this calculation are shown in Fig. 2(2), and the contribution to the differential capacitance (in region 3) are shown in Fig.3(3).
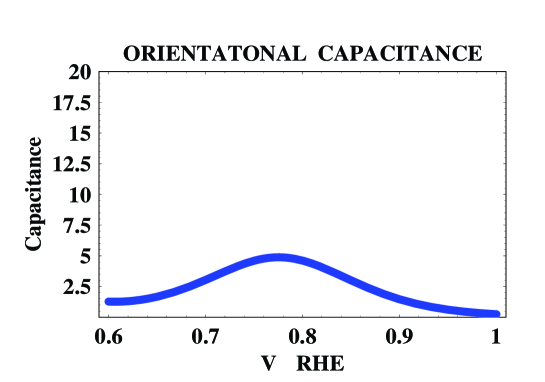
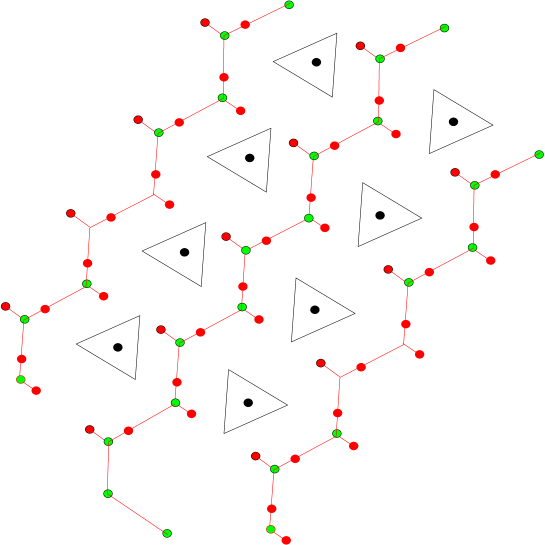
This procedure will be extended to include the full Yukagua model [25] in the future. We do not expect however large differences since the main term in the re-orientation hamiltonian is the dipolar one, and the predicted capacitance for region 3, obtained from this model agrees reasonably well with experiment. The chain structure is shown in Fig.4(4).
3 REGION 3: THE WATER CHAIN REGION
The STM structures seen in these systems in the positive end of the voltammogram by various authors [26, 27, 28], consists of elongated hexagons rather than regular hexagons. The elongated structures correspond to water coadsorption as was shown by Ito. More recent high resolution STM experiments [8, 9] have been interpreted as being the result of hydrogen bonded water chains. However, the structures that are proposed are unstable in the presence of the high field gradients [29] of the electric double layer, since the dipoles are alternated in order to keep the hydrogen bond straight. A different model is proposed in this paper in which all dipoles are polarized the same way. However this requires bending of the hydrogen bond. Our point here is that this is actually the case, even in normal ice Ih [30], and very clearly in liquid water [25]. This model also explains why when the polarity is changed, those chains no longer exist and the regular hexagons are observed [4, 6]. The details of this model, as well as its consequences will be discussed in a separate paper [10, 11]
The formation of water hydrogen bonded chains occurs because the properly oriented water molecules form hydrogen bonds with the lone pair and one of the two hydrogens of the ’upper’ plane. In principle any of the two can form the next bond, and therefore the ’water chain’ chain will consist of units forming an angle of 142o to 152o instead of the straight 180o, and the ’free’ hydrogen will be pointing to either side of the chain. If consecutive free hydrogens point to opposite sides of the chain, then the space between next nearest neighbors can be occupied by a (bi)sulfate ion. If the nearest neighbors free hydrogens point to the same side, then the chain will bend, and there will be a steric hindrance for the (bi)sulfate ion in the neighboring site. The model can be mapped into an equivalent one dimensional polymer with internal degrees of freedom. As such no first order transition occurs in the formation of these chains of elongatged hexagons. A detailed discussion of this model is left for a future publication[11].
3.1 Contribution to the voltammogram
The main contributor to the current is the capacitive current due to the flipping of the water molecules, which is computed from the orientational fugacity Eqs.(1,16)using a Langmiur type equation
| (17) |
where is a constant that determines the position of the maximum of the voltammogram in region 3, and has been adjusted for the time being. The change in the orientation of the water molecules will produce a change in the capacitive current.
| (18) |
where is the integral capacitance, is the number of adsorption
sites per area, e is the
elementary charge, and is the partial charge of the
adsorbate.
4 REGION 2: THE CP BUTTERFLY
The classic shape of the cyclic voltammogram of the hydrogen UPD on a platinum single crystal with (111) orientation has been likened to the silhouette of a butterfly, hence this particular CV profile is known as Clavilier’s papillon(CP)[1]. This system has been studied experimentally by a large number of authors[2, 33, 34, 26, 27, 35, 36, 37, 38, 39, 40, 41]
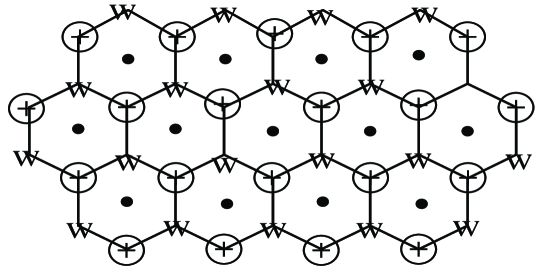
The main point of our theory is the formation of an hexagonal two dimensional honeycomb two dimensional ’ice’ structure ( the HER( Hydrogen Evolution Intermediate) structure shown in Fig.5(5) that remains in place after the desorption of the bisulfate ion. The spike of the Clavilier papillon (CP, region 2)corresponds to the formation of an ordered, , commensurate phase
| (19) |
This is shown in Fig.5
The ’wing’ of the CP [42, 43, 44]is associated with the desorption of (bi)sulfate, and corresponds also in our theory to the desorption of the bisulfate. However in our case the HER intermediate, the water-hydronium honeycomb (WHH)lattice stays intact, and is well represented by a Langmuir adsorption isotherm. This desorption mechanism is different from the hard hexagon order-disorder transition, recently proposed by Koper et al. [45], since in their case the desorption produces necessarily a disordered lattice.
The CO displacement experiments of Feliu and co-workers [46, 47]
show very clearly that the 1/3 corresponding to the ’wing’ of the butterfly is capacitive and is due to the desorption of the bisulfate, which is what we propose in our theory.
The detailed PCVM treatment will be published elsewhere
[21]. Some highlights are:
-
•
Input parameters are the fugacity of ’up’ water (W), the fugacity of ’up’ hydronium (H) and of the sulfate (S). However the formation of the honeycomb structure requires an equimolecular mixture of W and H, so that for the cluster theory we only need an effective adsorbate, which is one half of the W-H compound, the semi-hydronium (SH). In our model the assymptotic occupancy is 1/3 of W, 1/3 of H, or 2/3 for the SH complex, but the effective charge of the SH complex is only 1/2
-
•
the relevant parameters are the S-S interactions, the SH-SH=W-H interactions and the SH-S interactions.
The result of the CVM are a series of sharp and soft transitions[20]. In our case there is only one sharp transition, which corresponds the co-adsorption of bisulfate and hydronium and presumably, also the reorientation of water. The adsorption isotherms are represented by smoothened step functions:
For the bisulfate
| (20) |
and for the semihyronium complex
| (21) |
The positions and widths of the transitions are treated as adjustable parameters, which however correspond the well defined physical parameters:
is the semihydronium transition width;
is the position of the semihydronium transition, which occurs when there is simulataneous co-adsorption of bisulfate and semihydronium.
is the sulfate;
is the position of the sulfate transition, which is determined by the bisulfate-bisulfate repulsive interaction.
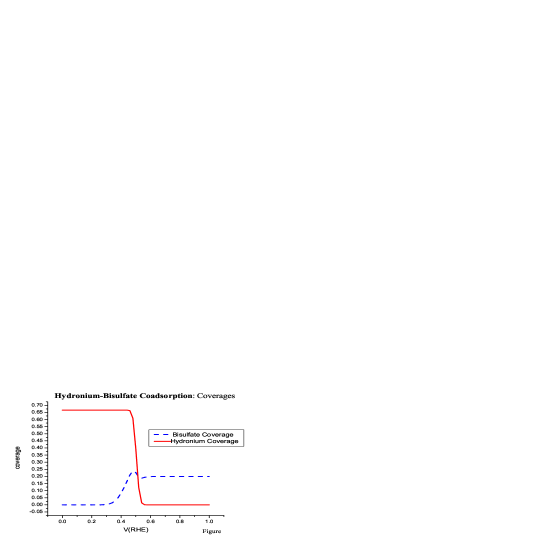
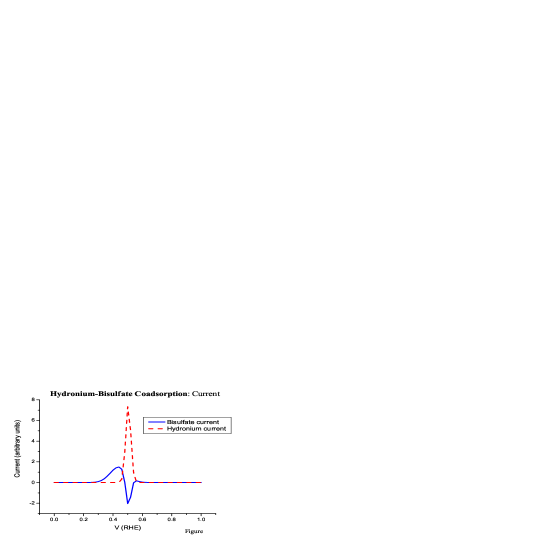
The bisulfate goes from a coverage of 1/5 to 1/3 , and the semihydronium from 0 to 2/3. The exact values for the bisulfate coverages will depend on the other interaction parameters, and will be discussed in a more detailed PCVM analysis. The coverages for the semihydronium are fixed by the experimental hydrogen yield.
The results of the treatment for the adsorption isotherms are shown in Figs. 6(6) and 7(7). The agreement with the recent work of Kolics and Wieckowski[44] is qualitative: First the systems are not exactly the same, and in our case we predict a small glitch when the sulfate is re-adsorbed. We remark also that it is very likely that bisulfate and perchlorate co-adsorb 111 Pechlorate is tetrahedral, the bond length is 1.325 in the crystal. Bisulfate cannot be measured experimentally.The in vacuum structure has been calculated using state of the art DFT by S. Gaurei, is a slightly distorted tetrahedron with a S-O distance of 1.43 Å. The major difference appears to be the dipole moment, which is zero for perchlorate and 3.80 D for bisulfate , since they are isostructural and isoelectronic. This point will be discussed in the future.
5 THE UPD REGION 1: THE MODEL FOR THE HER INTERMEDIATE
Region 1, which is called the H-UPD region [48]has been explored experimentally [49, 35], and several proposals have been made for the HER intermediate [50], based on interpretations of the IR spectra. Our model is based on the stochiometry and the analysis of the phases of the voltammogram, the STM experiments and the recent radiotracer adsorption experiments, and is consistent with the experiment described by Peremans et al [35] Our HER model is a hydrogen bonded network of hexagonal rings, wwhich is a form of two dimensional ice. The chemical formula for a species is
| (22) |
which forms a network of hexagonal rings. The explicit reaction taking place at the (111) face of the electrode is
| (23) |
where the 6 hydrogen ions that are neutralized are those ’trapped’ in the hollow sites of the Pt(111) surface. This means that the spectra observed in the SFG experiments of Tadjeddine are likey to correspond to (semi-hydronium) complexes. The ’upd’ hydrogen is really a ’semihydronium’ ion, with the hydrogen stuck in the hollow site of the platinum lattice, and the dipole of the water molecule properly oriented. Recent quantum mechanical DFT calculations support this model [51].
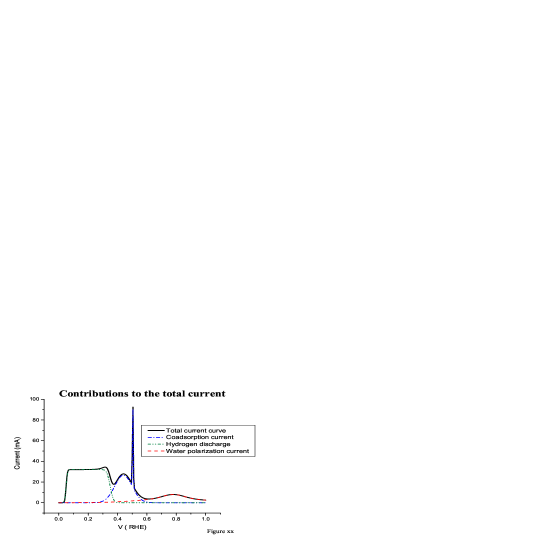
We assume that a ’surface state’ is formed by the HER inermediate that discharges linearly with potential. Our model explains the 2/3 yield for the (111) face in a very natural way. The contribution of this region is only faradaic.
| (24) |
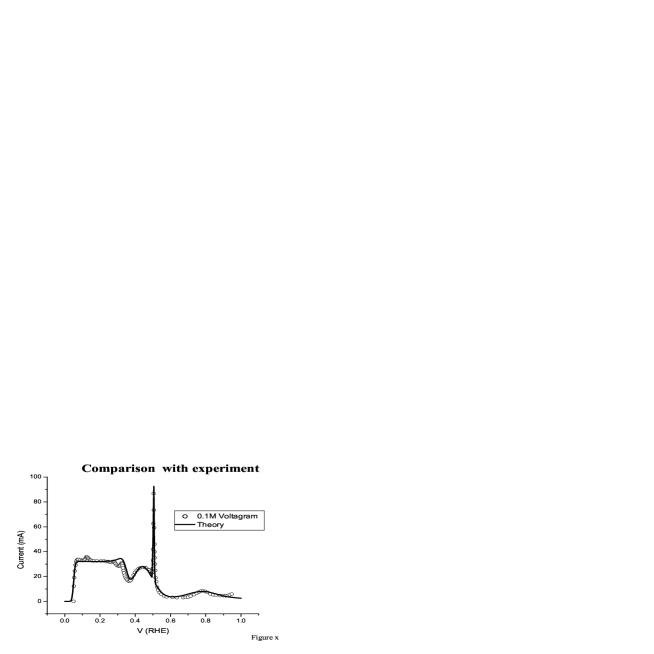
where is the number of adsorption sites per area , e is the elementary charge, is the electrovalence of the adsorbate in the bulk, is the partial charge of the adsorbate at the surface, and the potential. () is the charge per adsorbate transferred to the surface. Fig. 8(8) shows the contributions to the faradaic current due to the processes of adsorption and discharge of the hydrogen adsorbate. Fig. 9(9) shows the rather nice agreement with the experiment ( courtesy of Dr. V. Climent) for a 0.1M sulfuric acid solution.
6 DISCUSSION OF RESULTS
The main points in our work are that the the tetrahedral geometry of the water potential and the large dipole create two different water ’phases’ for positively and negatively charged electrodes: Long chains at positive potentials and a honeycomb lattice for negative potentials. The formation of the honeycomb two dimensional ice phase is promoted by the bisulfate, or by other anions present, and the spike observed experimentally corresponds to this coadsorption. The honeycomb structure remains in place after the bisulfate has left, and is responsible for the 2/3 hydrogen yield of the Pt(111) face
7 Acknowledgements
This research was supported by the DOE-EPSCoR grant DE-FCO2-91ER75674, by The Robert A. Welch Foundation grant P-0446. The authors thank Profs. G. Jerkiewicz, V. Climent,J.M. Orts and A. Wieckowski for the data files of voltammograms, and Prof. R. Car and Dr. N. Marzari for useful discussions.
References
- [1] J. Clavilier, R. Faure, G. Guinet, and R. Durand, J. Electroanal. Chem., 107, 205 (1980).
- [2] J. Clavilier, J. Electroanal. Chem., 107, 211 (1980).
- [3] V. Climent, personal communication.
- [4] D. A. Huckaby and L. Blum, J. Electroanal. Chem., 315 255 (1991).
- [5] D. A. Huckaby and L. Blum, in Microscopic Models of Electrode/Electrolyte Interfaces J.W. Halley and L. Blum, editors, The Electrochemical Society, Proceedings 93-5 232 (1993).
- [6] L. Blum and D. A. Huckaby, J. Electroanal. Chem. 375 69 (1994).
- [7] L.J. Wan, S. L. Yau and K. Itaya J. Phys. Chem.99 9507(1995).
- [8] L.J. Wan,T. Suzuki, K. Sashikata, J. Okada, J. Inukai and K. Itaya J. Electroanal. Chem.461 26 (2000).
- [9] J. G. Kim, J. B. Soriaga, G. Vigh and M. P. Soriaga, J. Coll. Interf, Sci. 15 26 (2000).
- [10] J.M. Orts, L. Bum, D. A. Huckaby, J.M. Feliu and A. Aldaz, Electrochim. Acta (in preparation).
- [11] L. Blum and J. M. Orts, in preparation,
- [12] M.L. Rosinberg, J.L. Lebowitz, and L. Blum, J. Stat. Phys., 44, 153 (1986).
- [13] D.A. Huckaby and L. Blum, J. Chem. Phys., 92, 2646 (1990).
- [14] L. Blum and D.A. Huckaby, J. Chem. Phys., 94, 6887 (1991).
- [15] E.A. Guggenheim and M.C. McGlashan, Proc. R. Soc. London, 206, 335 (1951).
- [16] G.M. Bell, J. Phys. C, 5, 889 (1972).
- [17] M. Shinmi and D.A. Huckaby, J. Chem. Phys., 84, 951 (1986).
- [18] D.A. Huckaby, M. Shinmi, M. Ausloos, and P. Clippe, J. Chem. Phys., 84, 5090 (1986).
- [19] M. Shinmi and D.A. Huckaby, J. Phys. Soc. Jpn., 58, 571 (1989).
- [20] D.A. Huckaby, M.D. Legault, and L. Blum, J. Chem. Phys., 109, 3600 (1998).
- [21] L. Blum, D.A. Huckaby, and M.D. Legault, J. Chem. Phys., , submitted (2001).
- [22] L. Blum and D. Henderson, J. Chem. Phys. , 74 1902 (1981).
- [23] L. Blum, F. Vericat and W.R. Fawcett, J. Chem. Phys., 96 3039 (1992).
- [24] L. Blum and W. R. Fawcett, J. Phys. Chem., 97 7185 (1993).
- [25] L. Blum, F. Vericat and L. Degreve , Physica A 265,396 (1999)
- [26] H.Ogasawara, Y. Sawatari, J. Inukai and M. Ito, J. Electroanal. Chem. 358, 337 (1993)
- [27] Y. Sawatari, T. Sueoka, Y. Shingaya and M. Ito, Spectrochim. Acta, 50A 1555 (1994)
- [28] A.M. Futnikov, U.Linke, U. Stimming and R. Vogel, Surf. Sci. 324, L343 (1995).
- [29] N.F. Mott and J. Watts-Tobin, Electrochim. Acta 4 79 (1961).
- [30] R. Chidambaram, Acta Cryst. 14 467 (1961).
- [31] Y. Shingaya and M. Ito Interfacial Electrochemistry: Theory, Experiment and Applications A. Wieckowsky , Editor,M. Dekker, (1999), Chapter 17, p. 287.
- [32] A.S. Dakkouri and D.M. Kolb Interfacial Electrochemistry: Theory, Experiment and Applications A. Wieckowsky , Editor,M. Dekker, (1999), Chapter 10, p. 151.
- [33] S. Motoo and N. Furuya, J. Electroanal. Chem. 172, 339 (1984).
- [34] F.T. Wagner and P.N. Ross Jr., J. Electroanal. Chem., 250, 301 (1988).
- [35] A.Peremans and A. Tadjeddine, Phys. Revs. Letters 73, 3010 (1994)
- [36] C. Nishihara and H. Nozoye, J. Electroanal. Chem. 379, 527 (1994).
- [37] R. Gomez, J.M. Feliu and A. Aldaz, Electrochimica Acta, 42, 1675 (1997)
- [38] R. Gomez, A. Fernandez-Vega, J.M. Feliu and A. Aldaz, J. Phys. Chem., 97, 4769 (1993)
- [39] J. Clavilier, R. Albalat, R. Gomez, J.M. Orts, J.M. Feliu and A. Aldaz,J. Electroanal. Chem. 330, 489 (1992).
- [40] A. Zolfaghari and G. Jerkiewicz, J. Electroanal. Chem., 420, 11 (1997).
- [41] A. Zolfaghari and G. Jerkiewicz, J. Electroanal. Chem., 422, 1 (1997).
- [42] K. Kunimatsu, M.G. Samant, and H. Seki, J. Electroanal. Chem., 272, 185 (1989).
- [43] P.W. Faguy, N. Markovic, R.R. Adzic, C.A. Fierro, and E.B. Yeager, J. Electroanal. Chem., 289, 245 (1990).
- [44] A. Kolics and A. Wieckowsky, J. Phys. Chem., , (2001)
- [45] M.T.M Koper and J.J. Lukkien, J. Electroanal. Chem.485 161 (2000)
- [46] J.M. Feliu, J.M. Orts, R. Gomez, A. Aldaz and J. Clavilier, J. Electroanal. Chem.372 265 (1994)
- [47] B.Alvarez, V. Climent, J.M. Feliu, and A. Aldaz. Electrochem. Communications2 427 (2000)
- [48] A. Bewick and A.M. Tuxford, Electroanal. Interf. Electrochem. 47 255 (1973).
- [49] A. Bewick, K. Kunimatsu, J. Robinson and J.W. Russell, J. Electroanal. Chem.119 175 (1981).
- [50] A. Bewick and J.W. Russell, J. Electroanal. Chem.132 329 (1982).
- [51] N.Marzari and R.Car, personal communication.