Measurement of low-energy antiproton detection efficiency in BESS below 1 GeV
Abstract
An accelerator experiment was performed using a low-energy antiproton beam to measure antiproton detection efficiency of BESS, a balloon-borne spectrometer with a superconducting solenoid. Measured efficiencies showed good agreement with calculated ones derived from the BESS Monte Carlo simulation based on geant/gheisha. With detailed verification of the BESS simulation, the relative systematic error of detection efficiency derived from the BESS simulation has been determined to be 5 %, compared with the previous estimation of 15 % which was the dominant uncertainty for measurements of cosmic-ray antiproton flux.
keywords:
BESS; systematic error; antiproton detection efficiency; KEK PS; detector simulation; geant/gheishaPACS:
95.55.Vj; 98.70.Sa; 95.85.Ry, , , , , , , , , , , , , , , , , , , , , , , and
1 Introduction
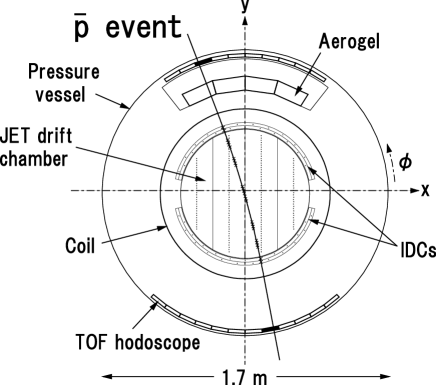
The BESS spectrometer, shown in Fig. 1, was designed [1, 2] and developed [3, 4, 5, 6] as a high-resolution balloon-borne spectrometer with the capability to search for rare cosmic-rays and provide various precision measurements of cosmic-ray primaries. In spite of many advantages in cylindrical configuration, the adoption of solenoidal magnets could not be realized in previous balloon-borne spectrometers because of much unavoidable material in particle passage. However, a thin superconducting solenoid developed at KEK [2, 4] enabled us to uniquely adopt this concentric configuration. A uniform magnetic field of 1 Tesla is produced by a thin superconducting coil [4], through which particles can pass without too many interactions. The magnetic-field region is filled with a tracking detectors (JET/IDCs), resulting in an acceptance of 0.3 m2sr. Tracking is performed by fitting up to 28 hit points in the drift chambers. The upper and lower scintillator hodoscopes (TOF) [6] provide time-of-flight and two d/d measurements. The instrument also incorporates a threshold-type Cherenkov counter [5] with a silica-aerogel radiator to distinguish high-energy ’s from electron and muon backgrounds.
Since 1993 through 2000, seven balloon flights have been successfully carried out and more than antiprotons (’s) have been unambiguously detected [7, 8, 9, 10, 11]. This has allowed measuring the energy spectrum of cosmic ’s and investigating their origin. To investigate the origin of low energy ’s more sensitively, it is inevitably important to reduce systematic errors as well as statistical errors of the resultant spectrum. The dominant source of systematic error in the low energy region ( 1 GeV) is the uncertainty in interaction losses in the instrument. In the previous analyses, we surmised 15 % relative error to the detection efficiency (), which is defined as
where is the number of incidence within the acceptance of the detector, and is the number of identified particles. Since cannot be derived directly from flight data, the detection efficiency is evaluated using the Monte Carlo simulation (BESS MC) [12] based on the geant/gheisha code [13, 14]. The BESS MC incorporates detailed material and detector descriptions such that realistic detector performance is obtained. The original gheisha code was modified so that experimental data of -nuclei cross sections are reproduced [15, 16]. However, it is difficult to estimate the systematic error due to interaction losses because of uncertainties in secondary multiplicity, angular distribution, and detector response; accordingly, detection efficiency must be directly measured and must precisely verified to reduce systematic error in the low-energy region flux.
Considering this, we performed an accelerator beam experiment at the KEK-PS K2 beam line using a low-energy and proton () beam. The objectives of the beam experiment were as follows:
-
1.
directly measure detection efficiencies for ’s and ’s;
-
2.
examine the BESS MC simulation;
-
3.
reduce systematic error in detection efficiency especially for ’s.
Although the BESS detector has been successively upgraded since the first successful flight in 1993, the basic detector concept is the same, i.e., (i) large-acceptance cylindrical configuration with solenoidal magnet, and (ii) mass identification using the rigidity and velocity measurements. Accordingly, the presented beam results can be applied to both past and future detectors.
Section 2 summarizes experimental setup, after which Section 3 describes incident beam identification which determines . Measurement of the detection efficiency is then presented in Section 4, with a study of simulation results being discussed in Section 5. Finally, Section 6 summarizes the main results and provides conclusions.
2 Experimental Setup
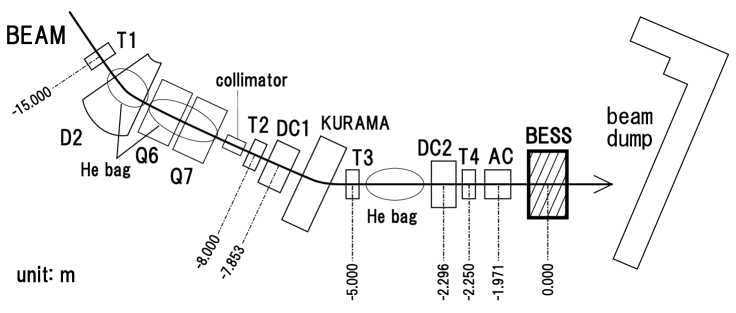
The BESS beam experiment was performed in February 1999 at the KEK-PS K2 beam line which is equipped with an electro-static separator [17] to enrich low energy ’s. Figure 2 shows a schematic view of the experimental setup at the down stream of the K2 beam line. D2 is a dipole magnet, Q6 and Q7 are quadrapole magnets. They are used for beam transport and focusing. KURAMA is another dipole magnet to analyze momentum of the incident particles. The BESS detector was rotated circumferentially 70∘ in - plane (a plane perpendicular to the axis of the solenoid) such that it was suitably positioned in the beam line for proper (from top to bottom) beam incidence. To identify incident particles and to reject interacted events, we placed four trigger counters (T1–T4), two drift chambers (DC1 and DC2), and an aerogel Cherenkov counter (AC) in the beam line (for details, see figure caption).
Data from the BESS detector and beam line detectors are collected using the BESS data acquisition system. To obtain , instead of using the BESS standard trigger (coincidence between upper and lower TOF counters), the trigger was generated by T1 & T2 & T3 & T4 & . Note that remarkably improves the / ratio.
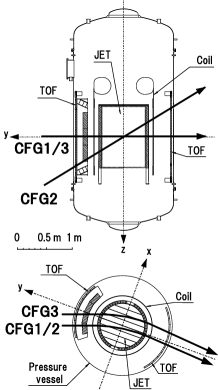
Data were collected for three different detector configurations to represent the typical incidence of cosmic-ray particles in terms of the amount of material and penetrated region. Three configurations, CFG1–3, are shown in Fig. 3 together with typical trajectories. The kinetic energy of incident particles at the BESS top of instrument () ranges from 0.1 to 1 GeV (0.4 to 1 GeV) for ’s (’s). The BESS detector cannot be rotated more than 70 ∘ due to a constraint of the internal structure of the liquid helium storage. Therefore, low energy ’s were out of the BESS acceptance region in this beam experiment due to the opposite deflection.
3 Analysis
3.1 Beam identification
To determine the beam line detectors must unambiguously identify the incident particle and precisely determine incident energy, position, and angle. The incident kinetic energy, , was derived from , where , the velocity of incident particle, was obtained from a pair of timing measurements. Note that (i) less accurate energy resolution was obtained from the deflection measurement due to the multiple scattering and limited track length, and (ii) it is not appropriate to derive the incident energy from the , etc. due to the energy losses in the beam line in spite of the much better resolution. The accuracy of energy determination was 1 % in the very low energy region around 0.2 GeV. Around 1 GeV, energy determination is obtained with 4 % accuracy due to the constant resolution. Systematic error of the absolute energy is estimated to be 1 % due to calibration of the time of flight measurements and energy losses in the beam line. The beam trajectory obtained by DC1 and DC2 is extrapolated to the BESS detector taking into account the fringing field of the solenoid. The accuracy of the incident position and angle around 1 GeV were 2.5 mm and 2 mrad (rms deviation), respectively.
To identify ’s and ’s, we required that the energy losses in T1 – T4 and the velocities measured by various combination of trigger counters are consistent with ’s. Figure 4 shows examples of these cuts for ’s of 1 GeV. Since distribution shows a clear separation between , kaon, and pion/muon/electron particles which allows incident beam particles to be unambiguously identified.

To ensure that incident particles arrive at the top of the BESS instrument, we further required (i) at least one hit in the upper TOF hodoscope and (ii) beam trajectory agreement with the upper TOF hit position in both - and - planes, where the hit point in TOF is obtained from the segmentation of hodoscope in direction and timing difference of PMT at the both end in direction. These two requirements guaranteed that the incident particles pass through T4 and AC without large angle scattering or interaction, resulting in the precise determination of .
In order to compare the beam data and BESS MC results, a MC data set was generated as follows. To estimate interaction and energy losses in T4 and AC, which were located just upstream of BESS, they were described in the BESS MC. Input kinematics of beam particles was obtained from beam data event by event. This allows comparisons between beam data and MC results under the same conditions. Data sets are referred to as BEAM and MC samples, respectively.
3.2 Detection efficiency
In order to select non-interacting ’s, we applied the same cuts as those used in the standard analysis for the flight data [10]:
-
1.
select events with a single downward-traveling particle fully contained in the fiducial region of the tracking detectors;
-
2.
require only one (one or two) hit in the upper (lower) TOF hodoscopes [18];
-
3.
require the TOF hit position consistent with the extrapolation of the trajectory determined by JET and IDCs (not by beam line trackers);
-
4.
require that d/d measurements of upper and lower TOF are consistent with those of ’s;
-
5.
require a quality track in terms of fitting chi-squares, number of hits used in fitting, and etc.;
-
6.
require that the mass derived from momentum and velocity measurements is consistent with mass.
Cuts (1)–(4) reject most of the events with interactions. Distributions of the cut parameters are provided in Ref. [19]. Cut (5) assures the quality of momentum and velocity measurements. Cut (6) is to identify ’s. Selection criteria for ’s are identical to the above except for the sign of momentum. The efficiencies of cuts (1)–(4) are different for ’s and ’s because of the different interaction cross sections. However, the efficiencies of cuts (5) and (6) are the same for ’s and ’s due to the symmetrical configuration of the detector. Therefore, we express the detection efficiency () as the product of the non-interacting efficiency () associated to the cuts (1)–(4) and the quality and particle-identification efficiency () associated to cuts (5) and (6):
Since relies on the MC calculation and can be estimated by using the sample in the flight data, we should verify the former efficiency by the beam experiment.
3.3 Beam-related corrections and systematic errors
The following beam related corrections are applied to and the systematic errors are estimated.
-
1.
Beam dump effect: Annihilation of ’s at the beam dump located 3 m downstream of the BESS detector produces secondary particles, some of which generate delayed hits in the TOF counters. After eliminating the beam dump effect by removing the delayed hits from the hits in the upper and lower TOF hodoscopes, the remaining correction was negligible. The systematic uncertainty was estimated to be 0.002.
-
2.
Accidental tracks: Multi-track events without a vertex in the detector were considered to be a beam-related accidental track and the track is removed from the event. However, an accidental track would be mis-identified as an interaction if the accidental particle is close to the incident . The remaining correction for mis-identification was 0.001 – 0.005 and the systematic uncertainty of the was estimated to be 0.001. The correction and its error for ’s were negligible because of the smaller incident beam intensity.
-
3.
Interaction at upper TOF: The use of upper TOF information to identify the non-interacting beam entering the BESS detector rejects a small fraction of events with interaction inside BESS, which underestimates and thus overestimates . The correction for this effect was estimated by varying the cut parameters of the selections and was estimated to be 0.01 – 0.005. The rms deviation of the difference in between BEAM and MC results was taken as the systematic uncertainty, which was evaluated to be 0.005.
-
4.
Beam energy: Since the systematic uncertainty of the beam energy is 1 %, the corresponding uncertainty in is negligible for energies above 0.16 GeV. However, it is difficult to reliably estimate the corresponding systematic errors in derived from BEAM below 0.16 GeV, where changes rapidly with energy.
In total, beam related systematic uncertainty was estimated to be less than 0.01 for energies up to 1 GeV except for very low energy region where the efficiency rapidly changes with energy.
4 Results
Figure 5 shows for ’s and ’s for each configuration derived from BEAM and MC samples. Reflecting the energy dependence of cross sections, for ’s gradually decreases with decreasing energy, while for ’s shows little dependence on energy. Among BEAM data, the differences between CFG1–3 in are 7, 5, and 3 % at energies of 0.2, 0.4, and 1 GeV, respectively. Although large discrepancies exist below 0.16 GeV where rapidly drops due to stopping of incident ’s in the instrument, they can be explained by the systematic uncertainty of 1 % in the beam energy determination.

The relative differences in between BEAM and MC samples () are shown in Fig. 6 from 0.16 to 1.0 GeV for ’s and 0.4 to 1.0 GeV for ’s, where beam related systematic errors were kept low and well estimated.

As shown, was kept within 5 % for ’s, demonstrating good agreement between BEAM and MC samples. Above 0.5 GeV small but significant discrepancies (2 %) in are present, while statistical accuracy of BEAM data limited the discussion in the low energy region below 0.3 GeV. For ’s, was kept within 2 %. Moreover, good reproducibility of are obtained between different configurations, i.e., the maximum deviation of between all configurations are close to the statistical accuracy of each data point for all energies (mostly 0.005). Note that CFG1–3 were selected to represent the typical incidence of cosmic-ray particles, and the properties of non-interacting particles show very good agreement between BEAM and MC samples.
As a result, these results clearly demonstrates that above 0.16 GeV (for ’s above 0.4 GeV) systematic error in is determined to be within 5 % (2 %). Since systematic error in was well estimated to be within 1 % using unbiased sample in flight data, systematic error in can be considered as that in detection efficiency.
5 Discussion
In a detailed study of the interaction processes in the BESS MC [19], we found no significant difference in for different hadronic packages, gheisha and fluka [20] (implemented in geant3, denoted as gfluka) if we assume the same total inelastic cross section. This means that the multiplicity and angular distribution of secondary particles are less important as far as is concerned. Any interactions in the BESS detector are well discriminated by a combination of various and independent measurements. The only factors relevant to the efficiency are essentially the total inelastic cross section and the material amount. We studied d/d of stopping cosmic rays using the flight data and compared it with the BESS MC simulation. As a result we confirmed that the amount of material was correctly implemented in the BESS MC with an accuracy of 0.5 g/cm2.
Since 1/3 of the incident particles interact in the instrument, the 5 % agreement between the measured and calculated efficiencies means that the previous measurements of -nuclei inelastic cross sections were verified at least within an accuracy of about 15 %.
Figure 7 shows the inelastic and elastic cross sections for to aluminum used in the BESS MC (gheisha(bess), solid curve), as well as those of the original gheisha code, fluka code, and experimental data [15]. The data of Kuzichev et al. only represent annihilation cross section. Assuming that the non-annihilation inelastic cross section is about 10 % of the total cross section as assumed in the gheisha code, we modified the data of Kuzichev et al. and refit all the data below 15 GeV, indicated by the dash-dotted curve in Fig. 7 (gheisha(new)). With this new cross section, was reproduced with better accuracy up to 1 GeV. As a result, the systematic error in detection efficiency can be further reduced to 2 % from 0.3 to 1 GeV for ’s.

Since we do not have the measured data of above 1 GeV, the systematic error in this energy region was estimated from the relative difference in among several hadronic packages (gheisha(new), gheisha(bess), gfluka). The systematic error in detection efficiency above 1 GeV was estimated to be 5 %.
6 Conclusion
Through an accelerator beam experiment, measurements of the detection efficiency for ’s and ’s in BESS were performed below 1 GeV. The measurements and following studies indicated that the detection efficiency was mainly determined from material amount in the instrument and cross sections with nuclei, essentially regardless of the simulation details such as multiplicity and angular distribution of secondaries. As a result, we confirmed that the relative systematic error in detection efficiency derived from the simulation was kept below 5% and 2% for ’s and ’s, respectively. It can be applied to systematic errors in cosmic-ray measurements [8, 9, 10, 11], as well as future BESS experiments including high statistics long-duration flights[21] providing the instrumental features of BESS are maintained. Moreover, we found the total advantage of cylindrical configuration with superconducting solenoid by eliminating possible disadvantage in determining detection efficiencies accompanied with 30–40 % interaction losses in the instrument. By increasing the reliability of the cosmic-ray spectrum, these results will enable us to carry out the most sensitive-ever investigation on the origin of cosmic-ray ’s.
References
- [1] S. Orito, ASTROMAG Workshop, KEK Report 87-19, (1987) 111.
- [2] A. Yamamoto et al., Adv. Space Res. 14, (1994)(2) 75
- [3] Y. Ajima et al., Nucl. Instr. Meth. A 443, (2000) 71
- [4] A. Yamamoto et al., IEEE Trans. Magn. 24, (1988) 1421.
- [5] Y. Asaoka, K. Abe, K. Yoshimura et al., Nucl. Instr. Meth. A 416, (1998) 236
- [6] Y. Shikaze, T. Mitsui et al., Nucl. Instr. Meth. A 455, (2000) 596
- [7] K. Yoshimura et al., Phys. Rev. Lett. 75, (1995) 3792; A. Moiseev et al., Astrophys. J. 474, (1997) 479.
- [8] H. Matsunaga et al., Phys. Rev. Lett. 81, (1998) 4052.
- [9] S. Orito et al., Phys. Rev. Lett. 84, (2000) 1078.
- [10] T. Maeno et al., Astropart. Phys. 16, (2001) 121.
- [11] Y. Asaoka et al., astro-ph/0109007.
- [12] H. Matsunaga, Ph.D. thesis, The University of Tokyo. 1997.
- [13] R. Brun et al.., GEANT3.21, CERN Program Library Long Write up W5013.
- [14] H. Fesefeldt, PITHA 85/02, Aachen, 1985.
- [15] K. Nakamura et al., Phys. Rev. Lett. 52, (1984) 731. V. F. Kuzichev et al., Nucl. Phys. A 576, (1994) 581. Yu. P. Gorin et al., Yad. Fiz. 18, (1973) 336. J. C. Allaby et al., Yad. Fiz. 12, (1970) 538. V. N. Afonas’ev et al., Yad. Fiz. 40, (1984) 34. V. N. Afonas’ev et al., Yad. Fiz. 47, (1988) 1656. A. S. Carroll et al., Phys. Lett. B 80, (1979) 319.
- [16] Note that -nuclei cross sections below 1 GeV in the BESS MC are also modified from original gheisha code, based on the LaRC model calculation [22].
- [17] A. Yamamoto et al., Nucl. Instr. Meth. A 203, (1982) 35.
- [18] The different selection for lower TOF hodoscope is applied to save events with delta ray.
- [19] Y. Asaoka et al., KEK Report 2001-19, 2001.
- [20] A Fasso’, et al., Proc. IV Int. Conf. on Calorimetry in High Energy Physics, La Biodola, Italy, (1993) 493.
- [21] A. Yamamoto et al., Adv. Space Res., in press.
- [22] R. K. Tripathi et al., Nucl. Instr. Meth. B 155, (1999) 349.