The HERMES Dual-Radiator
Ring Imaging Čerenkov Detector
Abstract
The construction and use of a dual radiator Ring Imaging Čerenkov (RICH) detector is described. This instrument was developed for the HERMES experiment at DESY which emphasises measurements of semi-inclusive deep-inelastic scattering. It provides particle identification for pions, kaons, and protons in the momentum range from 2 to 15 GeV, which is essential to these studies. The instrument uses two radiators, , a heavy fluorocarbon gas, and a wall of silica aerogel tiles. The use of aerogel in a RICH detector has only recently become possible with the development of clear, large, homogeneous and hydrophobic aerogel. A lightweight mirror was constructed using a newly perfected technique to make resin-coated carbon-fiber surfaces of optical quality. The photon detector consists of 1934 photomultiplier tubes (PMT) for each detector half, held in a soft steel matrix to provide shielding against the residual field of the main spectrometer magnet.
, , , , , , , , , , , , , , , , , , ,∗ 11footnotetext: Corresponding author. Tel.:+630-252-4013. e-mail:HAL@anl.gov , , , , , , , , , , , , , , , , , , , , , , , , , , ,
1 Introduction
The HERMES experiment[1] is a study of the spin structure of the nucleon which emphasizes on an unambiguous measurement of pion, kaon, and proton semi-inclusive spin asymmetries in deep-inelastic scattering (DIS). These asymmetries provide information on the flavor dependence of polarized structure functions and the sea polarization. However, most of the hadrons produced in HERMES [2] lie between 2 and 10 GeV, a region in which it has not been feasible to separate pions, kaons, and protons with standard particle identification (PID) techniques. Ring imaging Čerenkov (RICH) and threshold Čerenkov systems using heavy gases [3], such as , at atmospheric pressure are useful only for energies above 10 GeV since the kaon threshold for Čerenkov radiation is typically higher than 9 GeV. Because of substantial multiple scattering and brems-strahlung, the use of a high pressure gas system is not technically feasible in HERMES. Clear liquid radiators are only useful for hadron identification below roughly 2 GeV because of their very low Čerenkov light thresholds and large chromatic dispersion.
With the recent development[4, 5] of new clear silica aerogel with a low index of refraction, this difficult energy region can now be spanned. Aerogels have long been used in threshold Čerenkov counters [6], but their use as a radiator in a RICH system is a recent development [7] which has resulted from the availability of material with excellent optical properties. This paper reports the successful use, for the first time, of clear aerogel in combination with a heavy gas, , in a RICH detector. This dual-radiator RICH detector provides clean separation of pions, kaons, and protons over most of the kinematic acceptance of the HERMES experiment. Such a configuration was first proposed for the plannedLHCb experiment [8].
The following section 2 describes the general design of the HERMES RICH detector and the properties of its key components. Section 3 describes briefly the online monitoring of the system, section 4 the reconstruction and particle identification and section 5 the necessary software correction of the mirror alignment. Section 6 finally is dedicated to the performance of the detector.
2 Detector Design
2.1 Design Requirements
HERMES is located in the East hall of the HERA storage ring complex. The spectrometer is split into two halves above and below a central horizontal magnetic shielding plate through which the HERA beams pass [1]. As a result, the RICH detector also consists of two symmetric RICH modules, the top and the bottom RICH sections. The RICH is positioned between the two rear tracking chambers, so that the free space is only 1.25 m deep. The outer body and the gas control system were taken unchanged from the previous threshold Čerenkov counters.
Figure 1 shows the hadron momentum spectra in the HERMES acceptance obtained from a GEANT based Monte Carlo (MC) simulation of the deep inelastic scattering of 27.5 GeV positrons off a hydrogen target. The fall-off of the spectra at low momenta is due to the field of the spectrometer magnet, which severely limits the acceptance at lower momenta. About 95% of all hadrons in the acceptance are found in the range of 2.0 to 15.0 GeV. This defines the momentum range over which clear particle identification should be provided.
The low end of this range determines the index of refraction necessary for the aerogel. A value of n(=633 nm)=1.03 was chosen since it leads to a kaon threshold of 2 GeV. The Čerenkov angles produced by the combination of this aerogel and the heavy gas () for pions, kaons and protons are plotted in figure 2 as a function of particle momentum. The corresponding threshold momenta are listed in table 1. All pion momenta within the spectrometer acceptance are above the pion threshold momentum for aerogel of 0.6 GeV, 90% of the kaon and 78% of the proton momenta are above the kaon threshold of 2.0 GeV.
| aerogel | ||
|---|---|---|
| n | 1.0304 | 1.00137 |
| 4.03 | 19.10 | |
| 0.6 GeV | 2.7 GeV | |
| 2.0 GeV | 9.4 GeV | |
| 3.8 GeV | 17.9 GeV |
The high end of the momentum range fixes the number of photons that must be detected for full hadron separation. The parameter to be considered is , the maximum separation momentum [9]. This is defined as the maximum momentum for which the average photon emission angle of two particle types (with masses and ) is separated by a number of standard deviations :
| (1) |
where is the RICH detector constant, is the number of separately detected photons, is the Čerenkov angle and the standard deviation of the reconstructed photon angle distribution. In the design, was chosen, as it corresponds to a misidentification of the particle in 1% of the cases, assuming equal fluxes for the two particle types, an average detector response (in yield and resolution) and no background.
Assuming to be 7 mrad (see tables 3 and 4) it follows from (1) that = 15 GeV requires for the gas to be 12. This requirement leads to the design values for given in table 2. In this estimate it was assumed that the number of separately detected photons from the aerogel is 10.
| aerogel | ||
|---|---|---|
| 6.7 GeV | 15.0 GeV | |
| 11.2 GeV | 25.3 GeV |
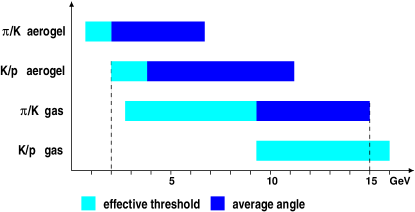
Figure 3 illustrates the overlap between the momentum regions for both radiators. The lightly shaded region indicates where the particle can be identified based on whether or not a ring is present at all. In this region the detector acts like a threshold Čerenkov. In the darkly shaded region the identification is based on the average reconstructed angles. The plot considers each radiator separately, but the PID algorithms will combine the information from the two. The momentum region for which the identification of pions, kaons and protons is possible is limited by the kaon threshold momentum for aerogel at 2.0 GeV and by the maximum separation momentum for /K separation in at 15.0 GeV.
2.2 General Design Parameters
The geometry which was adopted for the Čerenkov radiators and ring imaging systems is shown in figure 4 [10]. The body of the counter is constructed of aluminum, with entrance and exit windows made of 1 mm thick aluminum. The volume of each half is approximately 4000 l. The size of the entrance window is 187.7 cm by 46.4 cm and the exit window 257.0 cm by 59.0 cm.
A gas control system recirculates the radiator gas through the main volume, keeping the gas at a slight overpressure with respect to atmosphere. The aerogel radiator is an assembly of tiles configured to fill the entrance of the detector with an aerogel thickness of 5.5 cm. The unoccupied volume of the detector behind the aerogel is filled with the gas radiator, . A spherical mirror array located at the rear of the radiator box images the Čerenkov light cones onto a focal surface located above (below) the active volume.
The radius of curvature of the mirror array is 2.20 m. It was chosen to give a focal surface location in the accessible region above (below) the forward region of the radiator boxes and to provide a detector plane of tractable dimensions. The optical axis of the array, the perpendicular to the mirror surface at the center of the array, is inclined at an angle of 26 degrees to the horizon. The photon detector is located outside of the mirror optical axis with its axis inclined at an angle of 40 degrees to the horizon so as to intercept the mirror surface at a distance of 90 cm. The focal length of the mirror is 110 cm. The boxes are fitted with gas connections and pressure regulators which provide a continuous controlled flow of recirculating gas. An open section of one of the RICH counters is shown in figure 5.
The size of a useful detector surface was evaluated by an MC simulation which included an early version of the RICH geometry described above. The simulation showed that 95% of the centers of the rings and 90% of all the photons are contained in a planar surface 60 cm high and 120 cm wide (0.72 m2 surface area). These dimensions were used as lower limits in the final design of the photon detector.
The inner walls of the box are blackened to reduce wall reflections. An array of green light-emitting diodes (LED) is installed to provide test and calibration pulses for the photon detector. They are located on the face of the mirror, so as to provide an approximately uniform illumination of the photon detector surface.
As explained below, most of the useful photons contained in rings emitted from the aerogel are in the visible light region. A good choice for the photon detector is then an array of photomultiplier tubes (PMTs). In the present design 3/4 inch tubes were used, leading to a pixel size of 23.3 mm. A total of 1934 PMTs is necessary to cover the photon detector area.
Table 3 lists estimates for the different contributions to the single photon resolution. results from the uncertainty in the emission vertex along the track in the radiator. The detector granularity determines , which follows from the size of the “pixels”. These two contributions affect both the aerogel and the gas angles. The chromatic aberration derives from the variation of the index of refraction with respect to the wavelength and is only important for the resolution in the aerogel. These quantities do not add quadratically and are only listed separately to indicate their relative importance. Their combined effect is calculated in the MC and is listed as . The resolution is dominated by the pixel size, which is determined by the size of the PMT and how much material must surround it to provide adequate magnetic shielding.
| aerogel | ||
|---|---|---|
| 1.8 mrad | 2.2 mrad | |
| 5.6 mrad | 5.2 mrad | |
| 2.5 mrad | - | |
| 7.1 mrad | 7.2 mrad |
2.3 Aerogel Radiator
New production techniques [4, 5] have yielded aerogels with much more uniform and smaller colloidal particle structure. The more uniform granular structure suppresses Rayleigh scattering of visible light and greatly enhances its transmission. Material with a refractive index in the range , suitable for use in the momentum range of interest in HERMES, is now commercially available from Matsushita Electric Works111Advanced Technology Research Laboratory, 1048 Kadoma, Kadoma-shi, Osaka-fu, Japan 571, contact: M. Yokoyama, email: yokoyama@crl.mew.co.jp in the form of tiles of average dimensions 114 by 114 by 11.3 mm3. The optical properties of the aerogel tiles have been studied in detail using a sample of 200 tiles. The transmittance was measured for each tile for the wavelength range of 200-900 nm. Typical values for individual tiles at 400 nm are around 0.67. The transmittance was parameterized as a function of wavelength and aerogel thickness by the Hunt formula [13]:
| (2) |
The measurements can be described well with a value of = 0.0094 m4 and . More details on the optical properties of the aerogel tiles can be found in [11, 12, 13, 14].
Out of 1680 tiles produced in a single production batch, 1020 tiles were judged to be usable for the HERMES RICH. The selection was based on the measured refractive index and the sizes of the individual tiles [11]. Of the 1020 tiles, 850 were actually used. For those tiles, the average index of refraction is 1.0304, with a spread of [12, 11]. The tiles are stacked in a container consisting of an aluminum frame with a 1 mm aluminum entrance window and a 3.2 mm UVT-lucite exit window. To guard against possible degradation of the aerogel by the environment, the aerogel container is sealed gas tight and dry nitrogen is continuously circulated through the box at a slow rate.
The aerogel tiles are stacked in 5 layers, with 5 horizontal rows, and 17 vertical columns as required to span the spectrometer acceptance. Black plastic spacers of appropriate thicknesses between the aluminum frame and the tiles prevent them from shifting while the radiator is moved. The aerogel wall thickness was chosen as the optimal point for maximizing the unscattered light yield relative to scattered background photons [13, 14]. The tiles are stacked according to their measured refractive index, thickness, and surface quality. To achieve the best ring resolution, tiles with similar refractive indices are placed together in the same stack, so that particles passing through the radiator emit photons with very similar Čerenkov angles. Opaque black sheets of tedlar between the aerogel stacks reduce distortions by absorbing photons that cross stack boundaries.
The choice of the material for the exit window was driven by its transmission properties. Due to the proportionality to of the Rayleigh scattering cross section, the low wavelength end of the light yield spectrum is dominated by rescattered photons. Since they only contribute to the background, the exit window material was selected to absorb most of them. A good match was found in ultraviolet-transmitting (UVT) lucite, which has an absorption cutoff of 290 nm [14](see figure 6). The thickness of the UVT window, 3.2 mm, was chosen to be as small as possible while still providing sufficient mechanical stability. It contributes less than 1% of a radiation length. The Čerenkov light generated in the lucite itself is emitted at such high angles that it is effectively trapped by total internal reflection for most forward tracks.
2.4 Mirror Array
The mirror arrays each consist of eight segments that are mounted in
two rows of four
(see figure 5). Both the mirrors
and the mounting frame were fabricated by Composite
Mirror Applications (Tucson, Arizona, USA)222
web: http://home.earthlink.net/bromeo/
contact: R. Romeo, email: bromeo@earthlink.net
.
The backing of the segments is fabricated from a graphite fiber
composite [15] coated with an epoxy film yielding an optically
smooth surface. Surface roughness was specified to be less than 5 nm.
The surface is aluminized to provide a reflectivity above 85%
for light in the 300-600 nm range (see figure 6).
The segments are held on a
carbon-fiber frame with individual adjustable three point mounts.
The dimensions of each
array are 252.4 cm by 79.4 cm; each weighs less than 13 kg. This guarantees
that the mirrors contribute negligibly (less than 1.0% of a radiation
length) to the total radiation length of the detector, which is
dominated by the freon gas (5%), the aluminum windows (3%) and the aerogel (2.8%).
The short time scale of the RICH installation (13 months from approval to installation) only allowed for a simple alignment procedure when the mirrors were installed. A point light source at the nominal radius of curvature of the array was imaged on a screen. The mirror segments were then adjusted to minimize the size of the reflected image. To neutralize the unexpected flexibility of the mirrors, their mounting was fine-tuned by adjusting additional pressure points where necessary. A nominal 90% of the reflected light was contained in a spot corresponding in size to the pixel size of 23 mm. The actual mirror alignment was determined from the data itself (see section 5).
2.5 Photon Detector
As discussed, the useful photons emitted in the aerogel are largely limited to visible wavelengths. The radiation emitted in the gas does have a component extending into the UV region, but since the photon yield from the gas is sufficiently high, the detector response in the UV is not crucial. Consequently, photon-to-electron conversion by photocathodes typical of commercial photomultipliers provides a simple and robust photon detector technology.
While photomultipliers with a diameter of 0.5 inch are commercially available, their cost and the time of construction for two large 0.5 inch arrays were unacceptable. Instead, Philips XP1911 photomultipliers were chosen, with a diameter of 18.6 mm (0.75 inch) and a guaranteed minimum active photocathode diameter of 15 mm [16]. This led to a pixel size of 23.3 mm. can be estimated at the center of the detector by assuming that both the radiator and the detector are at the focal plane. This gives = mrad (for circular pixels), where is the focal length (110 cm) and is the linear pixel size. However, this is a simplifying assumption and an MC simulation leads to the values in table 3.
The XP1911/UV (green enhanced) PMT was chosen for its broad quantum efficiency curve that matches the Čerenkov light spectrum of the aerogel well. Since the efficiency extends into the UV, it is also a good choice for the gas photons, as is clear from figure 6. This figure shows the different contributions to the total photon detection efficiency for both radiators.
An automated PMT testing procedure was used to select PMTs with a broad plateau. High voltage (HV) plateau curves were measured for each tube with a 470 nm light emitting diode pulser. In addition, a low dark current single photoelectron pulse rate was required. After the installation of the RICH in the HERMES spectrometer a noise rate of about 1 kHz was reached, corresponding to 1 PMT firing per detector half every five events (gate length 100 ns). The PMTs were sorted according to their gain characteristics and their noise level. With an especially developed low current (0.040 mA at 1300 V) high voltage divider it was possible to supply 32 PMTs from a single HV channel. The divider also limited the heat generated in the base of the PMTs, thereby significantly reducing the cooling requirements of the detector.
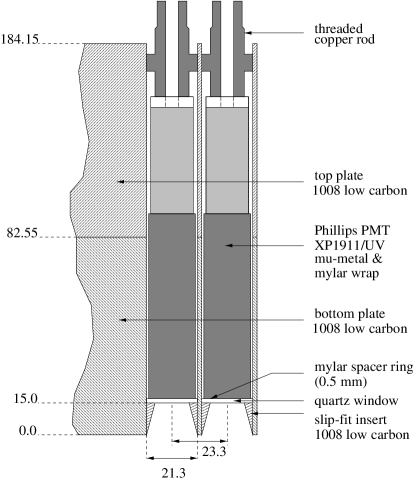
The photomultipliers were arranged in a hexagonal closed packed matrix of 147.4 cm by 62.8 cm, centered on the mirror focal point. This configuration was first used by the experiment E781-SELEX at FNAL [17]. The elementary cell of the array is a hexagon with the photomultiplier at the center. A light-gathering cone is used to increase the photon collection efficiency by reducing the dead space between the photocathodes. The distance between two adjacent cell centers is 23.3 mm, yielding an elementary cell surface of 426 mm2. The 1934 PMTs in each detector half are arranged in 73 columns of alternately 26 and 27 PMTs each. A section of the soft steel matrix plate and PMT packing design is shown in figure 7. The matrix plate provides the gas seal for the C4F10 volume. The gas seal for individual PMT cavities was provided by thin quartz windows which were glued to soft steel cone-shaped inserts that in turn were glued into the inner face of the PMT matrix plate.
Only 38% of the area of the focal plane is covered by the PMT photocathodes. An aluminized plastic foil funnel was inserted into each soft steel entrance cone to increase the coverage to 91% of the photon detector surface and to improve the reflectivity of the cone surface.

The funnels extend beyond the steel plate with an opening diameter of 23.3 mm, so minimizing the dead space between the PMTs. They provide a high reflectivity above = 200 nm. Their effect on the geometric collection efficiency is shown in figure 8 as a function of the angle between the incoming photon and the normal to the detector plane (incident angle). The influence of the funnels is found from the difference between the total efficiency and the efficiency for ”direct” detection.
The stray fields from the HERMES spectrometer magnet at the location of the photon detector matrix can reach up to 90 G perpendicular to the detector plane, requiring careful magnetic shielding of the PMTs. Individual PMTs were wrapped in a 100m thick -metal sheet and the matrix plates holding the PMTs were constructed from high permeability (C-1008) steel. The soft steel matrix, combined with the -metal shielding and the soft steel inserts, reduces the magnetic fields to negligible levels, which guarantees that the PMT gains are not significantly affected.
2.6 Detector Readout and Event Format
The readout of the photon detector is performed by the commercial LeCroy PCOS4 acquisition system, upgraded for the HERMES application. Each detector half is read out by a set of 8 symmetric backplane sections, each housing 15 or 16 PCOS4 cards. Each card in turn processes signals from 16 PMTs. This reduces the number of cables needed to 10 twisted pairs cables. Only digital information - when the pulse exceeds the threshold of 0.1 photoelectrons - is recorded. The system is characterized by high input sensitivity (the threshold is 3000 electrons) and high amplification ( V per electron). Because of the 650 W power dissipated per detector half, each RICH section has a cooling system integrated into the RF-shield and electronic enclosure. A closed stream of cooling air (360 m3/h) is guided over the PCOS4 electronics on both sides of the PM-matrix and over the PMT matrix itself. The heat transferred to the air flow is removed by a water-cooled heat exchanger.
The data from both RICH detector halves are treated in the same manner as spectrometer chamber data. The PCOS4 system generates a data stream on an event-by-event basis. The RICH data consists of a RICH hit table for each detector half, where a PMT ‘hit’ simply refers to a PMT that fired during the event time window. A RICH mapping file is used to link the data channel numbers computed in the decoding process to the PMT location in the detector matrix. This information can then be used to generate the spatial hit coordinates and the hit pattern in the focal plane.
3 Online Monitoring
HERMES uses a client-server based system for the monitoring of detector operating parameters [18, 19]. In the case of the RICH this includes high and low voltages, gas pressure and composition, and the temperatures at the photon detectors. The information is available in the form of Tcl/Tk based displays [20].
In analogy to wiremaps for the tracking chambers, “tubemaps” are used to monitor the performance of the PMTs, the high voltage and the electronics. An example of the standard two-dimensional overview is shown in figure 9. The increased hit density in the center is due to the gas rings. This plot shows that more than 99% of the tubes are functional. More detailed maps are available for diagnosing operational problems.

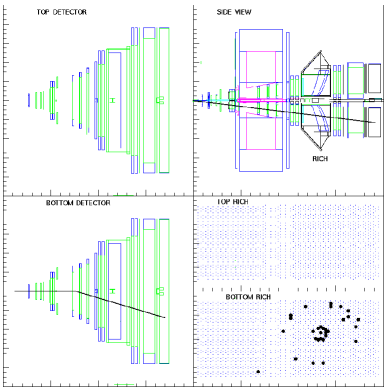
The RICH data have also been integrated into the online HERMES event display system to allow the online analysis of events. Figure 10 shows the standard view for the case of a clean single electron event. The event display combines top and side views of the spectrometer with views of the top and bottom RICH photon detectors. It represents the grid of 1934 PMTs in the form of dots. All PMTs that fire are marked by filled circles. In general particles with momenta above both the aerogel and thresholds will generate roughly concentric rings: a small inner ring resulting from the photons generated in the gas and a larger outer ring formed by the aerogel photons.
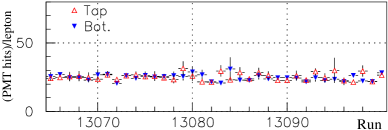
Electrons and positrons that are detected in the RICH always have momenta above both radiator thresholds. They should therefore always have both rings present, which makes them ideal for the online monitoring of the data quality. The average number of PMT hits for single lepton events in a run is used as the monitoring parameter; it is usually about 20. Figure 11 shows this parameter in a typical online data quality plot.
4 Reconstruction and Particle Identification
4.1 Principles of the Reconstruction
Since the sensitive face of the flat photon detector does not conform to the true mirror focal surface, the detected ‘rings’ are not circles, but in general asymmetrically distorted ellipses. Hence a ring fitting procedure is not feasible for an accurate reconstruction of the Čerenkov angles. The raw data that provide the input for any reconstruction procedure are the list of PMT hits per event and the parameters of the particle tracks determined by the tracking detectors [1].
In the case of the aerogel rings on average only about 10% of the PMTs that lie on the aerogel ring will be hit. Hence multiple hits are infrequent and each PMT hit represents one photoelectron. The average number of hits on the aerogel ring of an ultra-relativistic () particle that suffers no acceptance effects (aerogel tiles, mirror) is about 10. The sparsity of the hits on the aerogel ring makes the detection of this ring susceptible to background, noise and acceptance problems. The situation for gas rings is very different. The average multiplicity of photoelectrons per hit for the gas rings is about 2 (based on MC simulations). This might lead to the assumption that all PMTs that lie on the gas ring will be hit. However, due to Poisson-statistics this is not correct. On average about 23 PMTs are touched by the gas ring of an ultra-relativistic particle, but only 12 of those PMTs actually fire. Most of them are hit by several photo-electrons.
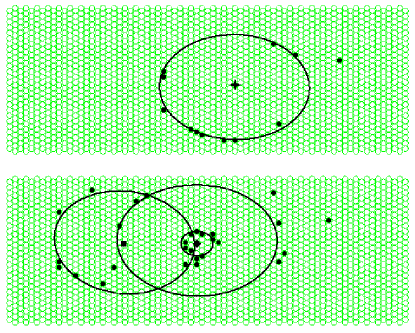
Figure 12 shows the offline RICH event display for a three-track event that illustrates several typical features of HERMES RICH events. The event shown has a 14.6 GeV electron333Electrons and positrons are identified by a combination of calorimeter, preshower and TRD with an average efficiency of 99% and a hadron contamination below 1% [1]. and a 1.5 GeV pion in the lower half, and a 5.5 GeV kaon in the upper half of the detector. The solid black points mark the PMT hits, while the markers in the ring centers indicate the virtual track hit points, i.e. the points where the particle tracks would intersect the photon detector if they were imaged by the mirror. The solid lines are spline fits to a few simulated photon hits. They indicate where, based on the track parameters and the particle type, hits could be expected for this event. The electron track is easily identifiable as the only one with a gas ring; a comparison to figure 2 shows that only for the electron a gas ring is expected. The momentum of the pion is below the pion gas threshold and thus it only exhibits an aerogel ring. However, the particle clearly must be a pion, because the particle momentum is below the aerogel threshold for kaons. The kaon in the top detector has a well defined aerogel ring, but no gas ring - as is expected for a kaon at 5.5 GeV. Any pion at this momentum would certainly have produced a gas ring, while the aerogel ring for a proton would have a much smaller radius.
The task of the pattern recognition algorithm is in principle to associate the various hits in the photon detector of the RICH with a ring assigned to a certain track. In practice this detailed assignment is not needed and only the information relevant to the track identification is extracted. The relatively low track multiplicity in the HERMES experiment simplifies this task considerably.
4.2 Inverse Ray Tracing
The analysis of the hit patterns is intrinsically complex since the non-linearities of the imaging system distort the simple ring structure of the emitted light. The influence of the imaging system can be removed by inverse ray tracing (IRT) [8, 9]. In this method the Čerenkov angle corresponding to each PMT hit is reconstructed from the track parameters and the position of the PMT.
The inverse ray tracing problem can be formulated as follows: given a track and a hit in the RICH photon detector plane, at which angle was the photon emitted? Assume that the emission point can be estimated. This assumption will be discussed below.

The geometrical problem can be formulated as follows using the terminology of figure 13. Given point E, the likely emission point, point D, the detection point and C, the center of the spherical mirror the photon scatters from, find the point S on the surface of the mirror where the photon scattered. The properties of point S are, in vector notation:
-
1.
is coplanar with and .
-
2.
= R
-
3.
For the mathematical formulation of the problem it is easier to switch to an Euclidean base with C as the origin. The u axis is defined along . The v axis is coplanar with and , and oriented such that . The usual caret notation is used to indicate a unit vector. The third axis (w) is defined such that the base defines a right-handed coordinate system. The components of the vectors are then:
| (3) |
Clearly and . The angles are defined in figure 14.

The coplanarity requirement has been satisfied by the choice of the axes. The parameterization of S ensures that it will be located on the mirror surface. The remaining parameter now must be determined from the equality of the incident and reflected angles. This leads to two (redundant) equations for the unit vectors:
| (4) | |||||
| (5) |
The second equation is a vector equation, but since all three vectors are coplanar, the only parameter is the length of the vector product.
The first equation reduces to:
| (6) |
The vector equation represents the equality of the sines of the angles, and has only a non-zero component along the w-axis. This component reduces to:
| (7) |
Combining the two equations yields:
| (8) |
The solution to the equation can now be found from Newton-Raphson iterations.
Since the result will be the angle , no further work is necessary. Using
half of the angle as the starting point, convergence is usually
achieved within three iterations.
The reflection point on the mirror can then be found as follows:
| (9) |
The inverse ray tracing method reconstructs the emission angle for each hit, provided the emission vertex is known. For each track it is assumed that the hit could be coming from the aerogel or the gas, and the emission vertex is estimated
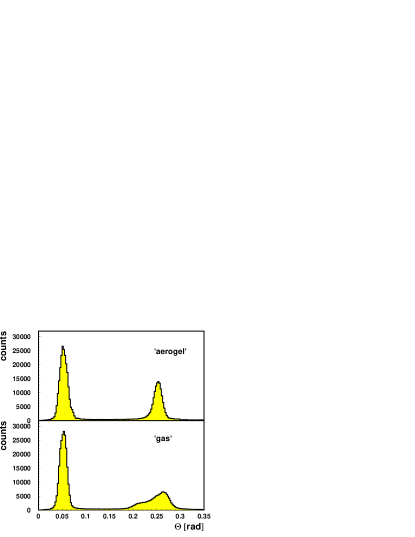
accordingly. For each radiator hypothesis, the emission angle is then reconstructed. This results in a spectrum of reconstructed angles, as shown in figure 15, which is clearly dependent on the radiator hypothesis. Due to the very different index of refraction, it is rarely a problem to distinguish which radiator hypothesis is correct. The remaining uncertainty in the emission vertex due to the finite length of the radiator is unavoidable and results in the contribution to the resolution in table 3.
Another difference in the treatment of reconstructed aerogel and gas angles lies in the refraction of aerogel photons at the aerogel-gas boundaries. This is approximately corrected for under the assumption of a flat aerogel-gas boundary and coplanar refraction.
4.3 Likelihood Analysis
The selection of a most probable particle type is made by calculation of the likelihood that each particle type would generate the measured IRT spectrum. Due to aerogel edge effects and the finite mirror size, the yields of aerogel and gas hits vary strongly over the spectrometer acceptance. As a result the particle identification is largely based on the reconstructed average angles, which are less susceptible to these effects. The theoretically expected angles are calculated for each particle type hypothesis from the track momenta. For each particle type hypothesis a window is imposed on the spectrum of reconstructed angles around this expected value. The width of this window () is set to 4 times the single photon resolution . However, it is in principle a free parameter that can be adjusted to optimize the performance of the particle identification algorithm. The average angle is then determined from the reconstructed angles in the window .
The distribution of measured average angles for a given particle type and momentum can be normalized to form a conditional probability. For known relative particle fluxes a particle type probability can then be calculated. If the relative particle fluxes are not known, the conditional probability can itself be used as a likelihood. Furthermore, if the average angle resolution is assumed to be independent of the particle type, the overall normalization of the conditional probability distribution does not matter. It may be chosen so that the maximum value of the likelihood is 1. With a Gaussian shape of the average angle distribution the likelihood is then calculated as
| (10) |
where is the average angle resolution, which is calculated from the single photon resolution as
| (11) |
The likelihoods for the two radiators, aerogel and gas, are combined to an overall likelihood by multiplication. For this paper, the particle is assigned the type with the highest likelihood. Obviously, this requirement will allow more contamination than is acceptable for most physics analyses. A detailed discussion of the “quality” of the particle identification and the resulting tradeoff between contamination and efficiency will be the subject of a subsequent paper.
5 Mirror Alignment
The alignment of the mirror array within the detector volume was determined from the data. It consisted of three steps: global alignment, individual mirror alignment and local alignment.
For global mirror alignment the mirror array was treated as one unit. A three-dimensional scan of the assumed position of the mirror center was performed (in software) and the influence on the reconstructed aerogel and gas rings was studied using a set of high energy single electron tracks. The performance was characterized using 24 parameters, including the average angles, their spread, the single photon resolution, the yields and the azimuthal uniformity of the gas rings. A careful study resulted in a small range of acceptable values for the position of the mirror center and a shallow optimum was selected.
However, both mirror arrays consist of eight individual mirrors each, whose alignment relative to one another is not necessarily perfect. In addition, the construction of the mirror allows for local variations of the radius of curvature of the surface, especially around the stress points introduced to compensate for the flexibility of the individual mirror segments (positioned at the edges of the mirrors). These variations in the mirror radius introduce local variations in the reconstructed angle. This translates into a larger spread on the reconstructed angle, and (if not corrected) a different average angle for some parts of the mirror. In certain momentum ranges this can lead to a misidentification of the particle.
For this reason in the next two steps of the alignment determination the individual mirrors are aligned relative to one another and then each mirror is further subdivided and the pieces are individually adjusted. Steps two and three are based on two geometric properties of the mirrors: the position of a spherical mirror with known radius is unambiguously determined by the position of the mirror center. Furthermore, if it is known how a single photon is reflected by the mirror, the mirror center can be determined for a given radius.
While the actual track of a photon in the detector cannot be determined, it is possible to determine approximately how a charged particle track would reflect in the mirror. This is done by measuring the center of the gas ring created by the track. This center can be related to the point where a reflected track would hit the photon detector by comparing it to an MC simulation. For a single track the reconstruction of the individual mirror centers is still underdetermined. However, it is possible to use a large number of tracks with gas rings that were reflected on the same individual mirror and then calculate the optimal mirror center to account for their behavior. This optimum is not unique and depends somewhat on the starting point.
For the third step the individual mirrors were artificially divided
into parts that were treated as if they were individual mirrors.
The limiting factor here is the size of the gas rings.
This ‘local alignment’ allows for a better approximation of the real
mirror surfaces.
The result is illustrated for the top mirror array in figure
16. The plotted quantity is the focusing quality
, where
is the
reconstructed Čerenkov angle for a single PMT hit and is the average angle for the corresponding track.
This quantity approximately corresponds to a local derivative
of the mirror surface.
Individual mirror and local alignment are based on a large sample of pions with
momenta between 4.5 and 5.5 GeV. They were selected to cover as much as
possible of the mirror surface while having well defined gas rings.
6 Detector Performance
The detector performance ultimately is measured by how well the various particle types are identified. For a given particle identification algorithm this performance is determined by the number of detected gas and aerogel photons, as well as the single photon resolution. Complications arise from overlapping rings and background hits.
6.1 Yields
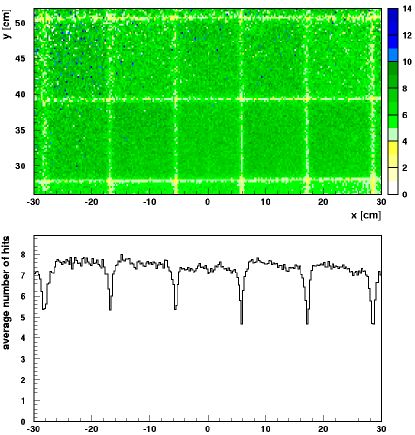
The number of aerogel photons detected strongly depends on how much the track is affected by acceptance effects from the finite size of the mirror array and the tile structure of the aerogel radiator. Figure 17 illustrates the influence of the tile structure. The bottom plot is a projection of of a horizontal band of tile in the top plot between y=30 cm and 36 cm, showing the edges of the aerogel tile stacks. The slightly lower average yield in the top left tile arises from a lower incident electron flux. With the given size of the aerogel tiles about 45% of all tracks are affected by the tile structure. It would be desirable to develop larger aerogel tiles of the same optical quality. For example, in the case of 2030 cm2 tiles only about 20% of the tracks would be affected.

Figure 18 shows the number of aerogel PMT hits and gas PMT hits versus particle momentum for ‘ideal’ pion tracks that do not suffer from acceptance or overlap effects. The two plots show the rise towards the asymptotic values of 10 aerogel hits and 12 gas hits. As a result of the acceptance effects, the asymptotic number of aerogel hits for all tracks is reduced to about 8.
6.2 Background
An inspection of all events from a single run (1861 events) showed that roughly one third of all particles that produce clear rings in the detector do not have a full reconstructed track that is associated with them. These tracks are low momentum particles that do not pass through the entire spectrometer and particles produced in flight within the spectrometer. Examples of the latter are delta electrons and electron-positron pairs. These ‘trackless rings’ act as background for the rings that are associated with tracked particles. In events with more than one track in one detector half the rings of the tracked particles of course are ‘background’ for one another in the same way.
In addition to the trackless rings, there are several sources of background photons that do not necessarily result in ring structures. These include Rayleigh scattered photons, Čerenkov photons produced in the lucite window, proton beam correlated back-ground showers that hit the PMT matrix directly and scintillation in the gas. The electronic and PMT noise in the detector is a very small effect, amounting to only about 1 fired PMT every 5 events.
6.3 Average Angles and Resolution

As the likelihood analysis is based on the average angles, it is of particular importance that the angles are correctly reconstructed and that their momentum dependence is understood. Figure 19 shows the reconstructed average aerogel angle for pions. The data were fit with a theoretical curve with the aerogel index of refraction as the only free parameter. The resulting curve and index of refraction (n=1.0304) are in excellent agreement with the theoretical expectation and the optically measured index of refraction. Figure 20 shows the reconstructed gas angles for pions together with the theoretical curve for an index of refraction of 1.00137. The systematic difference between data and theoretical curve at low momenta is due to the finite size of the PMTs.

The MC simulation of the RICH detector plays an important role in the understanding of efficiency and contamination values for the RICH particle identification. Hence, it is necessary that the detector response is adequately described by the simulation. Figures 21 and 22 show the comparison of reconstructed aerogel and gas angles for ultra-relativistic electrons ( GeV).
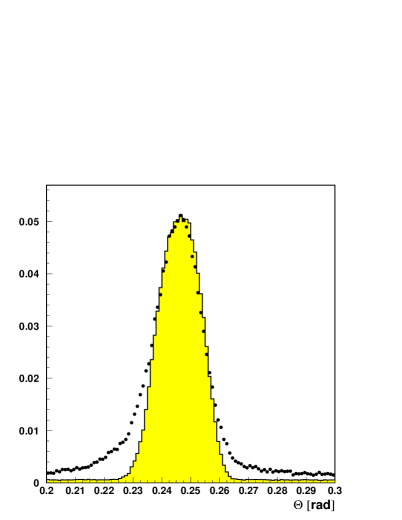
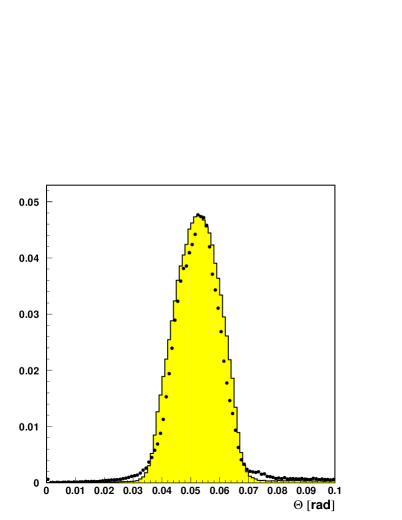
For the comparison the data and the MC results were normalized to the same maximum value.
Figure 21 shows the excellent agreement in the central part of the distribution. The wider tails of the experimental distribution are due to several effects that will be discussed below. The flat background past the tails is another important difference between the MC and the data. The difference in the aerogel spectra is due to the presence of additional contributions to the resolution, which are listed in table 4. A significant effect comes from the aerogel tiles, which have sharply curved surfaces near the edge. This refracts the photon in an unpredictable way, which gives rise to the contribution. It also contributes to the background. was estimated from comparing the resolution for tracks that are not affected by the tile edges to those that are. accounts for variations in the index of refraction between the aerogel tiles. Its value is determined from the measured indices of refraction. There is also a ‘forward scattering’ contribution [21], which must be taken into account, but which, unlike the contribution , is not included in the Monte Carlo simulation.
| aerogel | ||
|---|---|---|
| 3.0 mrad | - | |
| 1.1 mrad | - | |
| 0.9 mrad | - | |
| - | 1.0 mrad | |
| 7.6 mrad | 7.5 mrad | |
| 2.3 mrad | 2.2 mrad |
For the reconstructed gas angles in figure 22, the width and shape of the distributions is basically in good agreement. The MC distribution is slightly wider and less ‘Gaussian’ than the experimental data. As this is the distribution of the individual reconstructed angles (with one entry per fired PMT), this is likely an effect of the MC overestimating the photoelectron yield for the gas. Due to the non-linear relationship between the number of photoelectrons and the number of fired PMTs the additional photoelectrons add relatively more to the sides than to the center of the distribution.
Pressure and temperature fluctuations change the density of the gas, and therefore its index of refraction. This contribution, , was determined from the observed maximum pressure fluctuations. This error can be eliminated by taking the measured pressures into account in the reconstruction.
The experimental value of the total angular resolution for single photons, , was determined for high energy single lepton tracks that are not affected by any tile edge or mirror acceptance effects (table 4). The data were taken from a period of stable atmospheric pressure and events with a large background were excluded. The reconstructed angle spectra were fitted with a Gaussian plus a linear background. As a result of the selection of these ‘ideal’ tracks the aerogel tile effects () do not contribute to for aerogel and does not contribute to for gas. The experimental gas resolution therefore is a combination of the effects that are collected in (cf. table 3) and the hitherto unknown contribution of the mirror imperfections . This contribution in particular refers to the non-sphericity of the mirror array and the diffuse reflection component of its surface. Under the assumption that the quadratic sum of and yields the experimental value for gas, the mirror contribution is calculated to be about 2.2 mrad. In the case of the aerogel also and must be included. The assumption that for aerogel is the quadratic sum of these contributions with (cf. table 3) leads to a value of 2.3 mrad for , in good agreement with the value extracted from the gas angles.
6.4 Efficiencies
Monte Carlo predictions for the efficiencies and purities
of the hadron identification using the IRT likelihood algorithm
are given in table 5. The MC
simulation of the RICH detector used for this prediction
contains a detailed simulation of the aerogel radiator geometry
as well as experimental background data extracted from
trackless events. The data are from 1.84 million MC events
using a deep inelastic scattering generator. The particles are
identified as the particle type with the highest IRT likelihood.
As mentioned before, stronger constraints on
the particle likelihoods will improve the purity of the sample,
albeit at the expense of the efficiency.
| id. as | K | p | purity | |
| 619390 | 8050 | 23008 | ||
| K | 17282 | 58390 | 16757 | |
| p | 7461 | 5612 | 80113 | |
| no id. | 10802 | 6647 | 29634 | |
| Decay | Efficiency |
|---|---|
It is not possible to use another detector to create clean hadron samples to study the detector performance. However, it is possible to use decaying particles for the same purpose. Samples of , and mesons as well as hyperons were used to determine the identification efficiencies for pions, kaons and protons. The momentum integrated results (p2 GeV) are shown in table 6. The MC values in table 5 and the experimental values in table 6 cannot be compared directly, because the efficiencies depend strongly on the particle momentum as well as on the event topology.

This dependence on the event topology can be excluded by comparing subsamples with only one track per detector half. Figure 23 compares MC and experimental data for the case of single track pions. The four plots show the identification probabilities that a pion is identified as pion, kaon, proton or not identified (). The pion identification efficiency for single tracks is above 92% even at low momenta, and above 98% for momenta larger than 4 GeV. The MC data are taken from the sample also used for table 5, while the experimental data are from -decays. MC and experimental results agree well,with the possible exception of the lowest moment bin.
The comparison of MC and experimental data becomes more involved for event topologies with overlapping rings and as the opening angle for -decays in HERMES is small there are basically no experimental data with one single kaon per detector half. A detailed evaluation of the detector performance that takes the event topology and momentum dependence into account in detail will be included in a forthcoming paper.
7 Conclusion and Outlook
The HERMES RICH detector has been constructed and installed within 13 months after its approval. It has been operating routinely as part of the HERMES experiment since its installation in May 1998. Its operation has been stable and reliable for more than two years. The single photon resolution for ideal tracks is close to the MC predictions. The particle identification based on the inverse ray tracing technique has been implemented and its likelihood analysis has been optimized. More elaborate particle identification schemes are under development. Hadron identification by the RICH detector will be a crucial feature of the analysis of the current (1998 - 2000) and future HERMES data.
8 Acknowledgements
We gratefully acknowledge the DESY management for its support and the DESY staff and the staffs of the collaborating institutions for their strong and enthusiastic support. It is a pleasure to acknowledge the assistance of R. Romeo of Composite Mirror Applications in the installation and initial alignment of the mirror array, and valuable consultations with the SELEX group at FNAL during the design of the HERMES RICH. This work was supported by the FWO-Flanders, Belgium; the INTAS (project 96-274), HCM, and TMR network contributions (ERBFMRXCT960008) from the European Community: The German Bundesministerium für Bildung, Wissenschaft, Forschung and Technologie; the Deutscher Akademischer Austauschdienst (DAAD); the Italian Istituto Nazionale di Fisica Nucleare (INFN); Monbusho, JSPS, and Toary Science Foundation of Japan; the U.S Department of Energy; and the U.S. National Science Foundation.
References
- [1] HERMES Collaboration, K. Ackerstaff et al., Nucl. Inst. Meth. A417 (1998) 230.
-
[2]
E. Cisbani et al.,
HERMES internal note 97-003(1997) -
[3]
J. Seguinot and T. Ypsilantis,
Nucl. Instr. and Meth. A343 (1994) 1. -
[4]
H. Yokogawa and M. Yokoyama.,
J. Non-Cryst. Solids 186 (1995) 23. -
[5]
I. Adachi et al.,
Nucl. Instr. and Meth. A355 (1995) 390. -
[6]
H. Burkhardt et al.,
Nucl. Instr. and Meth. 184 (1981) 319. -
[7]
D.E. Fields et al.,
Nucl. Instr. and Meth. A349 (1994) 431. -
[8]
R. Forty and O. Schneider,
internal note LHCb/98-40 -
[9]
T. Ypsilantis and J. Seguinot,
Nucl. Instr. and Meth. A343 (1994) 30. -
[10]
E. Cisbani, PhD thesis,
La Sapienza University, Rome, 1998. -
[11]
L.F. Zhang, Thesis,
Tokyo Institute of Technology, 1999
HERMES internal note 99-064 -
[12]
E. Aschenauer et al.,
Nucl. Instr. and Meth. A440 (2000) 338. -
[13]
R. De Leo et al.,
Nucl. Instr. and Meth. A401 (1997) 187. - [14] P. Carter, PhD thesis, CalTech, 1999.
- [15] P.C. Chen, T.T. Saha, A.M. Smith, R.C. Romeo, Optical Eng. 37, No. 2 (1998).
-
[16]
E. Aschenauer et al.,
Nucl. Instr. and Meth. A433 (1999) 168. -
[17]
M. Pommot Maia et al.,
Nucl. Instr. and Meth. A326 (1993) 496. -
[18]
R. Kaiser et al.,
Online Monitoring at HERMES,
Proc. of CHEP97, Berlin, April 1997. -
[19]
W. Wander,
DAD-Distributed ADAMO Database System at HERMES, Proc. of CHEP95, Rio de Janeiro, 1995 -
[20]
K. Ackerstaff and M.-A. Funk,
PinK: A Tcl/Tk based Database Interface to ADAMO and DAD, Proc. of CHEP95, Rio de Janeiro, 1995 -
[21]
R. De Leo et al.,
Chromatic aberration and forward scattering of light in silica aerogel,
Nucl. Instr. and Meth., in press