SLAC-AAS-97
KEK-ATF-11
October 2000
Bunch Length Measurements at the
ATF Damping Ring in April 2000
111Work supported by
Department of Energy contract DE–AC03–76SF00515.
K.L.F. Bane,
Stanford Linear Accelerator Center, Stanford University,
Stanford, CA 94309, USA
T. Naito, T. Okugi, and J. Urakawa
High Energy Research Organization (KEK),
Oho 1-1, Tsukuba, Ibaraki, Japan
Bunch Length Measurements at the
ATF Damping Ring in April 2000
1 Introduction
We want to accurately know the energy spread and bunch length dependence on current in the ATF damping ring. One reason is to know the strength of the impedance: From the energy spread measurements we know whether or not we are above the threshold to the microwave instability, and from the energy spread and bunch length measurements we find out the extent of potential-well bunch lengthening (PWBL). Another reason for these measurements is to help in our understanding of the intra-beam scattering (IBS) effect in the ATF. The ATF as it is now, running below design energy and with the wigglers turned off, is strongly affected by IBS. To check for consistency with IBS theory of, for example, the measured vertical beam size, we need to know all dimensions of the beam, including the longitudinal one. But beyond this practical reason for studying IBS, IBS is currently a hot research topic at many accelerators around the world (see e.g. Ref. [1]), and the effect in actual machines is not well understood. Typically, when comparing theory with measurements fudge factors are needed to get agreement (see e.g. Ref. [1]). With its strong IBS effect, the ATF is an ideal machine for studying IBS, and an indispensable ingredient for this study is a knowledge of the longitudinal phase space of the beam.
The results of earlier bunch lengthening measurements in the ATF can be found in Refs. [2]-[4]. Measurements of current dependent effects, especially bunch length measurements using a streak camera, can be difficult to perform accurately. For example, space charge in the camera itself can lead to systematic errors in the measurement results. It is important the results be accurate and reproducible. In the measurements of both December 1998[3] and December 1999[4], by using light filters, the authors first checked that space charge in the streak camera was not significant. And then the Dec 99 authors show that their results agree with those Dec 98, i.e. on the dates of the two measurements the results were reproducible.
Since IBS is so strong in the ATF, in the Dec 99 measurements an attempt was made to estimate the impedance effect using the following method: First, from the form of the energy spread vs. current measurements it was concluded that the threshold to the microwave instability was beyond 2 mA. Then, by dividing the bunch length vs. current curve by the energy spread vs. current curve the effect of IBS was divided out, and PWBL was approximated. The assumption is that PWBL can be treated as a perturbation on top of IBS. The result was that this component of bunch lengthening was found to grow by 7-15% (depending on the rf voltage) between the currents of .5 mA and 2 mA, about a factor of 3 less than the total bunch length growth. The conclusion was that the inductive component of the impedance was small, in fact much smaller than had been concluded earlier in Ref. [2].
Electron machines generally run in a parameter regime where IBS is an insignificant effect, and impedance measurements and calculations have also normally been performed for machines where IBS is unimportant. To simplify the interpretation of the impedance from bunch length measurements, in April 2000 the energy spread and bunch length measurements of Dec 99 were repeated, but now with the beam on a linear (difference) coupling resonance, where the horizontal and vertical emittances were approximately equal. For this case the effect of IBS was expected to be very small. An energy spread vs. current measurement under such conditions will also allow us to more clearly see whether we reach the threshold to the microwave instability. As part of the April data taking we, in addition, repeated the earlier off-coupling measurements, in order to check the reproducibility of the earlier results. In this report we present and analyze this recent set of data, and compare it with the results of the earlier measurements, particularly those of Dec 99.
The measurements and analysis of data in this report follow essentially the same procedure as was used in Ref. [4]. In the present report we will try to be relatively brief. The comparison of our results with IBS theory will be given in a following report. For more details about the measurement and analysis techniques presented in this report, the reader should consult Ref. [4].
2 Energy Spread Measurements
Energy spread vs. current measurements were performed on March 21-22, 2000, with the beam both on and off the coupling resonance, for rf voltages of kV and 300 kV. As usual the beam width is measured after extraction on a thin screen in a dispersive region. The data is fit to a Gaussian, yielding the rms energy spread (see Fig. 1). (For these measurements the energy spread was not calibrated, but from earlier experience we expect the zero value results to be near , which allows us to estimate the scaling factor.) In the figure the points in the plots are fit to .
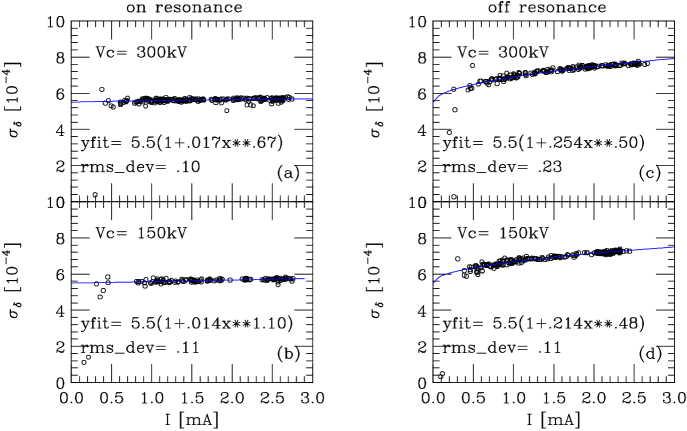
We note from Fig. 1 that, as expected, on the coupling resonance the energy spread is almost independent of current, only increasing by 3-4% by 2.5 mA. With the vertical beam size enlarged, the effect of intra-beam scattering becomes small. Off the coupling resonance the change by 2.5 mA is 35-40%. We also note in (a) and (b) that there is no evidence of the threshold to the microwave instability, whose signature would be a kink in the data. If there is no microwave instability on resonance, then almost certainly there is no microwave instability off resonance, since in the latter case the longitudinal phase space volume is increased, which tends to stabilize the beam. Finally, note that the 150 kV and 300 kV on-resonance results are statistically identical, as would be expected in the case of no microwave instability and negligible intra-beam scattering. Note also that for the off-resonance results the energy spread is slightly larger for the higher voltage. This would be expected, since a higher voltage means a smaller bunch length, which increases intra-beam scattering, which, in turn, more increases the energy spread.
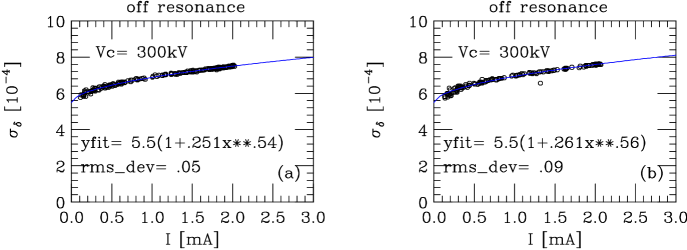
The measurements were repeated for the nominal (off-resonance, kV) settings on April 13 and 14 (see Fig. 2), just before and after the bunch length measurements to be presented in the next section. We note that the results of the two measurements are essentially the same, and they are also essentially identical to the March results with the beam off-resonance and kV (Fig. 1c). This indicates that the machine conditions, as concerns intra-beam scattering (the horizontal and vertical beam sizes; the lattice), are the same during all these measurements, as well as during the off-coupling, bunch length measurements presented below.
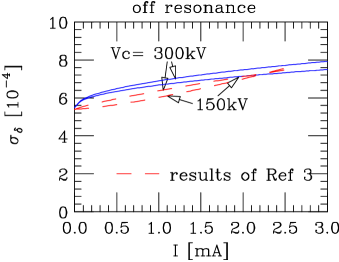
Finally, in Fig. 3 we compare the fits to the and 300 kV, off-coupling measurements with those to measurements—under the same conditions—taken in Dec 99 and presented in Ref. [4]. We note that the corresponding curves for the two dates are significantly different. For example, for kV and mA the new results are 8% higher than the earlier results. This suggests that (when off coupling) the machine, concerning intra-beam scattering, was significantly different for the two dates.
3 Bunch Length Measurements
For the streak camera measurements first, to make sure that space charge in the camera itself was not a problem, tests were made at the highest current (2.5 mA) with different light filters, and an appropriate filter was chosen. Then, the main data taking process consisted of storing a high current beam and measuring the longitudinal bunch profile times at fixed time intervals, while the current naturally decreased. Each trace, along with its DCCT current reading, was automatically saved to disk. To let in more light at the lower currents the light filter was automatically switched half-way through each data taking sequence. Measurements were performed with the beam on and off the coupling resonance, and with 4 different settings of rf voltage.
As before the streak camera traces were fit to an asymmetric Gaussian, given by
| (1) |
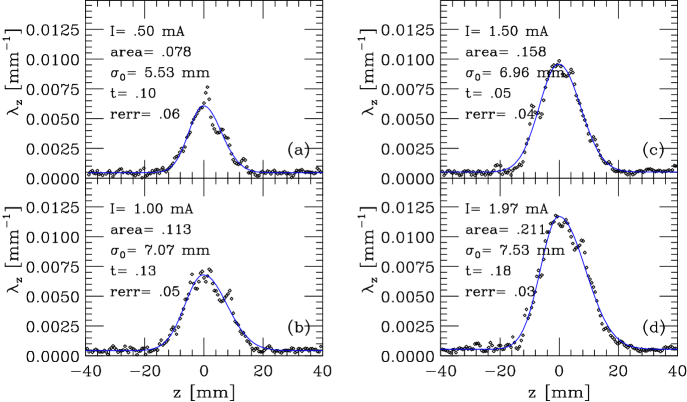
with the convention that more negative values of are more to the front of the bunch. The fitting constants are , , , and the asymmetry factor (a constant, platform offset is also included in the fit). Note that the full-width-at-half-maximum (FWHM) of the fit is and the rms bunch length . For small , . The skew moment, defined by , is given by , for small . Note also that from physical considerations, we generally expect , i.e. the leading edge of the distribution to be steeper than the trailing edge. Four example scans, with their fits, are shown in Fig. 4. We note that the fits are reasonably good, though we see some, what are likely anomalous, deviations from the fits in the data. We have lots of data and we will use the statistical Method of Maximum Likelihood to do the error analysis[5].
The results for the beam on the coupling resonance and for rf voltages , 200, 250, 300 kV are given in Figs. 5-8, and for the beam off the coupling resonance in Figs. 9-12. Shown are the parameters of the asymmetric Gaussian fit to the measured profiles: the area (a), the rms (b), the asymmetry factor (c), and an estimate of the relative rms error in the fit (d). Plots (a)-(c) give the zeroth, the second, and the third moments of the charge distribution. The line in (b) is a straight line fit to the bunch length, where each data point has been weighted inversely by the variance in the fit to the asymmetric Gaussian [note that for the fit ]. The line in (c) is a straight line fit to .
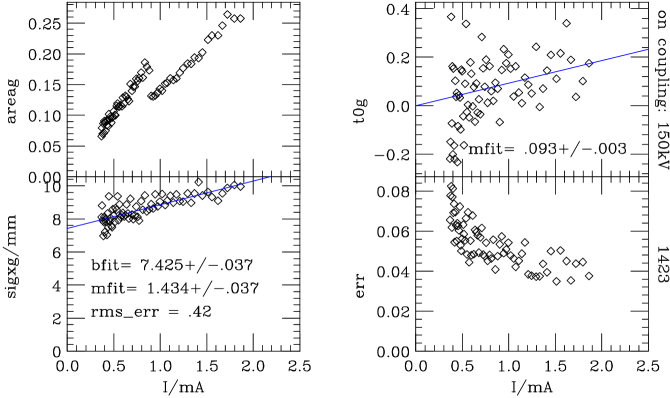
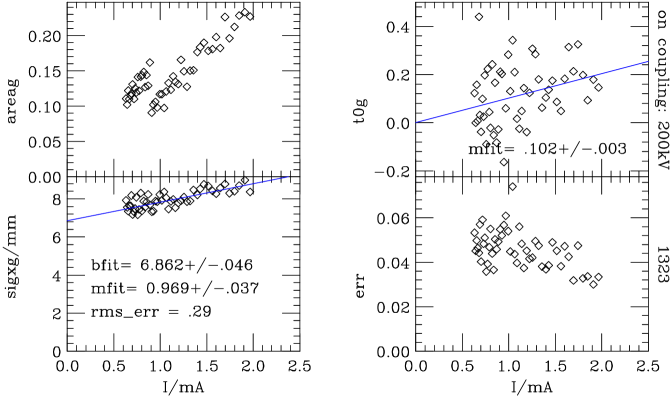
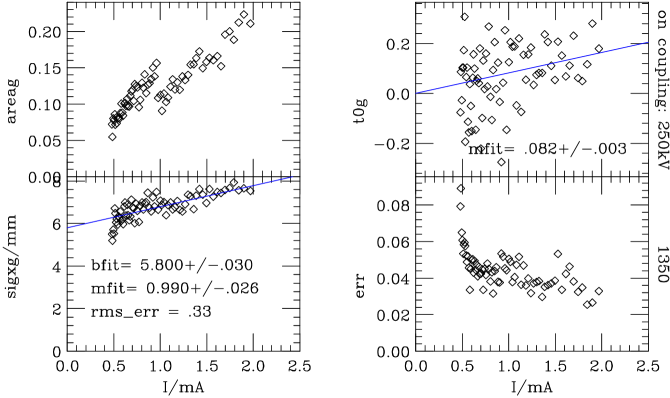
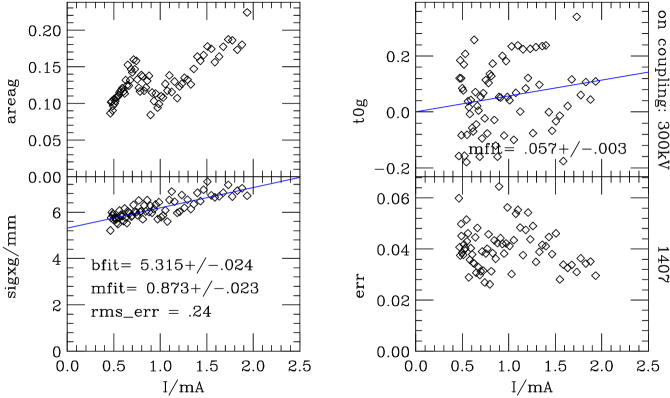
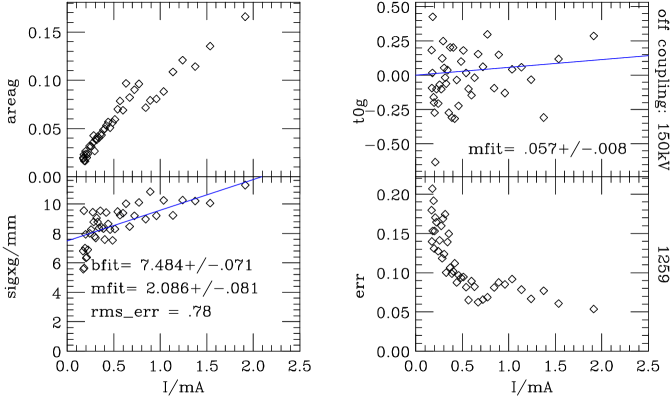
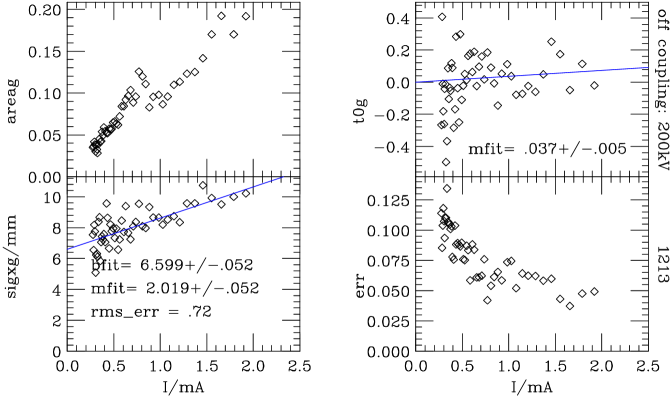
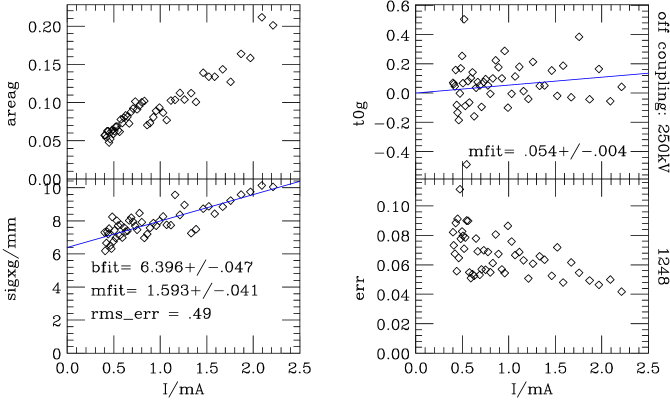
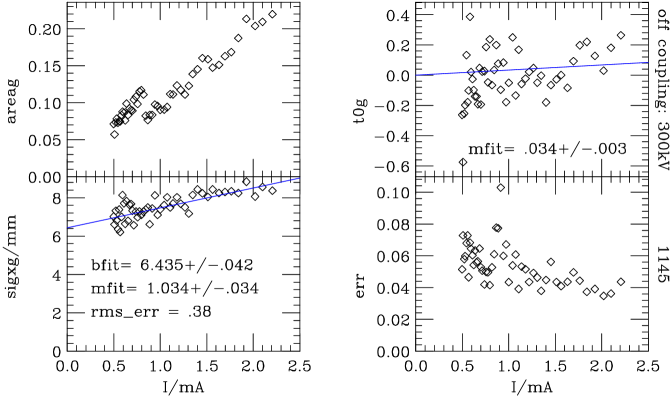
In the (a) part of the figures we note that the area is roughly proportional to current—with the constant of proportionality different for the low and the high current results due to the two different light filters used—though with some scatter in the data. In (b) we note that the scatter in the measured bunch lengths is quite significant, especially at the lower currents, with an rms deviation from the straight line fit varying from .35-.80 mm. In (c) we see even more scatter in the asymmetry factor. We expect this parameter to start at zero, and to increase with increasing current, and the data does seem to support an increasingly positive asymmetry factor with current. The results are near .1/mA, and slightly decrease with voltage. We will show in a future ATF report that this parameter gives us information about the higher mode losses and the real part of the impedance. Note that the measured asymmetry factors off-resonance are about half of those on-resonance, qualitatively consistent with the bunch being longer, and the higher mode losses being less, when off-resonance. Finally, in (d) we note that the relative rms error in the fit to the asymmetric Gaussian is 4-10%. There is more noise than in the measurements of Dec 99, reflected in the fact that the fits then were twice as good.
3.1 Comparisons and Discussion
In Fig. 13 we reproduce the linear fits to the bunch length parameter for the measurements with the beam off the coupling resonance (the solid lines). Note that these fits are not valid below mA, where there is no data; in fact, the bunch lengths are expected to drop below these lines for lower currents. In (a) the results are compared with the on-coupling results; in (b) with off-coupling results of Dec 99. In all cases the bunch length curves move up as the voltage moves down, as expected. Also, in (a) the bunch length is larger off the coupling resonance than on, due to the effect of intra-beam scattering, as expected.
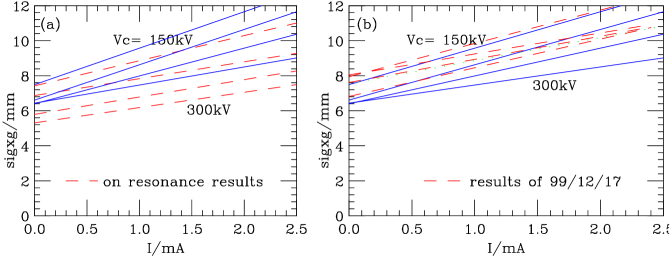
We expect , for kV, to be 6.2 mm. For the case of on-resonance, we find the value at the origin of the curves to be 3.7%, 10.4%, 4.6%, 5.0% larger than the zero value calculation for , 200, 250, 300 kV, respectively. For the case of off-resonance the values are 4.5%, 6.4%, 15.3%, 27.1% larger than the zero value calculations. We expect the real bunch lengths to follow curves with negative curvature, so an overshoot is not unexpected. Note that these overshoots are significantly less than the for the Dec 99 results (see Fig. 13b), which, at the time, made us suspect a scaling error in the streak camera results.
In Sec. 2 we saw that, for the on-coupling case, the energy spread was almost independent of current. For example, by mA the energy spread has grown by only 3%. Here we see that at mA the bunch length has grown by 33-39%, depending on the rf voltage. Since IBS on the coupling resonance is very weak, this growth must be almost entirely due to PWBL. Thus, it appears that, after all, PWBL is a big factor in the ATF, and the machine must have a large inductive component of impedance. Note that this conclusion is different from that reached in Dec 99, where PWBL was estimated by dividing the bunch lengthening off-resonance by the energy spread growth. There it was found, for example, that the PWBL contribution to the bunch length at 2 mA, divided by the contribution at .5 mA, ranged from 7-15% depending on voltage. Here the equivalent (on-coupling) results range from 18-26%, a marked difference. Or, if we try to compare the present on and off-coupling results using the same prescription, we find that off-coupling the results are increases of 21.4% and 6.1%, for respectively the case and 300 kV; on-coupling the results are 23.5% and 20.1%. These also don’t agree. In making the earlier approximate calculation of PWBL we had assumed that PWBL can be treated as a perturbation on top of IBS. That is, we assumed that (1) PWBL doesn’t affect IBS significantly and (2) the bunch length increase due to PWBL can be added on top of that due to IBS, and the result would be similar whether on or off resonance. It appears that these assumptions taken together are wrong and the interaction of IBS and PWBL is, in fact, more complicated.
In Fig. 13b we note that the new off-coupling results are very different from those of Dec 99. We saw in Sec. 2 above that the energy spread vs. current was different for the two measurement days, presumably due to a difference in the IBS effect, so we would expect differences also in bunch length, since it is also affected by IBS. In addition the bunch length (below threshold) is affected by the impedance through PWBL. To say more, quantatively, about such measurements we would need a better understanding of how IBS and PWBL interact and, in addition, a knowledge of the transverse beam sizes and optics on the days of the measurements.
4 Conclusions
We have performed energy spread and bunch length measurements with the beam on and off the coupling resonance. Our energy spread results show that, with the beam on-resonance, the effect of intra-beam scattering is small, and that the threshold to the micro-wave instability is beyond 2.5 mA. Our on-resonance bunch length results show that potential well bunch lengthening is large—by 2 mA the bunch has lengthened by 33-39%—indicating that the impedance has a large inductive component.
Our energy spread and bunch length measurements with the beam off-resonance give results that are very different from those of Dec 99. This suggests that the horizontal and vertical emittances and/or the lattice were different than during the earlier measurements, resulting in a different intra-beam scattering effect. These measurements should be repeated both on and off the coupling resonance, under the same conditions—verifiable by finding the same energy spread vs. current curves—to see if the bunch length measurements are reproducible. We have assumed here that the streak camera measurements are sufficiently accurate for our purposes. The results appear to be consistent, but we have no independent way of checking their accuracy. (We might suggest installing in the ATF, sometime in the future, a bunch length measuring apparatus that works in a completely different way, such as the spectrum approach of Ref. [6], as an independent check on the streak camera results.)
In the future, when doing any such current-dependent measurements the energy spread vs. current measurement should always be performed, as a specifier of the intra-beam scattering machine conditions, and since it is a rather quick and simple measurement. To study specifically impedance questions, measurements should be performed with the beam on the coupling resonance, where intra-beam scattering is very weak. With the beam off-resonance, bunch length and energy spread measurements are important ingredients, along with the horizontal and vertical emittances and optics, for attempting a full understanding of intra-beam scattering and its interaction with the impedance in the ATF damping ring.
5 Acknowledgements
One of the authors (K.B.) thanks the ATF scientists and staff for their hospitality and help during his visits to the ATF, and M. Ross for his encouragement and support to make such visits.
References
- [1] C. Kim, “A Three-Dimensional Touschek Scattering Theory,” LBL-42305, September 1998.
- [2] H. Hayano, et al, “Impedance Measurement of ATF DR,” Proc. of EPAC 1998, Stockholm, Sweden, May 1998, p. 481.
- [3] K. Bane, et al, “Bunch Lengthening and Current-Dependent Energy Spread at ATF,” ATF Report 98-38, December 1998.
- [4] K. Bane, T. Naito, T. Okugi, “Bunch Length Measurements at the ATF Damping Ring in 1999,” ATF Report 00-05, May 2000.
- [5] See, for example, P. Bevington and K. Robinson, Data Reduction and Error Analysis for the Physical Sciences, Second Edition, (McGraw-Hill, Inc., New York, 1992).
- [6] T. Ieiri, “Measurement of Bunch Length Based on Beam Spectrum at KEKB Rings,” Proc. of EPAC 2000, Vienna, Austria, June 2000, p. 1735.