The Longitudinal Polarimeter at HERA
Abstract
The design, construction and operation of a Compton back-scattering laser polarimeter at the HERA storage ring at DESY are described. The device measures the longitudinal polarization of the electron beam between the spin rotators at the HERMES experiment with a fractional systematic uncertainty of 1.6 %. A measurement of the beam polarization to an absolute statistical precision of 0.01 requires typically one minute when the device is operated in the multi-photon mode. The polarimeter also measures the polarization of each individual electron bunch to an absolute statistical precision of 0.06 in approximately five minutes. It was found that colliding and non-colliding bunches can have substantially different polarizations. This information is important to the collider experiments H1 and ZEUS for their future longitudinally polarized electron program because those experiments use the colliding bunches only.
keywords:
Polarized Compton scattering; Electron polarimetryPACS:
29.20.Dh; 29.27.Bd; 29.27.Fh; 29.27.Hj, , , , , , , , , , , , , ,
1 Introduction
In high-energy storage rings, electron (positron) beams can become transversely polarized through the emission of synchrotron radiation [1]. This process involves a small asymmetry in the spin-flip amplitudes, which enhances the population of the spin state antiparallel (parallel) to the magnetic bending field. The polarization develops in time according to
| (1) |
where the asymptotic polarization and the time constant are characteristics of the ring conditions. In the absence of depolarizing effects, the maximum polarization theoretically achievable is , and the rise-time constant, which depends on the bending radius of the storage ring and the beam energy, is min for the HERA storage ring operated at an energy GeV.
Depolarizing effects can however substantially reduce the maximum achievable polarization. These intricate effects cannot generally be precisely controlled, making it necessary to continuously measure the beam polarization. The depolarizing effects also affect the actual rise-time, which scales with according to
| (2) |
Thus for a typical beam polarization of 0.55, the rise-time is about 22 min.
This article describes a polarization monitor at the HERA electron ring at DESY, which is based on Compton scattering of circularly polarized photons from an intense pulsed laser beam. This method for measuring the polarization of stored electron beams111electron beams refer to both, electron and positron beams for the remainder of this article was suggested more than 30 years ago [2], and has been employed at many laboratories [3] to measure the transverse polarization. Compton scattering has also been employed at linear accelerators [4] to measure the longitudinal polarization. In recent years, the NIKHEF [5] and MIT-Bates [6] laboratories have developed Compton polarimeters to monitor the longitudinal beam polarization in their storage rings. At DESY, a Compton polarimeter [7] had been constructed in 1992 to measure the transverse polarization of the electron beam in the HERA West section. This Transverse Polarimeter measured the electron beam polarization with an initial fractional systematic uncertainty of 9 %, which has subsequently been improved to 3.4 % [8].
The Longitudinal Compton Polarimeter was added to obtain an independent and more precise measurement of the beam polarization at HERA, with very different systematic uncertainties and the capability to measure individual bunch polarizations. It was commissioned during fall 1996, and provides a measurement of the longitudinal beam polarization in the East section of HERA between the spin rotators [9] at the HERMES experiment [10].
2 Polarized Compton Scattering
The cross section for Compton scattering of circularly polarized photons off longitudinally polarized electrons can be written [11] in the laboratory frame as
| (3) |
where is the unpolarized cross section, is the energy of the back-scattered Compton photons, is the circular polarization of the incident photons for the two helicity states , is the longitudinal polarization of the electron beam, and is the longitudinal asymmetry function, which is shown in Fig. 1 for a 2.33 eV photon scattered off a 27.5 GeV electron.

The total unpolarized cross section is 377 mb, and the differential cross section is peaked at the maximum energy ( GeV) of the back-scattered Compton photons, hereafter called the Compton edge. The longitudinal asymmetry function has a maximum of about 0.60 at the Compton edge. As the energy of the Compton photons decreases, decreases rapidly and becomes negative below 9.1 GeV, corresponding to scattering angles smaller than in the electron rest frame, and returns to zero at . Due to the enormous kinematic boost from the electron beam (the Lorentz factor is ), most back-scattered Compton photons are contained in a narrow cone centered around the initial direction of the struck electrons. This is very advantageous to a polarization monitor because it allows the detector to be far away (many tens of meters) from the interaction region. However, the spatial distribution of the Compton photons on the detector surface is given not only by the Compton kinematics but also by the electron beam optics. Therefore, if the interaction point is chosen at a position where the divergence of the electron beam is small, the transverse size of the photon detector can be sufficiently small to accommodate only moderate separations of the Compton photons and the electron beam, and thus meet the spatial constraints given by the HERA electron ring.
3 Apparatus
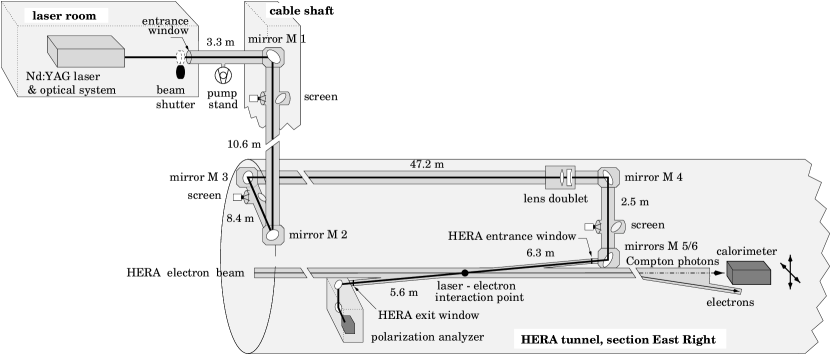
A schematic overview of the Longitudinal Polarimeter arrangement is shown in Fig. 2. A circularly polarized photon beam from a pulsed laser is focused on the HERA electron beam. The laser-electron interaction point is located between the two bending magnets BH39 and BH90 at 39 m and 90 m from the HERMES target, respectively. A calorimeter measures the energy of the back-scattered Compton photons for each laser pulse. If the electron beam is longitudinally polarized, the energy distributions of the Compton photons differ for left-handed and right-handed photon helicities.

3.1 Laser and Optics
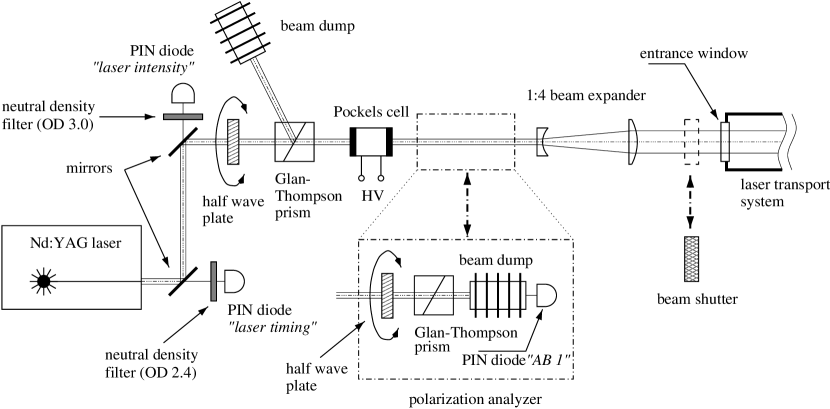
A frequency-doubled, pulsed Nd:YAG laser [12] operated at 532 nm, corresponding to a photon energy of eV, is used for the measurements. The laser produces ns long pulses of linearly polarized light and can be operated with a continuously variable repetition rate from single shot up to 100 Hz, and pulse energies from 1 to 250 mJ. The laser is synchronized with the electron bunches in the HERA ring, and triggered at close to 100 Hz. The timing and the intensity of each laser pulse are measured by two photo diodes as shown in Fig. 3. To minimize pulse-to-pulse intensity fluctuations, the laser is operated at a fixed energy of 100 mJ per pulse. The intensity of the laser pulses can be controlled by passing the laser beam through a rotatable half wave plate and a fixed Glan-Thompson prism.
The linearly polarized laser light is converted to a circularly polarized beam by passing it through an electrically reversible birefringent cell, known as a Pockels cell. The voltage on the Pockels cell [13] is adjusted to produce a quarter wave phase shift which is reversed each pulse. The degree of circular polarization of the laser beam is larger than 0.999 for each of the two helicity states , and is checked regularly with a polarization analyzer [14] consisting of a rotatable half wave plate, a Glan-Thompson prism, and a photo diode. Before entering the laser transport system, the beam diameter is expanded by a factor of four by a set of plano-concave and plano-convex lenses [15]. This beam expander reduces the divergence of the laser beam to allow it to traverse the m long light path to the laser-electron interaction region and also to reduce the resulting waist at the interaction point. In addition, it minimizes the sensitivity to variations in the laser beam divergence, and it reduces the energy density of the laser beam to prevent damage to the optical components in the light path.
The laser beam is guided by six remotely controlled mirrors [16] through a total of m of stainless steel vacuum pipe, and focused with a lens doublet [17] on the HERA electron beam, as shown in Fig. 4. The mirrors are arranged in three phase-compensated pairs to maintain the polarization of the photon beam close to 100 %. Behind each mirror, a video camera is installed to monitor the laser beam position. The laser beam enters the storage ring vacuum through a cm thick fused silica window [18] and is brought into collision with the electron beam at a vertical angle of 8.7 mrad. The window was mounted with Helicoflex gaskets [19] to minimize stress such that it has negligible optical retardation.
At the interaction point, the laser spot has a diameter of approximately 0.5 mm, and the transverse size of the electron beam is 0.6 mm horizontally and 0.2 mm vertically. Each electron bunch is approximately mm long (corresponding to 37 ps), i.e. about one hundred times shorter than the laser pulse. After passing through the interaction point, the laser beam exits the storage ring vacuum system through an identical vacuum window and enters a second polarization analyzer which also monitors the position and the intensity of the laser light.
3.2 LaserElectron Interaction Region
The location of the laser-electron interaction region was chosen to optimize the rate of the back-scattered Compton photons versus the background rate, and to minimize changes to the electron ring vacuum system. Maximizing the Compton rate means that the crossing angle between the laser beam and the electron beam should be as small as possible, and the horizontal widths of the electron and laser beams should both be small. In addition, the transverse spatial distribution of the back-scattered Compton photons due to the size and divergence of the electron beam had to be minimized, since the back-scattered photons have to travel about 54 m to the calorimeter.
The laser-electron interaction point is located in the East Right HERA tunnel section, 13 m downstream of the first dipole magnet BH39, which bends the beam by 0.54 mrad (Fig. 2). This is enough to prevent a large fraction of the bremsstrahlung generated by the residual gas in the long straight vacuum section upstream of BH39, and by the HERMES gas target in particular, from reaching the calorimeter. On the other hand, it is little enough that it rotates the spin by only 1.9∘. The corresponding reduction of the measured longitudinal beam polarization is negligible (0.06 %).
The scattered electrons and photons travel with the unscattered electron beam until the electrons are deflected by the dipole magnet BH90, which has a bending radius of 1262 m and deflects the beam by 2.7 mrad. A collimator is installed in the beam line 6 m downstream of BH90 to further reduce possible bremsstrahlung contributions from the HERMES target. In order to minimize changes to the electron ring vacuum system, the calorimeter position was chosen 16 m downstream of BH90. This puts strict constraints on the transverse size of the calorimeter, since the electron beam and the center of the back-scattered Compton photon distribution are separated by only 42 mm at the chosen position.
3.3 The Compton Photon Detector
The detector assembly is mounted on a remotely controlled table that can be moved vertically and horizontally. A light tight aluminum box contains the electromagnetic shower detector shown schematically in Fig. 5. The detector is positioned very close to the electron beam pipe during normal operation. Therefore, the lateral face of the box near the beam pipe is made of a mm thick tungsten plate to protect the detector against soft synchrotron radiation emerging from the beam pipe.
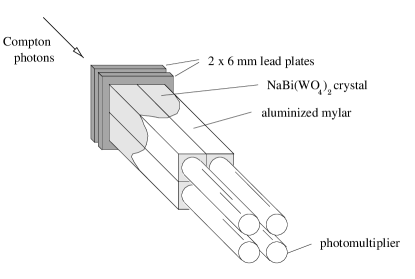
The front of the detector is positioned 21 mm downstream of a copper vacuum window in the HERA beam tube. This window is 2 mm thick and 34 mm in diameter. The Compton photons enter the detector through a set of two mm ( radiation lengths) thick lead plates, which serves as an effective shield against the intense synchrotron radiation generated by the dipole magnet BH90. The electromagnetic calorimeter consists of four optically isolated NaBi(WO4)2 crystals. Each crystal is 20 cm long (19 radiation lengths), 22 mm wide and 22 mm high, arranged in a array, as displayed in Fig. 5. The crystal material has a high index of refraction (), and is very radiation-hard ( rad) [20, 21] and compact (Molière radius 2.38 cm). The Compton photons generate an electromagnetic shower in the lead preshower and the crystals. The charged particles of the electromagnetic shower produce Čerenkov light, which is detected by one photomultiplier tube [22] for each crystal. The sharing of the shower between the four calorimeter blocks allows a sub-millimeter alignment of the NaBi(WO4)2 array with respect to the Compton photon beam.
3.4 Trigger and Electronics
The event trigger is provided by a pulser at a rate of approximately 200 Hz. The laser is fired by only every second pulse, allowing a background event to be recorded following each Compton event. Each laser pulse is synchronized with the HERA bunch clock, which is provided by a bunch trigger module (BTM) [23]. The BTM is also used to select a specific electron bunch in a sequence determined by a programmable Digital Signal Processor (DSP) [24]. Four consecutive events are recorded for each selected bunch: for each of the two light helicity states, one background event and one event where the laser was fired. The program of the DSP further provides the option of scanning any subset of the beam bunches in any sequence. From the recorded single bunch data, one can extract the polarization of a single bunch, the average beam polarization of all the bunches, or the polarization of any set of bunches, e.g. only colliding or non-colliding bunches. The trigger also allows for pedestal or gain monitoring events during empty HERA beam bunches. The HERMES gain monitoring system [10] monitors the response of the Compton photon detector by sending laser light pulses through glass fibers that are coupled to the front faces of the NaBi(WO4)2 crystals.
The signals from the four photomultiplier tubes are digitized by a charge sensitive ADC [25], and transferred by the DSP to the HERMES data acquisition system, which is described in detail elsewhere [10]. Also the signals from the various photodiodes are recorded. For each Compton event, the timing of the laser pulse measured by the “laser timing” PIN diode (see Fig. 3) is recorded relative to the bunch timing by a TDC [26].
4 Polarimeter Operation
Normal operation of the Longitudinal Polarimeter requires an optimum overlap of the laser and electron beams in both space and time to maximize the back-scattered Compton rate. The spatial overlap is achieved by steering the laser beam horizontally through the interaction point with mirror M4 (see Fig. 4). The timing of the laser pulse is set with respect to the electron bunches by adjusting the laser trigger delay for maximum luminosity.
The luminosity is monitored continuously by the polarimeter control system [27]. If the luminosity drops below a specified value, the procedures described above are executed automatically to re-optimize it. This online feedback system also ensures that the calorimeter remains centered on the back-scattered Compton photon distribution, and that the startup and shutdown of the laser system are executed automatically. Therefore, under normal conditions, polarization measurements are performed without intervention during HERA operation.
The detector can be operated in two different modes, the single-photon and the multi-photon mode. In contrast to the single-photon mode, in which the energy of each individual Compton photon is analyzed, in the multi-photon mode one measures the total energy deposited in the detector by many Compton photons per laser pulse interaction with an electron bunch. The multi-photon mode was chosen as the standard mode of operation to provide high statistics single bunch measurements in real time, and to overwhelm the bremsstrahlung backgrounds originating from the residual vacuum pressure in the straight section between the two dipole magnets BH39 and BH90. The single-photon mode is used for test and diagnosis purposes only.
4.1 Single-Photon Mode
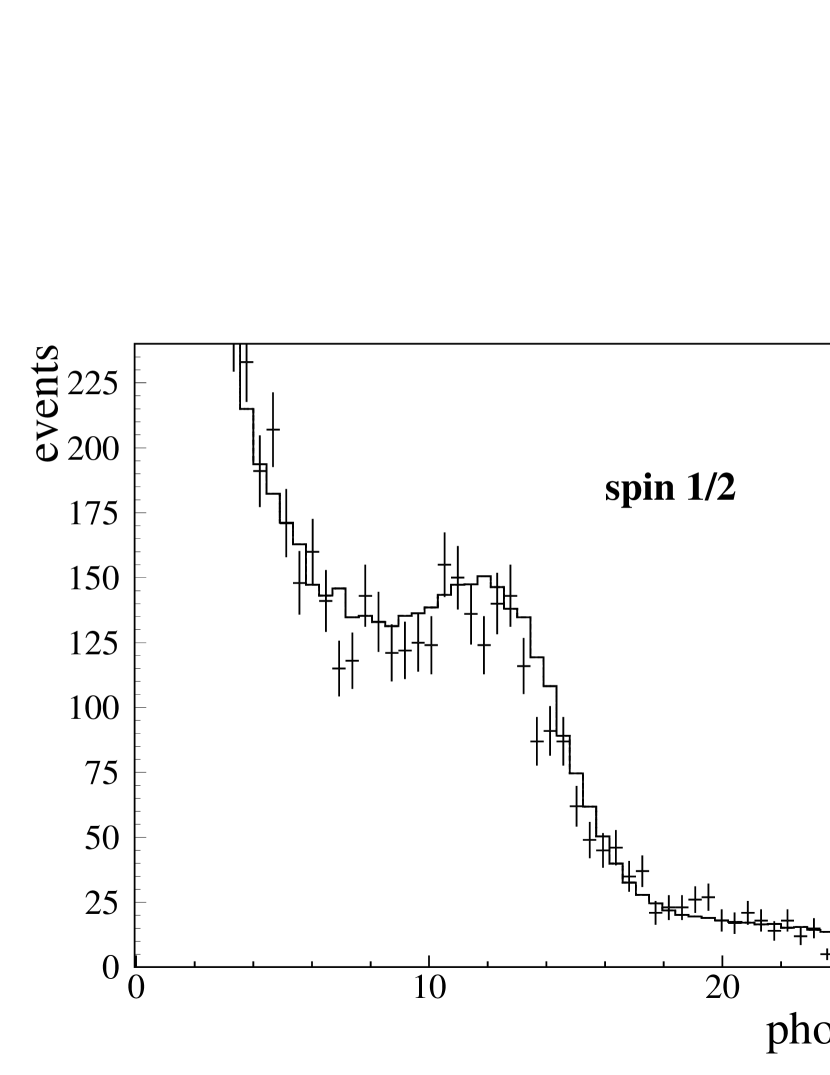
The advantages of running in single-photon mode would be twofold. The asymmetries are large, up to 0.60 at the Compton edge (see Fig. 1), and the energy spectra can be compared to the Compton cross sections. Operation of the Longitudinal Polarimeter in this mode is possible if the laser pulse intensity is drastically reduced. However, the resolution for single-photon events is rather poor, as shown in Fig. 6, because most of the generated Čerenkov light is trapped in the crystals and does not reach the photomultiplier tubes due to the high index of refraction of the crystals and the mm air gap between the crystals and the photomultiplier tubes. While Compton spectra can be produced, and the beam polarization can be extracted, this is not a feasible mode of operation with the 100 Hz laser, since a measurement of the beam polarization with an absolute statistical accuracy of 0.01 takes about 2.5 hours. In comparison, such a measurement takes only one minute in the multi-photon mode.
In the single-photon mode, the asymmetry can be written as
| (4) |
where and are the cross sections for the electron-photon configurations where the incident spins are antiparallel and parallel, respectively, and is the average circular light polarization.
The electron beam polarization is determined by fitting the energy spectra for the two spin configurations using a simulation (solid line in Fig. 6) that includes the response function and resolution of the detector, and realistic background conditions [28] above a Compton photon energy of 4 GeV. Whereas the simulation represents the data well above 4 GeV, it considerably underestimates the background at lower energies.
4.2 Multi-Photon Mode
The operation of the Longitudinal Polarimeter in multi-photon mode has the advantage of being effectively independent of bremsstrahlung background in the HERA storage ring. A large number of Compton photons is produced each time a laser pulse interacts with an electron bunch. These photons are detected together by the calorimeter, which measures their energy sums and for the spin- and spin- electron-photon configurations, respectively. In the multi-photon mode, an energy asymmetry is formed as
| (5) |
where is the analyzing power of the process. Under the assumption that the photomultiplier signals are linear over the full single-photon to multi-photon operating range, is given by the integrals over the energy weighted cross sections for the spin- and spin- configurations and , multiplied by the single-photon relative response function (where is the digitized ADC signal) of the detector. The analyzing can be written as
| (6) | |||||
Assuming a linear energy response of the detector, the analyzing power has a value of 0.1838 for eV and GeV. The energy-weighted Compton cross sections for the two spin configurations are shown in Fig. 7. Their asymmetry is largest for photon energies close to the Compton edge (). For small photon energies the two distributions are nearly identical. This has the advantage that the analyzing power is not very sensitive to the detector energy threshold .

4.3 Polarization Determination
In order to determine the single-photon relative response function of the calorimeter, test beam measurements were performed at DESY and CERN, covering the entire energy range of the back-scattered Compton photons, as shown in Fig. 8. The resulting analyzing power was found to be . Note that only the precision of the measurement of the calorimeter response is important, and not its deviation from linearity.

However, to apply the result for the relative response function obtained from the test beam measurements to Eq. (6), it was necessary to show that the photomultiplier response is linear over the full single-photon to multi-photon operating range. This was verified using the gain monitoring system. The ultimate test was then to show that the measurement of the beam polarization was not affected by changing from single-photon to multi-photon mode. This was demonstrated by attenuating the laser beam intensity over three orders of magnitude using a rotatable half wave plate and a fixed Glan-Thompson prism while increasing the photomultiplier high-voltage such that the digitized signal of the photomultiplier remained constant. The test was performed during stable electron beam conditions while monitoring the beam polarization with the Transverse Polarimeter by observing the ratio of the polarization of the two polarimeters. As shown in Fig. 9, the ratio was constant over the entire range.

Once the calorimeter response was understood in the single-photon and multi-photon modes, the longitudinal beam polarization was determined by evaluating the calorimeter signals for every bunch individually. Although the laser is triggered by a precise electronic signal that is synchronized with the HERA bunch timing, the time of the resulting light pulse fluctuates within ns. Because of this fluctuation and the finite crossing angle, the ps long electron bunches interact with varying parts of the ns long laser pulses. As mentioned earlier, the timing of each laser pulse is recorded relative to the trigger signal. The calorimeter signal reflects the temporal profile of the laser pulses if it is plotted versus the relative trigger time, as shown in Fig. 10. With a fit to this distribution, the calorimeter response is corrected for this variation.

Switching between the two light helicity states results in the two energy distributions for the corrected calorimeter signals and , displayed in Fig. 11 for an individual bunch. The longitudinal polarization of each electron bunch is determined from the asymmetry of the means of these two energy distributions divided by the analyzing power and the measured circular light polarization (Eq. (5)). This calculation is provided every minute. The longitudinal beam polarization is finally computed as the mean of the individual bunch polarizations weighted by the corresponding time-averaged bunch currents.

4.4 Čerenkov Light Attenuation
A large number of Compton photons can be produced per laser pulse when the polarimeter is operated in the multi-photon mode, ranging from a few photons to many thousand. During normal operating mode in which about 1000 back-scattered Compton photons are produced at the beginning of a fill, approximately 250 times more energy is deposited in the calorimeter than the highest energies (bremsstrahlung) deposited in the single-photon mode, since the average energy deposited per Compton photon is 6.8 GeV. In order to attenuate the Čerenkov light to protect the photomultiplier tubes from saturation, a remotely controlled movable, perforated nickel foil could be inserted into the 3 mm air gap between the NaBi(WO4)2 crystals and the photomultiplier tubes. This was initially the standard mode of operation.
Even though the NaBi(WO4)2 crystals are 19 radiation lengths long, there is a small amount of longitudinal shower leakage into the photomultiplier tubes. Unfortunately, the corresponding shower particles generate a large signal in the photomultiplier tubes, which introduces a substantial non-linearity in the energy response. The longitudinal shower leakage signal derives mostly from the highest energy Compton photons and hence has a large analyzing power. When the Čerenkov light produced in the NaBi(WO4)2 crystals was attenuated by the nickel foil, the shower leakage signal dominated the signal in the photomultiplier tubes. This altered the response function and increased the analyzing power of the detector by about 25 %.
The polarimeter has been operated without any light attenuators since early 1999. This was also the case for the test beam calibrations. The gain in the photomultiplier tubes has to be reduced in the multi-photon mode by about a factor of 200. As described in Section 4.3, it was verified that the photomultiplier tubes are linear over this large range in gain. To address concerns about long-term stability, linearity, and radiation damage, a tungsten/scintillator sampling calorimeter, similar to the one employed in the Transverse Polarimeter [7] but without position sensitivity, is moved in the Compton photon beam periodically. It acts as an independent device to check the beam polarization measurement and is otherwise not exposed to bremsstrahlung and direct synchrotron radiation.
5 Polarimeter Performance
Since early 1997 the Longitudinal Polarimeter has routinely measured the HERA electron beam polarization for the HERMES experiment. Typical electron beam fills last from eight to twelve hours, starting with a ramped injection current of 40 to 45 mA and ending usually with a controlled beam dump when the current reaches about 10 mA. Fig. 12 shows an example of polarization measurements as a function of time for three consecutive fills. Each data point represents a one minute measurement of the longitudinal polarization with an absolute statistical accuracy of 0.01. The time structure in the first fill displayed in Fig. 12 is the result of tuning efforts by the HERA operators. In the 1997 and 1998 running periods the electron beam helicity was reversed every few months; since then it has been reversed once a month.

5.1 Single Bunch Measurements
The Longitudinal Polarimeter measures the polarization of individual bunches, as shown in Fig. 13. Each data point represents a measurement lasting twenty minutes with an absolute statistical accuracy of 0.03. Not all electron bunches collide with proton bunches in HERA, and it was found that the colliding and non-colliding electron bunches can have different polarization values. This is believed to be caused by beam-beam interactions between the electron and proton beams and the associated tune shifts. Comparison of the polarization of the 174 colliding and the 15 non-colliding bunches is a useful tool for tuning the accelerator to optimize polarization. This information is shown in Fig. 14 and is provided in real time to the HERA control room every minute, with an absolute statistical precision of 0.01 (0.04) for the colliding (non-colliding) bunches.

Analyzing individual electron bunches is as of yet unique to the Longitudinal Polarimeter. An upgrade of the data acquisition system [29] of the Transverse Polarimeter at HERA, which is in progress, will also have this important feature. This detailed polarization information about the electron beam will be crucial for the collider experiments H1 and ZEUS since they are preparing to measure spin observables after the luminosity upgrade in 2001. Whereas the HERMES experiment is sensitive to the average beam polarization of all the bunches, the collider experiments are sensitive to the colliding bunches only.

5.2 Systematic Uncertainties
Various studies have been performed to investigate the systematic uncertainty associated with the polarization measurements by the Longitudinal Polarimeter operated in the multi-photon mode. Since the polarization of the electron beam is obtained from a measurement of an asymmetry (see Eq. (5)), potential sources of false asymmetries were investigated. Other studies quantified the precision with which the analyzing power and the circular light polarization at the interaction point are determined. The various contributions to the total systematic uncertainty are summarized in Table 1, and apply to the polarimeter operating conditions without optical filters in the calorimeter, i.e. since early 1999.
The largest contribution to the overall systematic uncertainty originates from the determination of the analyzing power, which depends strongly on the exact shape of the relative detector response function (see Fig. 8). The energy calibration of the detector in the test beams takes into account most sources that can lead to a non-linear response of the detector including the crystals, and the signal generated in the photomultiplier tubes by the longitudinal shower leakage (see section 4.4). It does not account for the response of the photomultiplier tubes in the multi-photon mode, but it accounts for the low-energy cut-off from the lead absorber, and the limited size of the calorimeter. The analyzing power was determined to a precision of that was calculated by propagating the systematic uncertainty of the relative response function () shown in Fig. 8, and by including the uncertainty of the transition from single-photon to multi-photon mode () shown in Fig. 9.
The long-term stability of the detector response function is checked by monitoring the sources that can produce a time-dependent non-linear detector response. The linearity of the photomultiplier tubes is checked continuously with the gain monitoring system over the full multi-photon operating range and is found to deviate by less than over the annual running period. The effect on the analyzing power is of the same size. The annual radiation dose deposited in the crystals was determined to be about ten times below the level of damage. Instead of considering all contributions separately, the overall systematic uncertainty can also be estimated by periodically performing measurements with the sampling calorimeter to compare the polarization measurements of the two detectors. Based on this comparison, the systematic uncertainty associated with the long-term instability of the analyzing power is .
Possible false asymmetries introduced by gain-mismatched photomultiplier tubes have been considered. An iterative method based on data from scanning the Compton photon beam across the detector front face is used to gain-match the detector elements within an accuracy of about 5%. The gains of the photomultiplier tubes are monitored continuously and found to change by approximately during a beam fill, returning to their initial values between fills. These short-term drifts differ by only a few percent for the four photomultiplier tubes and therefore have no net effect on the polarization measurement, since the Longitudinal Polarimeter does not depend on an absolute energy calibration. Long-term deviations of the relative gains during the annual running were found to affect the beam polarization measurement by less than .
The circular polarization of the laser light can be determined very precisely [30] immediately following the Pockels cell in the laser room. However, it can in principle be different at the interaction point, given the fact that the laser beam has to be passed through windows and lenses and be reflected from mirrors before it interacts with the electron beam. To estimate this uncertainty, the laser beam polarization was measured after the storage ring vacuum window with the identical analyzer that is normally mounted in the laser room. The two vacuum windows were removed, then each window was mounted separately, and finally the ring vacuum was re-established, while measuring the laser beam polarization after each step. Based on these measurements, a systematic uncertainty of was assigned to the circular polarization of the laser light at the interaction point.
The measurement may also be affected by changes in the phase space of the laser beam at the interaction point due to an imperfectly aligned Pockels cell. Horizontal or vertical shifts of the laser beam can occur when the voltage across the cell is changed, resulting in a helicity-dependent luminosity and hence a false energy asymmetry. To quantify extraneous helicity-dependent beam shift effects in the system, we performed two tests. First, a half wave plate was temporarily mounted immediately following the Pockels cell. Except for the expected change of sign in the measurement of the electron beam polarization, no change in the magnitude was observed within the precision of the test. However, this test does not account for non-optimal laser and electron beam overlap. This is important since the sensitivity to a helicity-dependent laser beam shift increases with decreasing overlap. Therefore a second test was performed by changing the overlap of the two beams within the limits of the normal operating conditions. This showed that the impact on the energy asymmetry is at most . Combining the two values leads to a total contribution of .
The position and size of the Compton photon beam incident on the calorimeter is determined by the electron beam orbit conditions at the interaction point. During normal HERA luminosity operation, variations of the size and divergence of the electron beam are so small that the impact on the calorimeter response is negligible. However, a change of the position or slope of the electron beam at the interaction point can result in a shift of the Compton photon distribution away from the center of the calorimeter. In these cases, the online feedback system of the polarimeter automatically repositions the calorimeter center on the Compton photon beam to better than 1 mm precision. By scanning the Compton photon beam across the calorimeter front face, it has been determined that within the relevant operating range, the effect on the measurement of the beam polarization is less than . To estimate the effect of slow beam drifts during a fill, the slope of the electron beam was moved over the maximal observed range while keeping the Compton photon distribution centered on the calorimeter. No influence on the polarization measurement was observed within the accuracy of the study. Combining the uncertainties of the two tests leads to a total contribution of at most .
| Source of systematic uncertainty | |
|---|---|
| Analyzing power | |
| Analyzing power long-term instability | |
| Gain mismatching | |
| Laser light polarization | |
| Pockels Cell misalignment | |
| Electron beam instability | |
| Total |
The various contributions to the systematic uncertainties of the Longitudinal Polarimeter have been considered separately and added in quadrature to a total uncertainty of (see Table 1). Those systematic uncertainties of the two HERA electron beam polarimeters that relate to stability and reproducibility (not absolute scale) can be further studied by comparing their performances over an extended period of time. Non-statistical fluctuations in the ratio of their results over the 1999-2000 running periods correspond to a relative systematic stability of , which is compatible with the quadratic sum of contributions estimated from the two instruments.
6 Summary
We have designed and constructed a Compton back-scattering laser polarimeter which routinely measures the longitudinal polarization of the HERA electron beam for the HERMES experiment. The Longitudinal Polarimeter determines the beam polarization with an absolute statistical precision of 0.01 per minute and a fractional systematic uncertainty of . The polarimeter also measures the polarization of individual electron bunches, a feature that is currently not available to the Transverse Polarimeter. It was found that the individual bunches can each have a significantly different polarization. This observation can be further analyzed if one groups the bunches into colliding and non-colliding bunches. The variation and the time evolution of the polarization of the individual bunches and of classes of bunches provide important additional information for achieving high beam polarization at HERA.
7 Acknowledgments
We would like to thank R. Fastner and the crew of the machine shop from the University of Freiburg for the design and construction of the optical transport system, and G. Braun for his help in designing some of the electronic components. We thank M. Spengos and E. Steffens for their help in the initial planning of the project, N. Meyners for his design of the safety interlock system, and H.D. Bremer for his help in the design and construction of the calorimeter and the calorimeter table. We also thank T. Behnke, A. Miller, and P. Schüler for many useful discussions and their comments to this article. We are grateful to E. Belz, O. Häusser, R. Henderson, M. Ruh, M. Woods, and R. Zurmühle for their help and advice. We acknowledge the DESY management for its support, and the DESY staff for the significant effort in the planning, design, and construction of the Longitudinal Polarimeter. We especially acknowledge the efforts of the HERA machine group to deliver high beam polarization. This work was supported by the German Bundesministerium für Bildung, Wissenschaft, Forschung und Technologie, and the US National Science Foundation.
References
- [1] A.A. Sokolov and I.M. Ternov, Sov. Phys. Doklady 8 (1964) 1203.
- [2] V.N. Baier and V.A. Khoze, Sov. J. Nucl. Phys. 9 (1969) 238.
- [3] D.P. Barber, Proc. of the 12th International Symposium on High-Energy Spin Physics, edited by C.W. de Jager et al., Amsterdam, The Netherlands, World Scientific (1996) 98. The laboratories include: VEPP-3 and VEPP-4 at Novosibirsk, SPEAR at SLAC, CESR at Cornell, DORIS, PETRA and HERA at DESY, and LEP at CERN.
- [4] M. Woods et al., hep-ex/9611005; SLAC-PUB-7319 (1996); and C. Cavata, Proc. of the 11th International Symposium on High-Energy Spin Physics, edited by K.J. Heller and S.L. Smith, Bloomington, USA, IAP Conf. Proc. 343 (1995) 250.
- [5] I. Passchier et al., Nucl. Instr. Meth. A 414 (1998) 446.
- [6] W.A. Franklin et al., Progress in Part. and Nucl. Phys. 44 (2000) 61.
- [7] D.P. Barber et al., Nucl. Instr. Meth. A 329 (1993) 79.
- [8] K. Ackerstaff et al., Phys. Lett. B 464 (1999) 123.
- [9] J. Buon and K. Steffen, Nucl. Instr. Meth. A 245 (1986) 248.
- [10] K. Ackerstaff et al., Nucl. Instr. Meth. A 417 (1998) 230.
- [11] F.W. Lipps and H.A. Tolhoek, Physica 20 (1954) 85 and 395.
- [12] Model Infinity 40-100 from Coherent Laser Group.
- [13] Pockels cell with 21 mm clear aperture from Gsänger Company in Germany, now Linos Photonics.
- [14] F. Burkart, Wissenschaftliche Arbeit, Univ. Freiburg (1996).
- [15] The beam expander consists of two fused silica lenses from CVI Laser Corporation: a plano-concave lens of type PLCC-25.4-77.3-UV (150 mm focal length) and a plano-convex lens of type PLCX-50.8-309.1-UV (600 mm focal length).
- [16] Mirrors M1 to M4 are 4-inch diameter fused silica mirrors of type Y2-4050-45UNP-37 and mirrors M5 and M6 are 2-inch diameter fused silica mirrors of type Y2-2037-45UNP-37. All mirrors are from CVI Laser Corporation. The vacuum compatible mounts and their remote control system are from OWIS GmbH, Germany.
- [17] Fused Silica lens doublet of type PLCC-95.0-206.0-C-532 (400 mm focal length) and PLCX-95.0-206.0-C-532 (400 mm focal length) from CVI Laser Corporation.
- [18] Fused Silica windows of type PP 1537 UV-5320-0 from CVI Laser Corporation.
- [19] Aluminum gaskets of type HNV 200 from Helicoflex.
- [20] G.I. Britvich et al., Nucl. Instr. Meth. A 321 (1992) 64.
- [21] A.V. Antipov et al., Nucl. Instr. Meth. A 327 (1993) 346.
- [22] Hamamatsu photomultiplier tubes model R4125 MOD with 15 mm active diameter.
- [23] The bunch trigger module is developed by the MKI group at DESY.
- [24] Motorola 96002 DSP.
- [25] Fastbus Analog to Digital Converter model 1881M from LeCroy Research Systems.
- [26] The Time to Digital Converter consists of a Fast Encoding Time to Charge Converter model 4303 from LeCroy Research Systems followed by the Fastbus ADC model 1881M also from LeCroy Research Systems.
- [27] S. Brauksiepe, Proc. of the 12th International Symposium on High-Energy Spin Physics, edited by C.W. de Jager et al., Amsterdam, The Netherlands, World Scientific (1996) 771.
- [28] C. Pascaud and F. Zomer, private communications.
- [29] V. Andreev et al., DESY PRC-99-04: Proposal for an upgrade of the HERA polarimeters for HERA 2000, Dec 1998.
- [30] M. Beckmann, Ph.D. thesis, Univ. Freiburg (2000).