Interaction between directional epistasis and average mutational effects
Claus O. Wilke∗ and Christoph Adami∗†
∗Digital Life Laboratory 136-93
California Institute of Technology, Pasadena, CA 91125
†Jet Propulsion Laboratory MS 126-347
California Institute of Technology, Pasadena, CA 91109
Summary: We investigate the relationship between the average fitness decay due to single mutations and the strength of epistatic interactions in genetic sequences. We observe that epistatic interactions between mutations are correlated to the average fitness decay, both in RNA secondary structure prediction as well as in digital organisms replicating in silico. This correlation implies that during adaptation, epistasis and average mutational effect cannot be optimized independently. In experiments with RNA sequences evolving on a neutral network, the selective pressure to decrease the mutational load then leads to a reduction of the amount of sequences with strong antagonistic interactions between deleterious mutations in the population.
Keywords: epistasis, neutrality, RNA secondary structure folding, digital organisms
1 Introduction
A thorough understanding of epistatic interactions of mutations in genomes is becoming more and more crucial to many areas in population genetics and evolutionary biology. Epistasis affects linkage disequilibria (Charlesworth 1976, Barton 1995), robustness to mutations (Lenski et al. 1999) or canalization (Nowak et al. 1997, Wagner et al. 1997, Rice 1998, Ancel & Fontana 2000, for reviews, see Scharloo 1991, Gibson & Wagner 2000), as well as theories on the maintenance of sex (Kondrashov 1982, Kondrashov 1988, West et al.1999). The sign of epistatic effects, that is, whether deleterious mutations are reinforcing (synergistic epistasis) or mitigating (antagonistic epistasis) also influences whether or not deleterious mutations can accumulate in the genome via Muller’s ratchet (Muller 1964, Felsenstein 1974). The consensus seems to be that synergistic epistasis can prevent the accumulation of mutations (Crow & Kimura 1978, Kondrashov 1994, but see Butcher 1995 for a dissenting view). On the other hand, the observation of pervasive compensatory mutations (Moore et al. 2000), which also render the ratchet powerless, indicates epistasis, but not its sign.
While the genomes of a number of organisms have been examined for signs of epistasis (de Visser et al. 1997a, 1997b, de Visser & Hoekstra 1998, Elena & Lenski 1997, Elena 1999), no general trend can be discerned except to say that interactions between mutations are frequent and of both signs, and that weak synergistic epistasis seems to prevail in eukaryotic genomes while viral and prokaryotic genomes show no net tendency in either direction. Experiments to measure epistatic interactions are difficult and usually yield results of weak statistical significance (West et al. 1998). Consequently, even epistasis of considerable strength can conceivably be missed in vitro or in vivo. Here, we investigate deleterious mutations in silico, and study a fact which has not received much attention in the population genetics literature. Namely, epistasis is closely related to the geometry of the phenotype space (Rice 1998), which leads to interesting relations between epistasis and the effects of single mutations. Wagner et al. (1998) showed in a two-locus, two-allele model that the average effect of a single mutation is correlated to the degree of interaction between loci, and supported their theoretical model with QTL data on body weight in mice. We demonstrate here a similar relation for a measure of epistasis which is more appropriate for high dimensional sequence spaces. We give both theoretical and experimental evidence that the strength of directional epistasis is correlated with the average deleterious effect of a single mutation. As a corollary of this observation, we argue that in situations in which there is a selective pressure to reduce the average deleterious effect, this correlation leads to a reduction of the number of genomes with strong antagonistic effects in a population.
2 Neutrality and Epistasis
It is a common observation that the average fitness at a mutational distance from a given reference sequence decays roughly exponentially with (see, e.g., de Visser et al. 1997b, Elena & Lenski 1997, Lenski et al. 1999, and also our results on RNA sequences below). The simplest explanation for a perfect exponential is a multiplicative landscape in which every mutation diminishes the fitness independently by the same factor . Here, however, we focus on fitness landscapes with a considerable amount of lethal mutations, in which case a branching process in the high-dimensional sequence space is a more appropriate model: if every viable sequence has a probability of to remain viable after suffering a single point mutation, then the mean fitness will decay as (neglecting fitness differences in the viable sequences)
| (1) |
where we have defined , and assuming that the fitness of our reference sequence at is . Both explanations for the exponential decay have in common that the effects of subsequent mutations are independent, i.e., there exists no epistasis. If there are some interactions between mutations, we will still observe an exponential decay if antagonistic and synergistic interactions occur in the same proportion. If however there exists a bias towards either antagonistic or synergistic epistatic interactions (directional epistasis), then this bias will naturally appear as deviations from the exponential decay in Eq. (1). While such deviations have previously been indicated by adding a term quadratic in to the exponent of Eq. (1) (Crow 1970, Charlesworth 1990, de Visser et al. 1997b, Elena & Lenski 1997), such a parameterization becomes troublesome at larger , because could increase beyond the fitness of the reference sequence (for a positive coefficient in the quadratic term). This is avoided by the ansatz (Lenski et al. 1999)
| (2) |
where means there is no bias towards either form of epistatic interactions. A indicates synergistic mutations prevail (mutations that are on average “worth” more than one independent hit), while reflects a bias towards antagonistic mutations (mutations whose “damage” is less then one independent mutation).111Note that in the earlier works where a quadratic term was used, the distinction between the different types of directional epistasis depended on whether was larger or smaller than 0, rather than 1. Since expression (2) depends only on two parameters, deviations from that form may arise when grows large.
Naively, one might assume that the decay parameter and the epistasis parameter are independent. Instead, we shall see that environments with strong selection force a trade-off between and , so that one can only be optimized at the expense of the other. The reasoning is as follows. In a strongly selective environment mutations can be classified as either neutral or lethal, and can be thought of as the fraction of neutral sequences in genetic space at mutational distance . In particular, the neutrality of a sequence (the number of sequences at Hamming distance 1 with fitness 1) is related to the decay parameter by , where is the length of the sequence, and is the number of monomers. If all sequences in genetic space have the same , it follows that . A deviation from implies that some sequences have more or fewer neutral neighbors than others, giving rise to a correlation between and . For a viable sequence with lower than average neutrality (higher than average ), there are comparatively fewer sequences close-by than there are far away, such that this sequence will have a small . Conversely, a sequence with a high neutrality (small ) will have comparatively more sequences close by, and will be larger. We can make this argument more formal with a simple “conservation law”, which only reflects that the total number of neutral sequences in genetic space is constant. Since for polymers of fixed length made from monomers there are possible -mutants, we must have
| (3) |
where is the total number of neutral mutants of this wild type. Inserting from Eq. (2) yields an implicit relation between and . Indeed, for two decay functions of two different reference sequences, with different parameters , the only way in which the sum can yield the quantity (which is independent of the respective reference sequence) is that the two decay functions must have different parameters as well. However, the implicit relation depends on the ansatz Eq. (2) being correct for all , which is not necessarily the case. Alternatively, we may consider only sequences with up to mutations, in which case we can write
| (4) |
where is the number of neutral sequences in a sphere of radius around the reference sequence with . depends on the particular reference sequence chosen, and therefore cannot be regarded a constant. However, for not too small, we may replace it by its average over all viable reference sequences. If we take into account a sufficiently large region of genotype space, we should find roughly the same number of neutral mutants for each viable sequence, since, as approaches , the quantity approaches , which in turn is independent of the reference sequence. Hence, Eq. (4) predicts a similar relation between and , and the two different predictions approach each other as . Predictions based on Eqs. (3) and (4) are used below to compare to our empirical results.
Although the above argument strictly holds only under the assumption that mutations are either neutral or lethal, it is not unreasonable to assume that a similar (possibly weaker) correlation between and exists also in more general cases, where slightly deleterious or even advantageous mutations are possible. In that case, under the presence of epistasis, there will still be regions in genotype space in which the number of less-deleterious mutations is higher, and other regions in which it is lower than average. The decay function of a sequence from a region that is rich in non-lethal mutations would have a lower , but would be inevitably more synergistic than the decay function of a sequence from a region poor in non-lethal mutations. Our results with digital organisms (see below) support this reasoning.
3 Experimental Evidence
Accurate data for the decay parameter and the epistasis parameter for biological organisms are rare, which makes our hypothesis difficult to test. A few well-studied systems have emerged which are accessible in silico.
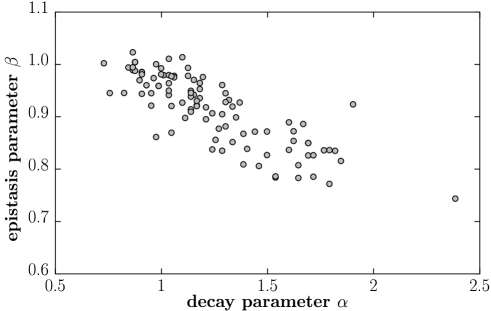
We studied RNA secondary structure prediction using the Vienna RNA package, version 1.3.1., with the default setup (Hofacker et al. 1994). We calculated the decay of the average number of neutral folds as a function of the Hamming distance for 100 random RNA sequences of length . The parameters and were determined as follows. We obtained exactly from the fraction of neutral one-mutants. In addition, we sampled the function for Hamming distances up to , by calculating the structure of up to random neighbors of the required Hamming distance. The quantity was then determined from a nonlinear fit of to the logarithm of . A plot of versus (Fig. 1) shows a significant correlation, with a correlation coefficient of ().
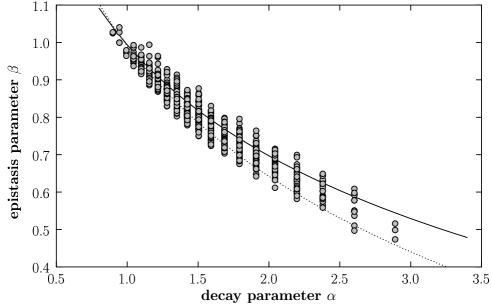
According to Eqs. (3) and (4), we can predict the relationship between and if we compare the decay functions of sequences that are mutually neutral. For RNA folding, this means we have to determine and for a set of sequences that fold into the same structure. We performed experiments with the RNA sequences of length used by van Nimwegen et al. (1999) (for these sequences we altered the default setup by setting the free energies of dangling ends to zero.) For the particular case that all bonds are of the purine-pyrimidine type (G-C, G-U, A-U), two separate neutral networks (a neutral network is a network of neutral genotypes connected to each other by one-point mutations) were found by van Nimwegen et al., consisting of 51,028 and 5,169 sequences, respectively. For each such set of neutral sequences, Eq. (3) predicts the correlation without free parameter, as long as the number of all neutral sequences is known. In order to estimate , we generated random sequences of length , of which 10,961 sequences folded correctly. From this, we estimated neutral sequences out of the total sequences of length . Using this number, Eq. (3) predicts the solid line in Fig. 2, which describes the correlation well. The approach based on averaging over local neutral sequences around the reference sequence [Eq. (4)] gives rise to the dotted line in Fig. 2 and shows that this too predicts the correlation fairly well (for this second approach, we used , and from Monte Carlo simulations for 1000 reference sequences, we obtained ).
As our second test case, we analyzed the correlation between and in digital organisms (Adami 1998, Adami et al. 2000). Digital organisms are self-replicating computer programs that mutate and evolve. Their fitness is determined by the ratio of their CPU speed and their gestation time. The latter is given by the number of instructions that have to be executed in order to generate a fully functional offspring. The CPU speed increases when the digital organisms perform logical operations on numbers that they can acquire from their environment. The gestation time, on the other hand, increases either if the organisms employ less efficient mechansims of self-replication, or if they accumulate instructions that are involved in the completion of the above mentioned logical operations. The digital organisms with the highest fitness thus have a very efficient copy mechanism, and perform a large number of logical operations with a comparatively small number of additional instructions. Lenski et al. (1999) measured the decay of the mean fitness as a function of the number of mutations accumulated in such digital organisms, and obtained and from a fit of Eq. (2) to the measured decay functions. They studied 174 different genomes consisting of two groups of 87 genomes each. The first group of organisms evolved in 87 independent experiments in a complex environment, while the second group was obtained by transfering these organisms to an environment which favoured simple genomes, and allowing the organisms to adapt to this more simple environment.
A statistical analysis revealed a significant correlation between the decay parameter and the parameter of directional epistasis for both the complex and the simple digital organisms (Table 1). However, in addition to said correlation, we found a correlation between the and both the genome length and the log fitness for complex and simple organisms, as well as a correlation between and in the case of the complex organisms. Hence, for the complex organisms, we cannot rule out the possibility that the correlation between and merely reflects an underlying correlation of both quantities with length. In the case of the simple organisms, where we do not see a correlation between and , we can assume that the correlation between and is genuine. To provide further evidence, we examined a reduced data set of all 48 simple organisms with a length between and . These 48 organisms were also of comparable fitness. In that data set, we found an even stronger correlation between and , while the correlation between either of the two quantities and length or fitness was insignificant (Table 1). It was not possible to study a similar reduced data set for the complex organisms, because the variations in length were too large (the length varied between and among the 87 genomes). Although the data from the digital organisms is potentially biased because our reference sequences were evolved rather than random as in the RNA case, we believe this bias to be insubstantial in at least the reduced data set, which contains only organisms with very similar phenotypes. Hence, just as for our RNA data, the data from the digital organisms supports our hypothesis of a genuine correlation between and .
4 Adaptation of Epistasis through Correlated Response
The correlation between neutrality and epistasis implies that if one of them is subject to selective pressures, the other will be affected as well due to correlated response. Van Nimwegen et al. (1999) have shown that a population evolving on a neutral network reduces its genetic load by moving into the regions of high neutrality in sequence space. In particular, given a random population of molecules on such a network, evolution tends to increase the neutrality in the population, effectively pushing the population into the center of the neutral network. Because of the correlation between neutrality and epistasis, we expect this dynamic to lead to a reduction of antagonistic epistatic effects. To verify this hypothesis, we carried out evolutionary experiments with the RNA sequences of length 18 from the previous section.
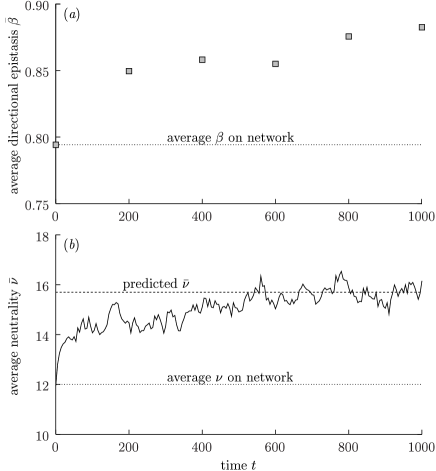
We performed one flow-reactor run for each of the two networks found by van Nimwegen et al., starting with an initial population of 1,000 sequences chosen at random from the respective network. We set the replication rates such that sequences folding into the target structure replicated on average once per unit time, while the replication rate of all other sequences was set to per unit time. All sequences had a probability of to suffer one random point mutation per replication event. The possibility of several point mutations per replication event was eliminated, to guarantee that the population could not leave the specified neutral network. The epistasis parameter was determined for every sequence in the population every two hundred generations, while the population neutrality was monitored constantly. The population neutrality is the average neutrality of all sequences currently in the population. In Fig. 3, we present the results from the run on the larger of the two networks. The neutrality of the initial population coincides with the network neutrality (the average neutrality of all sequences on the network), which is to be expected for a random initial population. Over the course of evolution, the average population neutrality rose to the predicted equilibrium value (given by the spectral radius of the connectivity matrix, see van Nimwegen et al. 1999.) As expected, the average epistasis parameter increased significantly as well. Results on the second network were qualitatively identical, with increasing from 0.78 to around 0.86. Thus, antagonistic epistasis is reduced during adaptation for reduced mutational load on a neutral network.
The above reasoning depends of course on the assumption that a population remains on a single neutral network. In a more realistic scenario, where peaks of different heights are present, the main effect of selection will be to increase the fitness, rather than to increase . However, once a local optimum has been reached, we can expect the dynamic described above to take place, as long as there exists some neutrality at the local peak. If there was a correlation between the fitness and or , then we would see additionally a correlated response in or as the fitness is being maximized. Nevertheless, while the correlation between and reported here is a general result that follows from geometric constraints on the landscape, no such constraints exist between the fitness and or . The parameters and measure the amount and the distribution of neutral or nearly neutral sequences in the neighborhood of a reference sequence. There is no reason why sequences with high fitness should generally be found in regions with particularly high or low neutrality, or with a particular distribution of the neutral sequences. This is not to say, however, that such a correlation cannot exist in special cases (see, e.g., our data from the complex digital organisms, Table 1, where is correlated with fitness, but is not).
5 Conclusions
Epistasis plays an important role in evolutionary theory, but remains empirically largely unexplored. Using secondary structure prediction of RNA sequences as well as digital organisms evolving in silico, we have demonstrated a correlation between two important parameters of realistic genetic fitness landscapes: the average deleterious effect of single mutations and the strength of directional epistasis. In conjunction with the results from Wagner et al. (1998) for mice, and the two different theoretical explanations (two-locus model in the case of Wagner et al., sequence space based model here), we can expect this correlation to be an ubiquitious phenomenon, present in many natural and artificial fitness landscapes.
The correlation, coupled with the selective pressure which forces random sequences in a neutral network to cluster in the dense areas of the network, leads to a reduction of strong antagonistic epistasis in a population. The nature of this result is purely geometric: as a population tries to reduce the average effect of single mutations, the effect of multiple mutations is inevitably worsened as long as there exist some inhomogeneities in the effect of single mutations across the genotype space. As the result of this geometric constraint, a member of an evolved population will have, on average, a higher than a random sample of the fitness landscape would indicate.
It is well known that antagonistic epistasis favors the accumulation of deleterious mutations as well as the operation of Muller’s ratchet. Since in such a situation sexual recombination (within a fixed environment) tends to worsen the loss of information, recombination is unlikely to evolve or be maintained. The mechanism described here may thus provide a path towards an environment more conducive to the evolution of recombination.
6 Acknowledgements
We thank Martijn Huynen for providing access to the sequences used in (van
Nimwegen et al. 1999), and Walter Fontana for providing us with his flow
reactor code. We are grateful to Richard Lenski and two anonymous referees for
many useful comments and suggestions regarding the manuscript. The genomes of
digital organisms used in this study are available at
http:dllab.caltech.edu/pubs/nature99/nature.shtml. This work was supported
by the National Science Foundation under contract No. DEB-9981397. Part of
this work was carried out at the Jet Propulsion Laboratory, under a contract
with the National Aeronautics and Space Administration.
References
- [1] Adami, C. (1998) Introduction to Artificial Life (Springer, New York).
- [2] Adami, C., Ofria, C., and Collier, T.C. (2000) Evolution of biological complexity. Proc. Nat. Acad. Sci. USA 97:4463–4468.
- [3] Ancel, L. W. and Fontana, W. (2000) Plasticity, Evolvability and Modularity in RNA. Journal of Experimental Zoology (Molecular and Developmental Evolution) 288: 242–283.
- [4] Barton, N.H. (1995) A general model for the evolution of recombination. Gen. Res. 65:123–144.
- [5] Butcher, D. (1995) Muller’s ratchet, epistasis and mutation effects. Genetics 141:431–437.
- [6] Charlesworth, B. (1976) Recombination modification in a fluctuating environment. Genetics 83:181–195.
- [7] Charlesworth, B. (1990) Mutation-selection balance and the evolutionary advantage of sex and recombination. Genet. Res. 55:199–221.
- [8] Crow, J. F. (1970) Genetic loads and the cost of natural selection. In Mathematical Topics in Population Genetics (ed. K. Kojima), pp. 128–177. (Springer, Berlin).
- [9] Crow, J. F. & Kimura, M. (1978) Efficiency of truncation selection, Proc. Nat. Acad. Sci. USA 76:396–399.
- [10] Elena, S.F. and Lenski, R.E. (1997) Test of synergistic interactions among deleterious mutations in bacteria. Nature 390:395–398.
- [11] Elena, S.F. (1999) Little evidence for synergism among deleterious mutations in a nonsegmented RNA virus. J. Mol. Evol. 49:703–707.
- [12] Felsenstein, J. (1974) The evolutionary advantage of recombination. Genetics 78:737–756.
- [13] Gibson, G. & Wagner, G. (2000) Canalization in evolutionary genetics: a stabilizing theory? BioEssays 22:372–380.
- [14] Hofacker, I.L., Fontana, W., Stadler, P.F., Bonhoeffer, S., Tacker, M., and Schuster, P. (1994) Fast Folding and Comparison of RNA Secondary Structures. Monatshefte f. Chemie 125:167–188.
- [15] Kondrashov, A.S. (1982) Selection against harmful mutations in large sexual and asexual populations. Genet. Res. 40:325–332.
- [16] Kondrashov, A.S. (1988) Deleterious mutations and the evolution of sexual reproduction. Nature 336:435–440.
- [17] Kondrashov, A.S. (1994) Muller’s ratchet under epistatic selection. Genetics 136:1469–1473.
- [18] Lenski, R.E., Ofria, C., Collier, T.C., and Adami, C. (1999) Genome complexity, robustness and genetic interactions in digital organisms. Nature 400:661–664.
- [19] Moore, F.B.-G., Rozen, D.E., and Lenski, R.E. (2000) Pervasive compensatory adaptation in Escherichia coli. Proc. R. Soc. Lond. B 267:515–522.
- [20] Muller, H.J. (1964) The relation of recombination to mutational advantage, Mutat. Res. 1:2–9.
- [21] van Nimwegen, E., Crutchfield, J.P., and Huynen, M. (1999) Neutral evolution of mutational robustness. Proc. Natl. Acad. Sci. USA 96:9716–9720.
- [22] Nowak, M.A., Boerlijst, M.C., Cooke, J. & Maynard Smith, J. (1997) Evolution of genetic redundancy. Nature 388:167–171.
- [23] Rice, S.H. (1998) The evolution of canalization and the breaking of von Baer’s law: Modeling the evolution of development with epistasis. Evolution 52:647–656.
- [24] Scharloo, W. (1991) Canalization: genetic and developmental aspects. Annu. Rev. Ecol. Syst. 22:65–93.
- [25] de Visser, J.A.G.M, Hoekstra, R.F., & van den Ende, H. (1997a) An experimental test for synergistic epistasis and its application to Chlamydomonas, Genetics 145:815–819.
- [26] de Visser, J.A.G.M, Hoekstra, R.F., & van den Ende, H. (1997b) Test of interaction between genetic markers that affect fitness in Aspergillus niger, Evolution 51:1499–1505.
- [27] de Visser, J.A.G.M and Hoekstra, R.F. (1998) Synergistic epistasis between loci affecting fitness: Evidence in plants and fungi. Genet. Res., Camb. 71:39–49.
- [28] Wagner G.P., Booth G., Bagheri-Chaichian H. (1997) A population genetic theory of canalization. Evolution 51: 329–347.
- [29] Wagner, G.P., Laubichler, M.D. & Bagheri-Chaichian, H. (1998) Genetic measurement theory of epistatic effects. Genetica 102/103:569-580.
- [30] West, S.A., Peters, A.D. & Barton, N.H. (1998) Testing for epistasis between deleterious mutations. Genetics 149:435–444.
- [31] West S.A., Lively C.M., Read A.F. (1999) A pluralist approach to sex and recombination. J. evol. Biol.12:1003–1012.
| Complex | Simple | ||||
| and | and | ||||
| and | and | ||||
| and | and | ||||
| and | and | ||||
| and | and | ||||
| Reduced | |||||
| and | |||||
| and | |||||
| and | |||||
| and | |||||
| and |