Ionic and electronic structure of sodium clusters up to N=59
Abstract
We determined the ionic and electronic structure of sodium clusters with even electron numbers and 2 to 59 atoms in axially averaged and three-dimensional density functional calculations. A local, phenomenological pseudopotential that reproduces important bulk and atomic properties and facilitates structure calculations has been developed. Photoabsorption spectra have been calculated for , , and to . The consistent inclusion of ionic structure considerably improves agreement with experiment. An icosahedral growth pattern is observed for to . This finding is supported by photoabsorption data.
pacs:
PACS: 36.40.Vz,31.15.Ew,71.15.H,36.40.WaI Introduction
Since the pioneering experiments of Knight et al.[1] and their interpretation in terms of the jellium model,[2, 3] sodium clusters have attracted great attention, both experimentally and theoretically. This is due to the fact that sodium is the “simple metal” par excellence, and thus is best suited for the study of fundamental effects. From photoabsorption experiments it is known that small sodium clusters have overall shapes that strongly vary with size and are determined by electronic shell effects.[4, 5, 6, 7, 8] On the other hand, cold clusters with several thousand atoms build icosahedra,[9] i.e., they show ionic shell effects, whereas the bulk material crystallizes in a bcc lattice. Recent experiments indicate that both ionic and electronic degrees of freedom play a role in determining the structural and thermal properties of clusters with several tens of atoms.[10]
On the theoretical side, there have been different approaches to obtain an understanding of the delicate interplay between ions and electrons that is the source of this variety. On one hand, relatively transparent models like the shell and jellium models in several levels of sophistication have been widely used.[2, 3, 11, 12, 13, 14, 15, 16] On the other hand, quantum chemistry and density functional theory offer methods to study clusters on the highest level of sophistication presently possible. But ab initio calculations in the strictest sense, i.e., taking all electrons into account, have only been performed for a few selected cases for the smallest clusters, due to the enormous computational effort that they require.[17, 18, 19] Taking only the valence electrons into account reduces the complexity considerably, but the expense for searching low-energy configurations in three dimensions [20, 21, 22, 23, 24] still grows rapidly with the system size. The largest ab initio studies of sodium clusters to our knowledge are the recent finite-temperature investigations presented in Refs. [25, 26].
Several models have been developed to bridge the gap between the ab initio calculations and the shell and jellium models. The ”Spherically Averaged Pseudopotential Scheme” (SAPS) describes the ions by pseudopotentials, in most cases local ones, and the valence electrons are restricted to spherical symmetry.[27] Models based on a volume-averaged or perturbational treatment of ionic effects[28, 29] improve on the treatment of the electrons. Yet further approaches are the Hückel and related models,[30, 31] molecular dynamics based on empirical potentials,[32] and recently, also the extended Thomas-Fermi model combined with a local pseudopotential has been used to study sodium clusters.[33, 34]
From the above examples, two points become clear that considerably facilitate systematical studies of clusters with more than twenty atoms. First, the fact that many calculations make use of phenomenological local pseudopotentials shows the importance of such potentials. This is especially true for sodium, where previous investigations[16, 35, 36] have shown that a local electron-ion interaction can be a good approximation. But especially in cluster physics, where one bridges the region between the atom and the bulk, it is important that a pseudopotential give reliable results for all sizes despite its locality. Second, one needs models that make it computationally manageable to calculate structures and optical properties of clusters systematically for a wide range of considerable sizes, but which on the other hand leave the underlying physics intact and are detailed enough so that relevant information can be drawn from them. Besides extending the computational range, such models will serve the even more important purpose to distill the dominant physical effects from the wealth of details that fully ab initio calculations supply. The results of the model calculations of course must be verified in calculations of higher accuracy and by comparison with experiment. These tasks are addressed in the present article.
In Section II we develop a new phenomenological pseudopotential which meets the just mentioned requirements. Detailed comparisons with ab initio calculations for the smallest clusters in section III verify the validity of the pseudopotential and an axially averaged density functional model[37] for structure calculations. In section IV, a systematic survey over structures and photoabsorption spectra of Na clusters up to is given. The results of the survey are summarized and discussed in the concluding section V.
II A local pseudopotential for structure calculations
Rigorous pseudopotentials in the sense of Phillips and Kleinman [38] and modern ab initio pseudopotentials[39, 40] are always nonlocal. However, it has been noted early in the development of pseudopotential theory that by relaxing the Phillips-Kleinman condition, one can open up a new class of pseudopotentials.[41] These are also termed “model potentials” because they are constructed by choosing some analytical functions as models for the partial-wave potentials and adjusting their parameters such that some experimentally known quantities, e.g., atomic energy levels, are matched. If several partial-wave potentials can be chosen to be the same, one can construct a local model potential. In fact, such local phenomenological potentials have been and are being used successfully in many branches of physics, see, e.g., Refs. [29, 34, 35, 42, 43]. However, the local approach can only be expected to be good for the so-called “nearly free electron” metals whose atomic structure consists of only or electrons outside of an ionic core with a noble gas configuration. (Lithium, with its lack of electrons in the core, is the prominent exception.) In these metals, the two contributions making up the pseudopotential have a tendency to cancel each other, and the effective potential a valence electron experiences is further diminished by screening effects. Therefore, model potentials have been proposed in the past which tried to exploit this simple electronic structure either by fitting properties of the bulk solid,[35, 37, 42, 44] or of the single atom,[41] or by ad hoc fulfilling desired numerical properties.[33, 45] However, some of these potentials can lead to wrong predictions when they are used in physical surroundings different from the one in which they were set up,[46] or when properties other than the adjusted ones are looked at. With an emphasis on solid state properties, the last point has been discussed in detail previously, see, e.g., Ref. [35] for an overview. Our aim here is to develop a local model potential that gives a maximum degree of transferability in the sense that potentials constructed according to our scheme should reproduce the important physical properties of a system, irrespectively of its number of atoms or the way in which these are arranged.
A The Ansatz
The construction of a model potential consists of two steps. The first is to choose the model function. It should allow for a physical interpretation of the final potential, and at the same time should have analytical and numerical properties that allow for an easy application. The parameterization
| (1) |
where
| (2) |
certainly meets the second requirement, since the error function can very efficiently be handled numerically[47] and yields a smooth representation on a grid. That this parameterization also has a transparent physical interpretation will be demonstrated at the end of this section. The second step is the choice of the four parameters . One necessary condition is that the correct Coulomb limit,
| (3) |
be obtained, which requires
| (4) |
Thus we are left with three free parameters. Since our aim is to construct a pseudopotential that gives reliable properties for all clusters, i.e., spanning the region from the atom to the bulk, the most important properties of both atom and bulk solid must be reproduced. Therefore, we have chosen to fit the Wigner-Seitz radius and the compressibility of the crystalline metal, together with the energy of the atomic level . These quantities characterize sodium and influence both structure and electronic excitations, thus being of great importance for reliable results. A test for whether we really have captured the relevant physics will be to check if non-fitted quantities (bond-lengths, atomic spectra, bulk binding, dipole resonances) are also reproduced correctly.
B Determination of basic properties
We calculate the bulk properties in second-order perturbation theory.[35] The unperturbed system is the noninteracting homogeneous gas of valence electrons, the perturbation is given by the potentials arising from the crystal lattice and from the interaction of the electrons with each other. Each crystal ion is described by a pseudopotential centered on a lattice site. Up to second order, the binding energy per valence electron is given by
| (6) | |||||
Here is defined in terms of the average valence electron density ,
| (7) |
is the noninteracting kinetic energy, and is the exchange and correlation energy for which we have employed the LDA functional of Perdew and Wang.[48] The quantity
| (8) |
is the first-order contribution of the pseudopotential to the binding energy, is the Hartree energy of the valence electron density, and is the electrostatic energy of point ions. Finally, is the band structure energy discussed below. Integrations are taken over the (infinite) volume of the crystal. These contributions are rewritten as
| (11) | |||||
to obtain the volume-averaged repulsive part of the pseudopotential that defines its strength
| (12) |
and the total electrostatic energy of point ions in a compensating uniform negative background, called the Madelung energy . Separating the Coulomb force into long and short-range components,[49] one can calculate , and for the bcc lattice one obtains . Thus the only characteristic[50] of the pseudopotential that enters the binding energy in first-order perturbation theory is its strength . For fixing the radial dependence of the potential it is therefore essential to take into account the second-order band structure energy
| (13) |
In (13),
| (14) |
is the structure factor with the sum running over all ionic positions. For a lattice without basis one obtains , where denotes reciprocal lattice vectors, i.e., the sum in (13) is running over reciprocal lattice vectors only. Furthermore,
| (15) |
is the Lindhard function with , and
| (16) |
is the dielectric function including the local field correction
| (17) |
in the LDA. The pseudopotential enters via its Fourier transform, which for our potential is given by
| (18) |
From Eqs. (6) to (16) we calculate ; the minimum of determines , and the bulk modulus is obtained from
| (19) |
The reciprocal lattice vectors are generated numerically from the reciprocal basis, and we carefully checked that in all calculations the sum over reciprocal lattice vectors was numerically converged.
The atomic level is the lowest eigenvalue of the Schrödinger equation
| (20) |
for , where the pseudo wavefunction has, as usual, been factorized into radial and angular components, . At this point, a subtlety should be considered. The atomic energy calculated within density functional theory using the LDA will slightly differ from due to the well known fact that in the LDA, the self interactions in the Hartree and exchange energy do not cancel each other exactly and leave a spurious self interaction energy.[51] One therefore might be tempted to “compensate” this self-interaction energy by adjusting the pseudopotential parameters such that the experimental value is matched when the self-interaction energy is included. This, however, would be dangerous for several reasons. First, it must be recalled that for an accurate description of bonding properties, the pseudopotential must lead to an accurate description of the electronic density. If one adjusts the pseudopotential parameters such that a spurious energy is compensated, then the valence electron density resulting from this pseudopotential might correspondingly show spurious, unphysical deformations, leading to wrong bonding properties, as discussed previously.[52] Secondly, the self-interaction energy becomes smaller with increasing delocalization of the electrons. For an electron delocalized over a volume , the self-interaction correction is of order[53] . Since the valence electrons in metal clusters are delocalized to a high degree, and since the cluster volume changes noticeably in the size range from N=8 to N=58 that we are interested in, a compensation of the atomic self interaction energy via the pseudopotential would lead to problems for increasing cluster sizes. And third, building the self-interaction energy into the pseudopotential would be inconsistent with the procedure of fitting to the bulk, because the bulk calculation is less affected by the self-interaction error due to the delocalization of the bulk electrons. Therefore, it is better to exactly solve Eq. (20). This can straightforwardly be done numerically by combining the Runge-Kutta method with adaptive stepsize control with a globally convergent Newton scheme. As a welcomed side effect, our pseudopotential might also be usable in self-interaction free, i.e., beyond-LDA density functional calculations.
C Results and comparison
The three free parameters of our model potential (1) were now chosen such that the experimental low-temperature value[54] be reproduced exactly, while at the same time and be as close as possible to the experimental values[41] and[55] . These conditions lead to the parameters
| (21) | |||||
| (22) |
In Table I we have listed the resulting , and for our smooth-core pseudopotential and for other local pseudopotentials that have widely been used in cluster physics.
| Pseudopotential | |||
|---|---|---|---|
| Empty core, rc= 1.66a | |||
| Empty core, rc= 1.76b | |||
| Ref. [37] | |||
| Heine-Abarenkovc | |||
| Present work | |||
| Experiment |
The empty-core potential with both of the most frequently used choices for its cut-off radius , and the pseudopotential of Ref. [37] that was constructed in the same spirit and adjusted in first-order perturbation theory only, lead to considerable deviations from the experimental values for all quantities. The local Heine-Abarenkov potential[29, 42, 43] gives a reasonable and an very close to the experimental one, but 10% error in . Our pseudopotential by construction gives no or only very small differences from the experimental values for , and , showing that it is possible to obtain reasonable results for all these quantities with a local potential. However, a severe test will be whether also non-fitted quantities are reproduced correctly. To this end, we have calculated the bulk binding energy , the dimer binding length , the zero of the pseudopotential form factor, given by in our case, and the first seven excited atomic energy levels. Table II shows that also these ten non-fitted quantities come out very close to the measured values, revealing that the model potential defined by (1), (21) indeed incorporates the relevant physical effects.
| 3s - 3p | ||
|---|---|---|
| 3s - 4s | ||
| 3s - 3d | ||
| 3s - 4p | ||
| 3s - 5s | ||
| 3s - 4d | ||
| 3s - 5p |

Fig. 1 shows our pseudopotential in real and in Fourier space, leading us back to the question of the motivation for the ansatz (1). From Eq. (4), one can interpret the coefficients and as the charges associated with the attractive and repulsive terms, respectively, in the pseudopotential. This interpretation becomes more transparent when one looks at the corresponding pseudocharge density. The pseudocharge is related to the pseudopotential via Poisson’s equation
| (23) |
and for our pseudopotential is given by
| (24) |
where
| (25) |
Thus, our parameterization describes the ionic core by two overlapping Gaussian charge densities. The different heights and widths of the Gaussians result in a pseudodensity that is negative for small distances, corresponding to a repulsive core, and has a positive tail that compensates the core for larger distances. Equation (24) thus is a generalization of the parameterization that was used in our previous studies,[46] where the pseudodensity has a two step-profile. Besides its transparent physical interpretation, the pseudopotential (1) has excellent numerical properties: in real space the potential is smooth with no extreme peaks and can very efficiently be handled numerically via the pseudodensity, allowing to solve the Coulomb problem for electrons and ions together. At the same time, its rapidly converging Fourier transform makes the potential equally well suited for calculations in reciprocal space.
III Comparison with ab initio results
In the present work we have employed the “Cylindrically Averaged Pseudopotential Scheme” (CAPS), which has been introduced earlier[37, 46] and which has been modified and improved for the present purposes. Since CAPS treats the electronic degrees of freedom in the Kohn-Sham formalism without limiting them to spherical symmetry, explicitly includes the ionic structure, and furthermore is numerically efficient, it is a very good tool for systematical studies of the interplay between ions and electrons. But before CAPS and the smooth-core pseudopotential are applied on a large scale, we further test their usefulness for cluster structure calculations.
That the smooth core pseudopotential reproduces the experimentally known dimer bond length has already been shown in Table II. For the next larger clusters, no direct experimental information on structures or bond lengths is available, and we therefore resort to comparisons with other theoretical work. Fig. 2 shows the four smallest Na clusters with even electron numbers as they are obtained in CAPS with the smooth core pseudopotential. For these clusters, also three-dimensional geometry optimizations have been performed using ab initio pseudopotentials and Hartree-Fock with configuration interaction (CI) [17, 23], or DFT with the LDA [20, 21] for the valence electrons, respectively. Also all-electron Hartree-Fock calculations have been reported.[17, 60] CAPS finds exactly the same structures as the three-dimensional methods, and this in spite of the fact that the ionic configurations of
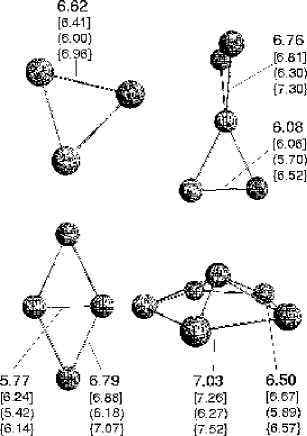
and might let the cylindrical averaging seem a rather far-fetched approximation. But not only the overall geometry, also the bond lengths are in good agreement with the ones from the three-dimensional calculations. Whereas all-electron Hartree-Fock overestimates bond lengths due to missing correlation effects, the three-dimensional LDA calculations lead to the well-known underestimation. By construction, the phenomenological pseudopotential compensates this underestimation, and it is thus reassuring to see that the resulting bond lengths are close to the ones found in the quantum chemistry calculations. Three-dimensional calculations have been performed for a few other neutral clusters,[22] and CAPS is in agreement with the three-dimensional geometries in these cases, too. A detailed analysis of structures of neutral clusters and their static electric polarizability can be found in Ref. [61].
A further test for structure calculations is obtained by comparing the photoabsorption spectra corresponding to the theoretically determined structures to the measured ones. To this end, we have calculated the valence electron excitations for our cluster structures in a collective approach. The basic idea of this method has been presented earlier,[62, 63] and a detailed discussion of its extensions and the relation to density functional theory is the subject of a forthcoming publication.[64] Here, we demonstrate the validity of our collective model for the test cases and , where experimental data and recent ab initio TDLDA calculations are available for comparison. The first row of plots in Fig. 3 shows the excitation spectra obtained with the axial collective model for the CAPS structures
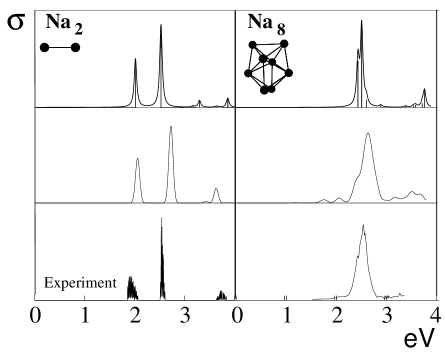
shown in the insets, the second row shows the TDLDA spectra for the corresponding three-dimensional geometries, and the bottom row shows the experiment.[65, 66] The lower two rows were directly adapted from Ref. [70], and the collective model results were then plotted on the same scale. Besides small differences in the two small peaks seen at high energies for , the agreement between the three sets of data is very good. This demonstrates that our collective model is capable of correctly describing excitations even in small systems. It further is to be noticed that the excitation energies obtained with the smooth-core pseudopotential are 0.15 eV lower than the TDLDA energies and closer to the experimental ones, which can be attributed to the larger bond lengths that result with the present pseudopotential.
IV Structures and photoabsorption spectra of singly-charged cationic sodium clusters
Since the comparisons in the previous section have shown that the phenomenological pseudopotential, the collective model and CAPS are well suited for the description of sodium clusters, a systematic study of clusters with even electron numbers between 8 and 58 is presented. For each cluster a great number of simulated annealing runs was started from different random configurations. The search was continued until new runs no longer returned new low-energy structures. Although it must always be kept in mind that no practical algorithm guarantees that all low-energy structures are found, this extensive and unbiased procedure at least gives good hope to do so. The aim of this survey is to investigate how electronic and ionic shell effects play together in determining the cluster structure, and thus gain a better understanding of how matter grows. The geometry optimization was done with CAPS, but the energies of the resulting structures have also been obtained in three-dimensional Kohn-Sham calculations to check the ordering of isomers without axial restriction. Photoabsorption spectra are calculated with the collective model, and comparison with the experimental spectra gives further information on the relevant structures.
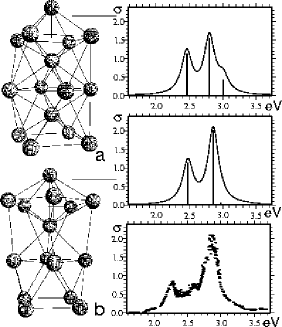
The “magic” cluster is spherical according to the jellium model, and the ground state found with CAPS is the structure (a) in Fig. 4. Separated by 0.10 eV, CAPS finds the isomer (b), and both these geometries were also found in three-dimensional CI and LDA calculations.[18, 45] In addition, CAPS finds the third isomer (c) which is higher by 0.23 eV. All these clusters have nearly spherical valence electron densities, and therefore support the shell model picture. But the ionic configurations are, of course, non-spherical, and this is reflected in the photoabsorption cross sections.
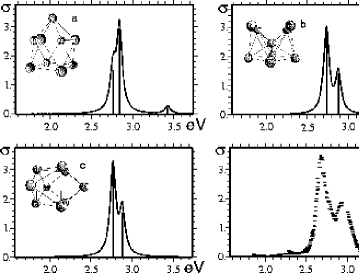
The first thing to be noted is the overall position of the resonance, about which there has been a long-standing debate.[2, 14, 15, 24, 29, 68, 69] In previous work[46] we have shown that when ionic structure is taken into account via a pseudopotential, the detailed form of the potential greatly influences the resonance position. But whereas our previous calculations were mainly compared to high-temperature data, and, due to limited collective model basis sets, fixed the resonance positions only within a few percent (as pointed out in Ref. [46]), we have now fully converged the basis. The resulting overall resonance positions are very close to the experimental low-temperature positions, showing that consistent inclusion of ionic structure gets the plasmon position in the correct energy interval. The optical response of has also been theoretically investigated previously,[18, 23, 29, 45] and each of these calculations explains the experimental spectrum on the basis of a different isomer. In our calculations, the spectra of isomers (b) and (c) both reproduce the splitting of the main peak seen in the experiment. Isomer (a) does not show this feature, but it leads to the small sub-peak around 3.5 eV that is also seen experimentally. The situation becomes transparent when the results from our three-dimensional calculations, see Table III, are taken into account. They show that isomer (c) is degenerate with isomer (a), and the experimental spectrum can thus be explained even at low temperatures as resulting from a mixture of isomers (a) and (c). (The importance of isomerism on dipole spectra in small sodium clusters has also been pointed out in Ref. [73].)
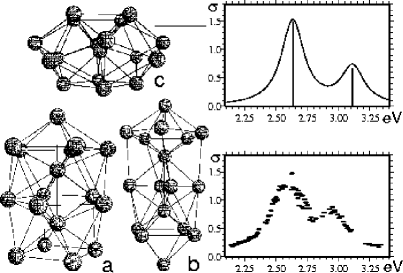
The lowest energy structure that we find for (, labeled (a) in Fig. 5) can be understood as resulting from placing one atom in the center of , or capping isomer (b) of on the quadratic faces. Separated by 0.11 eV and 0.19 eV, respectively, CAPS finds the isomer (b), and its deformed counterpart (c), which is only a shallow local minimum in CAPS and easily transforms into the more stable structure (b). In the three-dimensional calculations, the ordering of isomers is reversed: (b) becomes the ground state,
and our results are thus consistent with the findings of Ref. [23]. We have calculated the photoabsorption spectra with the collective model and obtain two resonances with heights approximately 1:2 for all three geometries. These are centered at 2.41/2.94 eV for structure (a), at 2.39/2.94 eV for structure (b), and at 2.27/2.98 eV for structure (c). The experimental photoabsorption spectrum [72] of at 380 K shows two broad peaks with heights 1:2 around 2.2 eV and 2.85 eV, and a pattern of six peaks when measured at 35 K: three low intensity ones at 1.9 eV, 2.2 eV and 2.4 eV, and three high intensity ones at 2.5 eV, 2.8 eV and 3.0 eV. Obviously, the calculated resonances are blue shifted by a few percent with respect to the hot experiment. This is understandable since the calculations have been done for T=0 K, and thermal expansion of the cluster shifts the plasmon to slightly lower energies. (This effect has recently been put into evidence quantitatively for the static response.[74]) When compared to the cold data, the calculated resonances are in the correct energy range, but the fine structure that the experiment shows is not reproduced. A CI calculation [23] based on isomer (b) reproduced some of the experimentally observed patterns, but also could not explain all the peaks, and recent three-dimensional TDLDA calculations [75] have lead to similar results as the collective model. An explanation of all details in the experimental spectrum therefore might require to consider a mixture of low-energy structures, and this will be discussed in detail in a separate publication.[75]
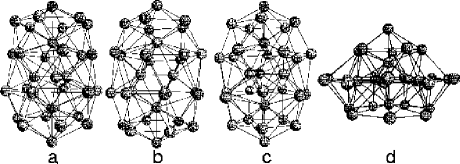
For CAPS finds four low-energy structures. The two lowest ones, (a) and (b) in Fig. 6, are very close in energy in both CAPS and the three-dimensional calculations. (a) corresponds to a distorted (a) with four atoms added along the -axis, and (b) can be understood as a pentagonal bipyramid sharing one ion with (a). Structure (c) results from structure (a) by moving one of the inner single atoms to the bottom face, and the oblate (d) corresponds to a configuration found[31, 61] for , but with one atom added along the symmetry axis. In agreement with the experimental photoabsorption spectrum, our results point to prolate clusters as the relevant structures and thus again verify the prediction of the deformed, structure averaged jellium model (SAJM).[77, 7]
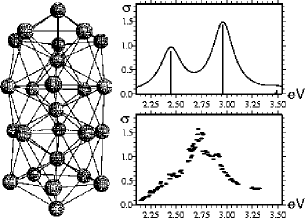
The ground state structure found for , (a) in Fig. 7, is close to the one found in the extended Hückel model for the neutral cluster.[31] It consists of an icosahedral core with a crown of four atoms, and the only difference to the result of Ref. [31] is that the cylindrical averaging forces the crown atoms into a square. This shows that for such sizes the differences between charged and neutral clusters can already be small. Structure (b), which is slightly higher in energy than (a) in the three-dimensional calculations, has an even more prolate valence electron density, and the collective resonances for these clusters lie at 2.59 eV and 2.86 eV [structure (a)] and at 2.34 eV and 2.95 eV [structure (b)]. They are thus in contrast to the experimental spectrum that points to an oblate cluster. CAPS finds one more isomer, structure (c), that indeed leads to an oblate valence electron density.
In CAPS, it is 0.16 eV higher than (a), with a half occupied orbital. The collective spectrum for this isomer is very close to the experimental one, as shown in Fig. 7. However, also the three-dimensional calculation gives a non-negligible energy difference between (c) and the prolate isomers, cf. Table III. Therefore, in this case a three-dimensional relaxation of the ions would be necessary to check whether Jahn-Teller distortions lower the energy of isomer (c) so much that it can account for the experimental spectrum.
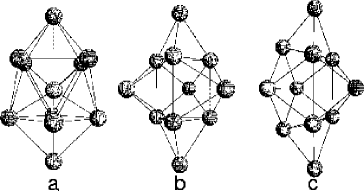
For CAPS finds the four stable geometries shown in Fig. 8. The double-icosahedron (a) is the ground state, and it is separated from structure (b) by 0.23 eV, from (c) by 0.30 eV, and from (d) by 0.35 eV. However, in the calculations without axial restriction, the energetic differences are considerably reduced: isomer (d) becomes equivalent to isomer (b), and both are separated from the ground state by only 0.12 eV. The experimental photoabsorption spectrum sheds further light on the situation. It shows a high peak at about 2.7 eV, followed by a lower one at about 2.9 eV, and is thus very similar to the collective spectrum of isomer (d). The spectra of the other isomers all give the peaks in reversed order and thus do not resemble the experiment. (The collective spectrum of (c), which is not shown in order not to overload Fig. 8, shows a small peak at 2.84 eV and a higher one at 2.93 eV.) Since an internal cluster temperature of about 60 K is sufficient to go from isomer (a) to (d), and since the temperature in the experiment is about 105 K,
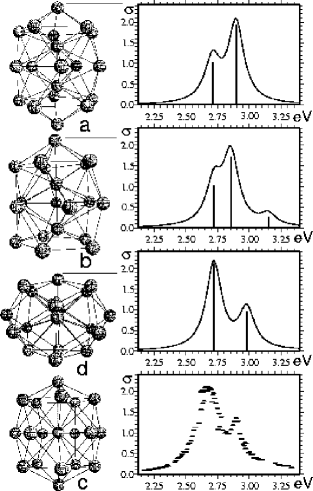
it is plausible that isomer (d) will contribute to the spectrum. The experimental spectrum however looks as if it is dominated by isomer (d). One explanation for this can be that structure (d) has a larger “catchment area” than (a) and is entropically favored. The second possibility, which is suggested by the relatively large difference between the energy found in CAPS and the three-dimensional calculation, is that a three-dimensional relaxation of the ions would turn structure (d) into the ground state.
Two degenerate structures are found for in CAPS, and also the three-dimensional calculation leads to nearly equal energies. Structure (a) results from the double icosahedron of (a) by adding one ion to each of the lower tow pentagons, and (b) results from (a) by moving the lowest ion to the uppermost pentagon. Both geometries lead to collective spectra with two main transitions and some strength above the main resonances. This is in agreement with the experimental data [71, 76] that also show this high-energy tail. Concerning the main transitions, the two isomers are somewhat different: in structure (a) the main peaks are separated by about 0.1 eV, whereas they nearly fall together for structure (b). Since the structures are extremely close in total energy and since the main peaks of (b) energetically fall exactly between the main peaks of (a), the experimental spectrum can consistently be explained as resulting from a mixture of both isomers.
The simulations performed for led to strongly prolate shapes. This is partially understandable on the basis of the SAJM: [7] the valence electrons force the cluster into the prolate regime. But the inclusion of ionic structure even enhances the prolate tendency, because the lowest configuration, shown in Fig. 10, is a triple icosahedron, and in order to build this configuration, a quadrupole moment larger than the jellium prediction is necessary. From this observation it also becomes clear that the pentagonal bipyramid which has been observed as a building block of the smaller clusters[18, 22, 31] is also important for the larger sizes. For the triple icosahedron, collective resonances are observed at 2.44 eV and 2.96 eV, and also the experiments [6, 76] indicate peaks at these energies. But the latter shows an additional peak around 2.75 eV which is not found in the calculations. Comparing this to the situation encountered[46] for shows that the geometries of the two clusters are closely related: is the triple icosahedron with two atoms added to the central pentagons. This shows the consistency of the structure calculations, and for the collective spectrum nicely matches with the experimental data. The triple icosahedron is energetically strongly favored over the other structures that CAPS finds. All of them are variations of the ground state geometry with local distortions, and a three-dimensional calculation was performed for the structure that in CAPS is the second lowest. Here, the difference in total energy is a little smaller than in CAPS, but still large, cf. Table III. Since furthermore all low-energy structures give rise to collective spectra that are similar to the one shown in Fig. 10, the explanation for the middle peak observed for remains an open question.
Comparing the structures of and to the ones found for , and (Fig. 11, Fig. 12, and Refs. [25, 46]) allows to identify a growth pattern: the triple icosahedron serves as a building block for the larger clusters. Additional atoms are added on outside faces, as seen in the ground states of and , or can be packed between the pentagonal subunits, as observed for the isomers of , where the two additional ions are placed at different positions “inside” the structure.
The collective spectra of the low-energy structures (a) – (c) of reflect the prolate electron densities of these clusters and show one peak around 2.6 eV, carrying about 30% oscillator strength, another one around 2.95 eV carrying about 50% strength, and the rest of the strength scattered at higher energies. Structure (d) is not stable against Jahn Teller distortions in three dimensions. In view of the cluster size, the CAPS differences in total energy for are rather small, and they are even smaller in the three-dimensional approach. Since the temperature in the measurement of the photoabsorption cross section was again at least 105 K, it can be concluded from the calculations that a variety of isomers will contribute to the experimental spectrum. It is thus not astonishing that the available experimental data [6, 76] do not resolve separated peaks but show a rather broad bump.
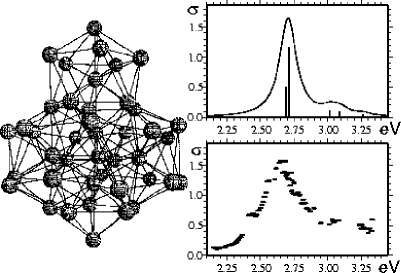
The pronounced deformation seen for in Fig. 12 results from an interplay between ions and valence electrons. The electrons “push” the cluster into the octupole, i.e. pear-shaped form, and the ions arrange under this “constraint”. But the ions favor the icosahedral core, and this increases the deformation. The octupole moment therefore is larger by a factor 1.15 than in the SAJM.[77] The photoabsorption spectrum calculated for shows a strong peak at 2.7 eV, followed by a high-energy tail. It is in close agreement with the experimental data, which thus support our structure calculations.
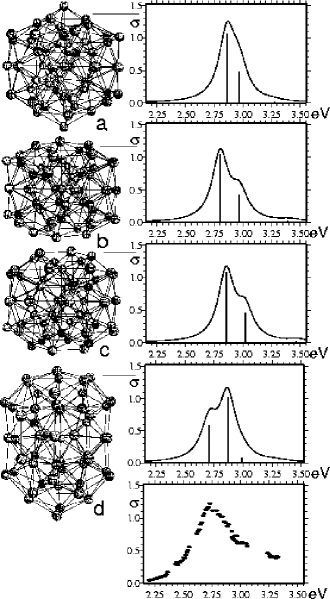
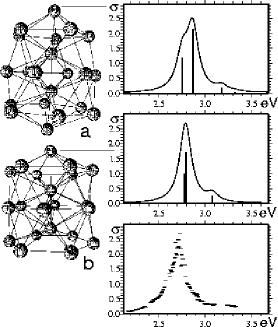
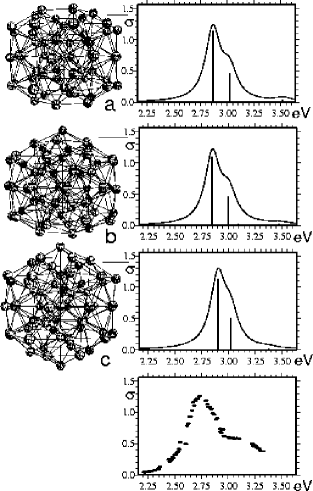
Based on the shell and deformed jellium model a configuration would be expected for that gives rise to a prolate valence electron density. The CAPS calculations, however, consistently led to nearly spherical or slightly oblate clusters as low-energy configurations. The lowest energy was found for structure (a) in Fig. 13. It has a fivefold symmetry axis and again shows the close-to-icosahedral core discussed previously. Within 0.4 eV structures (b) and (c) are found with valence electron densities that are more oblate. These structures show half-occupied highest orbitals, indicating that they would Jahn-Teller relax if the axial restriction on the electrons were lifted. The lowest prolate isomer that was found, structure (d), has a quadrupole moment that is close to the one predicted by the SAJM [7] but in CAPS this configuration is 0.73 eV higher than the ground state. The annealing was also started from an icosahedron with the nearest-neighbor distance of bulk sodium. In this calculation, the strictly geometrical icosahedron transforms into structure (a), which can be regarded as a slightly distorted icosahedron. The experimental photoabsorption spectrum of as measured by the Freiburg group is shown in the lowest panel of Fig. 13, and the spectrum has also been measured by Meibom et al.[78] Both spectra have in common that one broad peak is seen, followed by a second, smaller peak or a high-energy shoulder. This is in contrast to the prediction of the jellium model, because the prolate structures found there give the peaks in reversed order, similar to the spectrum of isomer (d). The CAPS low-energy structures, however, lead to collective spectra with a high peak followed by a lower one, and are thus in better agreement with the experiment. The total oscillator strength measured in the experiment [78] was 70% - 80%. This also agrees with the collective model calculations that find 79% strength within the plotted range for structure (a), 76% for (b) and 80% for (c). As a test for the collective model, a TDLDA calculation with excitation in z-direction was performed for structure (a). In the TDLDA, the high-energy shoulder is more pronounced than in the collective model. To further clear up the situation, the structures (a), (b) and (d) were relaxed in Born-Oppenheimer ab initio molecular dynamics,[79] i.e., fully three-dimensional with the Troullier-Martins pseudopotential.[80] The bond lengths of all three structures shrinked by a few percent due to the different pseudopotential, and isomers (b) and (d) distorted slightly, but otherwise the geometries stayed unaltered. As seen in Table III, the differences in total energy are somewhat smaller in the ab initio calculations, but the ordering of isomers is the same as in CAPS. Finally, as reported in Ref. [26], the CAPS structure (a) was annealed for 10 ps at about 220 K. In this annealing, the cluster became even more similar to an icosahedron and its overall shape oscillated around the nearly spherical shape of the icosahedron. Thus, the ab initio calculations confirm the finding that in contrast to the deformed jellium model prediction, at low to moderate temperatures has a close to spherical valence electron density.
The CAPS results for , see Fig. 14, are consistent with the results for : again the low-energy structures are not prolate, but spherical or slightly oblate. The collective spectra somewhat underestimate the high-energy shoulder, and this can be attributed to selective particle-hole effects just as in the case of . But the overall agreement with experiment [78, 76] is considerably better than in the deformed-jellium calculation. Structure (a) has the lowest energy, followed by isomers (b) and (c) that are higher by 0.22 eV. For structure (c) we observe a half-occupied orbital. With respect to the ionic geometry, structure (a) is similar to the third isomer of , and (c) corresponds to the ground state of with the two additional ions added on top and bottom faces. Another isomer, not shown in Fig. 14 for the sake of clarity, is found, and there the two additional ions are added in the equatorial plane of (a).
In the case of the search for low-energy structures has not been as exhaustive as for the other clusters. But several annealing runs were started from random configurations, and the low-energy geometries that were found again showed the ions arranged rather regularly and similar to the structures just discussed. Therefore, further simulations were started from the geometries found for and , plus four or two atoms, respectively, that were added at randomly chosen sites. One of these runs led to a geometry that corresponds to (a), capped by two atoms on top and bottom. This structure has the lowest energy of all that were found, and it does not show signs of Jahn-Teller instability. The comparison between the experimental [76] and theoretical photoabsorption spectra fits into the previous discussion. The strongest collective resonance is seen at 2.8 eV, followed by a smaller one at 2.9 eV and a little strength scattered around 3.25 eV, i.e., the collective model leads to qualitative agreement with the experimental data.
| Cluster | /eV | /eV |
|---|---|---|
| a | G | G |
| b | 0.10 | 0.12 |
| c | 0.23 | G’ |
| a | G | 0.16 |
| b | 0.11 | G |
| c | 0.19 | 0.10 |
| a | G | 0.04 |
| b | 0.03 | G |
| c | 0.15 | 0.16 |
| d | 0.23 | 0.15 |
| a | G | G |
| b | G’ | 0.08 |
| c | 0.16 | 0.20 |
| a | G | G |
| b | 0.23 | 0.12 |
| c | 0.30 | 0.20 |
| d | 0.35 | 0.12 |
| a | G | G |
| b | G’ | 0.03 |
| a | G | G |
| b | 0.41 | 0.29 |
| a | G | G |
| b | 0.14 | 0.08 |
| c | 0.19 | 0.10 |
| a | G | G |
| b | 0.41 | 0.30 |
| d | 0.73 | 0.31 |
V Discussion and conclusion
The systematic survey showed that for most of the smaller Na clusters, the overall deformation is determined by electronic shell effects even when the ionic structure is explicitly included. This explains the great success of the deformed jellium model. However, the survey at the same time clearly exhibits the limitations of the jellium picture. Besides the fact that some spectroscopic patterns, e.g., as seen for , are directly related to details in the ionic configuration, the fundamental improvement brought about by taking into account the ionic structure is that growth systematics can be identified. In the smallest clusters, the pentagonal bipyramid is a frequently appearing structure and is seen, e.g., in , , . In , three of these smallest units are combined to build up the double icosahedron, and from then on, the electronic shell effects and the preference of the ionic structure for icosahedral geometries work hand in hand in determining the cluster structure. This is seen most impressively for . At , however, the situation changes. Due to the ionic shell closing, the influence of the ions wins over the electronic shell effects, resulting in nearly spherical structures. This finding is supported by the experimental photoabsorption data and has been verified in ab initio calculations.
In summary, we have presented a local pseudopotential for sodium that accurately models the core-valence interaction and correctly describes the atom, the bulk, and finite clusters. We have demonstrated the influence of pseudopotentials on structural properties and the direct influence of the bond lengths on the resonance positions. This shows that even for the most simple metal, a pseudopotential must be constructed carefully. Cluster structures were calculated in axially averaged and three-dimensional Kohn-Sham calculations. A detailed comparison with ab initio work demonstrated the validity of the CAPS as a tool for the approximate determination of cluster configurations. The systematical survey for clusters with up to 59 ions revealed an icosahedral growth pattern. Collective resonances were calculated for the theoretically determined structures, and comparison with the experimental photoabsorption spectra confirmed the results of our structure calculations. Thus, a distinct step in the growing process of matter has been put into evidence, namely the transition from electronically to ionically determined configurations.
Acknowledgements.
We thank J. Akola for the communication of his results prior to publication, and one of us (S. Kümmel) further acknowledges stimulating discussions with A. Aguado and F. Calvo. This work has been partially supported by the Deutsche Forschungsgemeinschaft.REFERENCES
- [1] W. D. Knight, K. Clemenger, W. A. de Heer, W. A. Saunders, M. Y. Chou, and M. L. Cohen, Phys. Rev. Lett. 52, 2141 (1984).
- [2] W. Ekardt, Phys. Rev. Lett. 52, 1925 (1984).
- [3] D. E. Beck, Phys. Rev. B 30 (1984) 6935.
- [4] W. Ekardt and Z. Penzar, Phys. Rev. B 43, 1322, (1991).
- [5] K. Selby, V. Kresin, J. Masui, M. Vollmer, W. A. de Heer, A. Scheidemann, and W. D. Knight, Phys. Rev. B 43, 4565, (1991).
- [6] J. Borggreen, P. Chowdhury, N. Kebaili, L. Lundsberg-Nielsen, K. Lützenkirchen, M. B. Nielsen, J. Pedersen, and H. D. Rasmussen, Phys. Rev. B 48, 17507, (1993).
- [7] T. Hirschmann, B. Montag, and J. Meyer, Z. Phys. D 37, 63 (1996).
- [8] H. Häkkinen, J. Kohlemainen, M. Koskinen, P. O. Lipas, and M. Manninen, Phys. Rev. Lett. 78, 1034, (1997).
- [9] T. P. Martin, Phys. Reports 273, 201 (1996).
- [10] M. Schmidt, R. Kusche, W. Kronmüller, B. v. Issendorf, and H. Haberland, Phys. Rev. Lett. 79, 99 (1997).
- [11] K. Clemenger, Phys. Rev. B 32, 1359 (1985).
- [12] M. Manninen, Phys. Rev. B 34, 6886 (1986).
- [13] G. F. Bertsch and D. Tománek, Phys. Rev. B 40, 2749 (1989).
- [14] M. Brack, Rev. Mod. Phys. 65, 677 (1993).
- [15] M. Madjet, C. Guet, and W. R. Johnson, Phys. Rev. B 51, 1327 (1995).
- [16] F. Alasia, Ll. Serra, R. A. Broglia, N. Van Giai, E. Lipparini, and H. E. Roman, Phys. Rev. B 52, 8488 (1995).
- [17] V. Bonačic-Koutecký, P. Fantucci, and J. Koutecký, Phys. Rev. B 37, 4369 (1988).
- [18] V. Bonačic-Koutecký, P. Fantucci, and J. Koutecký, Chem. Rev. 91, 1035 (1991).
- [19] J. Guan, M. E. Casida, A. M. Köster, and D. R. Salahub, Phys. Rev. B 52, (1995) 2184.
- [20] J. L. Martins, J. Buttet, and R. Car, Phys. Rev. B 31, 1804 (1985).
- [21] I. Moullet, J. L. Martins, F. Reuse, and J. Buttet, Phys. Rev. B 42, 11589 (1990).
- [22] U. Röthlisberger and W. Andreoni, J. Chem. Phys. 94, 8129 (1991).
- [23] V. Bonačic-Koutecký, J. Pittner, C. Fuchs, P. Fantucci, M. F. Guest, and J. Koutecký, J. Chem. Phys. 104, 1427 (1996).
- [24] A. Rubio, J. A. Alonso, X. Blase, L. C. Balbás, and S. G. Louie, Phys. Rev. Lett. 77, 247 (1996).
- [25] A. Rytkönen, H. Häkkinen, and M. Manninen, Phys. Rev. Lett. 80, 3940 (1998); Eur. Phys. J. D 9, 451 (1999).
- [26] J. Akola, A. Rytkönen, H. Häkkinen, and M. Manninen, Eur. Phys. J. D 8, 93 (2000).
- [27] M. P. Iñiguez, M. J. Lopez, J. A. Alonso, and J. M. Soler, Z. Phys. D 11, 163 (1989); G. Borstel et al., in Lecture Notes in Physics, edited by R. Schmidt, H. O. Lutz and R. Dreizler (Springer, Berlin, 1992), Vol. 404.
- [28] J. A. Alonso, A. Rubio, and L. C. Balbas, Phil. Mag. B 69, 1037 (1994).
- [29] W.D. Schöne, W. Ekardt, and J. M. Pacheco, Phys. Rev. B 50, 11079 (1994); Z. Phys. D 36, 65 (1996).
- [30] R. Poteau and F. Spiegelmann, Phys. Rev. B 45, 1878 (1992).
- [31] R. Poteau and F. Spiegelmann, J. Chem. Phys. 98, 6540 (1993).
- [32] F. Calvo and F. Spiegelmann, Phys. Rev. Lett. 82, 2270 (1999).
- [33] P. Blaise, S. A. Blundell, and C. Guet, Phys. Rev. B 55, 15856 (1997).
- [34] A. Aguado, J. M. López, J. A. Alonso, and M. J. Stott, J. Chem. Phys. 111, 6026 (1999).
- [35] C. Fiolhais, J. P. Perdew, S. Q. Armster, J. M. MacLaren, and M. Brajczewska, Phys. Rev. B 51, 14001 (1995); Phys. Rev. B 53, 13193 (1996).
- [36] S. A. Blundell and C. Guet, Z. Phys. D 33, 153 (1995).
- [37] B. Montag and P.-G. Reinhard, Z. Phys. D 33, 265 (1995).
- [38] J. C. Phillips and L. Kleinman, Phys. Rev. 116, 287 (1959).
- [39] G. B. Bachelet, D. R. Haman, and M. Schlüter, Phys. Rev. B 26, 4199 (1982).
- [40] N. Troullier and J. L. Martins, Phys. Rev. B 43, 1993 (1991).
- [41] I. V. Abarenkov and V. Heine, Phil. Mag. 12, 529 (1965).
- [42] Z. D. Popovic, J. P. Carbotte, and G. R. Piercy, J. Phys. F 4, 351 (1974).
- [43] R. N. Barnett, U. Landman, and C. L. Cleveland, Phys. Rev. B 27, 6534 (1983).
- [44] N. W. Ashcroft, Physics Letters 23, 48 (1966).
- [45] F. Calvayrac, P.-G. Reinhard, and E. Suraud, J. Phys. B 31, 1367 (1998).
- [46] S. Kümmel, M. Brack, and P.-G. Reinhard, Phys. Rev. B 58, R1774 (1998).
- [47] W. H. Press, S. A. Teukolsky, W. T. Vetterling und B. P. Flannery, Numerical Recipes in FORTRAN (Cambridge University Press, 1992).
- [48] J. P. Perdew and Y. Wang, Phys. Rev. B 45, 13244 (1992).
- [49] J. Hafner, From Hamiltonians to Phase Diagramms, (Springer, Berlin, 1987).
- [50] J. P. Perdew, H. Q. Tran, and E. D. Smith, Phys. Rev. B 42, 11627 (1990).
- [51] J. P. Perdew, Chem. Phys. Lett. 64, 127 (1979).
- [52] A. Zunger and M. L. Cohen, Phys. Rev. B 18, 5449 (1978).
- [53] J. P. Perdew and A. Zunger, Phys. Rev. B 23, 5048 (1980).
- [54] N. W. Ashcroft and N. D. Mermin, Solid State Physics, (Saunders College Publishing, Fort Worth, 1976).
- [55] M. S. Anderson and C. A. Swenson, Phys. Rev. B 28, 5395 (1983).
- [56] J. Emsley, The Elements (Clarendon, Oxford, 1991).
- [57] M. L. Cohen and V. Heine, in Solid State Physics, edited by F. Seitz, D. Turnbull and H. Ehrenreich (Academic, New York, 1970), Vol. 24.
- [58] K. K. Verma, J. T. Bahns, A. R. Rajaei-Rizi, W. C. Stwalley, and W. T. Zemke, J. Chem. Phys. 78, 3599 (1983).
- [59] H. Haken and H. C. Wolf, Atom- und Quantenphysik, (Springer, Berlin, 1990).
- [60] V. Bonačic-Koutecký, I. Boustani, M. Guest und J. Koutecký, J. Chem. Phys. 89, 4861 (1988).
- [61] S. Kümmel, T. Berkus, P.-G. Reinhard and M. Brack, Eur. Phys. J. D 11, 239 (2000).
- [62] M. Brack, Phys. Rev. B 39, 3533 (1989).
- [63] P.-G. Reinhard, O. Genzken, and M. Brack, Ann. Phys. (Leipzig) 51, 576 (1996).
- [64] S. Kümmel and M. Brack, in preparation.
- [65] W. R. Fredrickson and W. W. Watson, Phys. Rev. 30, 429 (1927).
- [66] C. R. C. Wang, S. Pollack, D. Cameron, and M. M. Kappes, Chem. Phys. Lett. 166, 26 (1990); J. Chem. Phys. 93, 3787 (1990).
- [67] G. Lauritsch, P.-G. Reinhard, J. Meyer, and M. Brack, Phys. Lett. A 160, 179 (1991); C. Kohl, B. Montag, and P.-G. Reinhard, Z. Phys. D 35, 57 (1995).
- [68] K. Yabana and G. F. Bertsch, Phys. Rev. B 54, 4484 (1996).
- [69] P.-G. Reinhard, J. Babst, B. Fischer, C. Kohl, F. Calvayrac, E. Suraud, T. Hirschmann, and M. Brack, Z. Phys. D 40, 314 (1997).
- [70] I. Vasiliev, S. Öğüt, and J. R. Chelikowsky, Phys. Rev. Lett. 82, 1919 (1999).
- [71] T. Reiners, W. Orlik, C. Ellert, M. Schmidt, and H. Haberland, Chem. Phys. Lett. 215, 357 (1993).
- [72] C. Ellert, M. Schmidt, C. Schmitt, T. Reiners, and H. Haberland, Phys. Rev. Lett. 75, 1731 (1995).
- [73] F. Alasia, R. A. Broglia, H. E. Roman, Ll. Serra, G. Colo, and J. M. Pacheco, J. Phys. B 27, L643 (1994).
- [74] S. Kümmel, J. Akola, and M. Manninen, Phys. Rev. Lett. 84, 3827 (2000).
- [75] P.-G. Reinhard and E. Suraud, in preparation.
- [76] M. Schmidt and H. Haberland, Eur. Phys. J. D 6, 109 (1999).
- [77] B. Montag, Th. Hirschmann, J. Meyer, P.-G. Reinhard, and M. Brack, Phys. Rev. B 52, 4775 (1995).
- [78] P. Meibom, M. Østergard, J. Borggreen, S. Bjørnholm, and H. D. Rasmussen, Z. Phys. D 40, 258 (1997).
- [79] R. Barnett and U. Landmann, Phys. Rev. B 48, 2081 (1993).
- [80] Calculations done by J. Akola, private communication and Ref. [26].