Finesse and mirror speed measurement for a suspended Fabry-Perot cavity using the ringing effect
Abstract
We here present an investigation of the ringing effect observed on the VIRGO mode-cleaner prototype MC30. The results of a numerical calculation show how a simple empirical formula can determine the cavity expansion rate from the oscillatory behavior. We also show how the simulation output can be adjusted to estimate the finesse value of the suspended cavity.
, , , , ,
1 Introduction
Interferometric gravitational wave detectors, like VIRGO [1], LIGO [2], GEO [3] and TAMA [4], make use of suspended Fabry-Perot cavities for their properties: spatial filtering of the laser beam, optical path amplification and power recycling to name a few. Due to the suspension system, the motion of each mirror is dominated by oscillations at the pendulum’s fundamental resonance, typically below and with amplitudes as large as tens of a laser wavelength.
A VIRGO mode-cleaner prototype MC30 [5], which operated in Orsay for several years, consists of a triangular Fabry-Perot cavity with two possible finesse values, 100 or 1600, depending on the incoming laser beam polarization state. The two-stage suspension system, together with a local damping control system, results in a residual RMS displacement value, for each mirror, of .
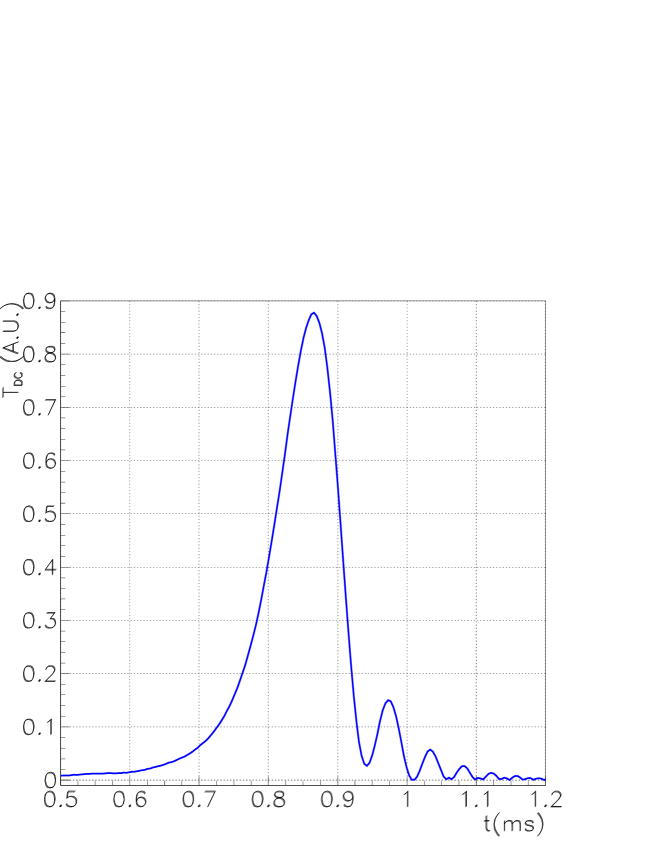
Prior to the lock acquisition, the cavity length sweeps the optical resonance at different rates of expansion. If the relative velocity between the mirrors is constant, the DC transmitted power delineates the Airy peak as a function of time, easily observed for the optical system with . However, in the case of , a deformation of the Airy peak, similar to a ringing, was observed (see fig.(1)).
Both [6, 7], and references therein, discuss this phenomenon. Briefly, this effect arises once the cavity sweeps the optical resonance in a time of the order of or less than the cavity storage time , where is the cavity length and the speed of light.
This effect is observed when the rate of expansion is so high that, as resonance is approached, the cavity doesn’t have enough time to completely fill itself. It is the beating between the incoming laser field and the evolving stored field that gives rise to this oscillatory behavior.
The goal of this letter is to present the informations which can be extracted from such deformation, in particular, the finesse of the cavity and the relative mirror speed.
2 The ringing effect in Fabry-Perot cavities
The model used for this study is shown in fig.(2). Assuming a negligible mirror displacement for times of the order of the round trip time of light , the stored field at time can be written as
| (1) |
where and denote the amplitude reflectivity and transmittivity of each mirror, is the incoming laser field, and is the cavity length. Assuming that the cavity expands at a constant rate , we can write and solve eq.(1) iteratively, for different velocities and finesse .
Fig.(3) shows the Airy peak for three velocities: (static approximation), , and , with . The curve labeled static, corresponding to , was generated by neglecting the travel time of light, i.e the cavity has reached its equilibrium point at each step. The two other curves, on the other hand, were simulated according to the dynamical model here presented. Notice how the main peak height decreases, its width increases and its position shifts ahead of the resonance. These changes are greater for larger velocities.
3 The speed measurement
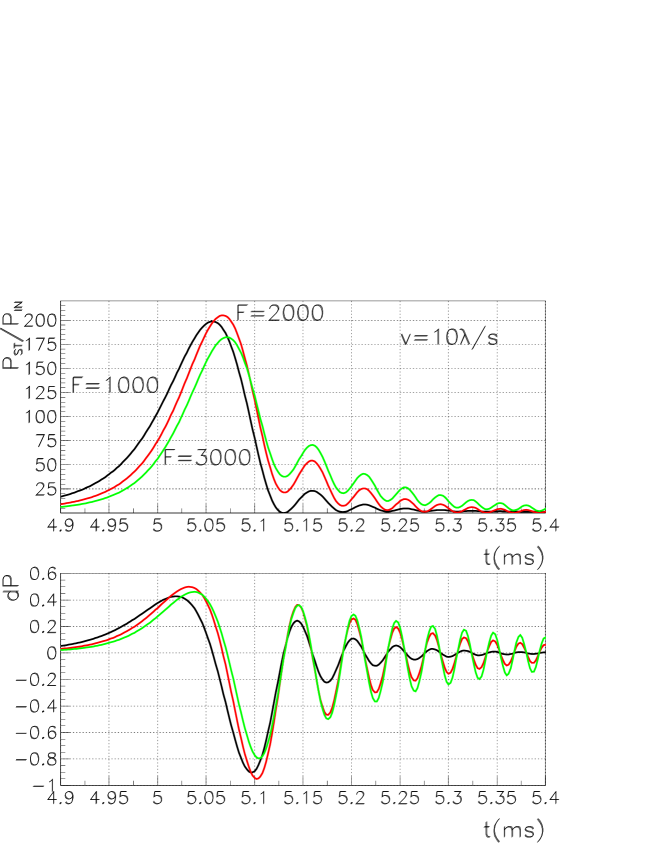
We would now like to discuss a property of the ringing effect observed from the simulation runs. Fig.(3) graphs the stored power as a function of cavity length for a given finesse and for different values of velocity. We can now plot the stored power as a function of time, setting the velocity to a fixed value, but varying the finesse. One example is given in fig.(4). The top graph of this figure shows the stored power as a function of time, for an expansion rate set to , for three different finesse values: , , and . The bottom graph is the curves’ time derivative. From these plots, we remark a particular characteristic of the phenomenon: the position of the minima and maxima, with the exception of the main peak, are almost independent from the finesse value.
Furthermore, going back to fig.(3), we can now note that the derivative zeros depend only on the relative mirror velocity. The simulation output shown in fig.(4) not only shows how the derivative zeros are independent, at least to first approximation, from the finesse, but it also shows a particular regularity in the spacing between the minima and maxima.
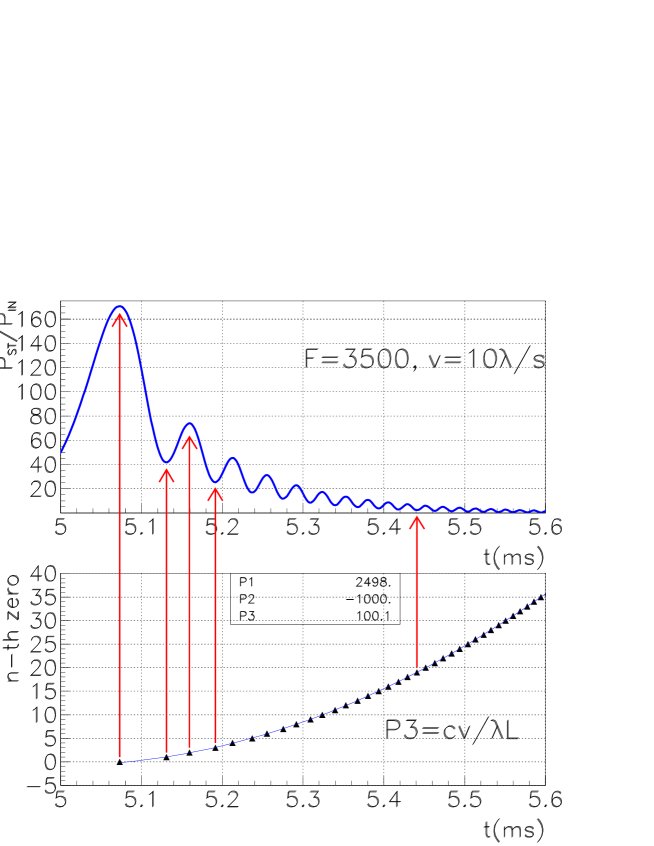
The upper graph of fig.(5) shows the simulated stored power of a cavity with , expanding at a rate . Let the position of the curve’s derivative zeros, , be labeled by the index , so that, for the first zero, positioned at , , for the second zero, located at , and so on. Then, the bottom graph of fig.(5) shows the plot of index as a function of time. We remark that the -th zero of the derivative is a quadratic function of the zero crossing time : . By fitting the simulation outputs to the expression where are fitting parameters, we empirically found that the coefficient can be written as where is the cavity length and is the cavity expansion rate (an example is shown in the bottom graph of fig.(5)). Therefore, an estimate of coefficient would also give us an estimate of the relative velocity .
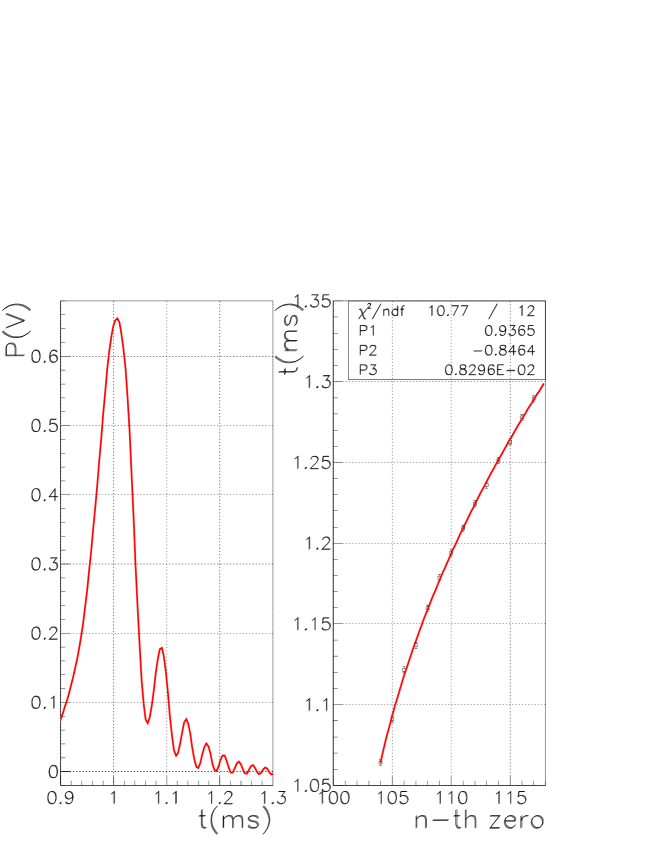
Fig.(6) shows the results of a fit on a measured event. Notice how the parabolic behavior is in agreement with the experimental points, resulting in a measured speed of .
4 The Finesse measurement
Once the speed is extracted, it is possible to fit the measurements with the simulation’s output to find the remaining parameter: the finesse. The fit results of a set of measurements, six of which are shown in fig.(7), led to a mean finesse of , a value later confirmed by a measurement of the cavity pole. The ten percent precision on the finesse measurement is most probably due to the alignment state of the cavity, as suggested by simulation studies.
5 Conclusion
An analysis of the optical ringing effect, observed on the VIRGO mode-cleaner prototype in Orsay, was here presented. We investigated a method to extract, from the oscillatory behavior, both the relative mirror speed and the finesse of the system.
The numerical results showed how the position of the oscillations’ minima and maxima, when plotted as a function of time, weakly depend on the finesse value and are completely determined by the cavity expansion rate as the resonance is being crossed. In particular, we showed how a simple empirical formula can determine the cavity expansion rate by observing these minima and maxima.
Once the speed was reconstructed, it was possible to fit the measurements with the simulation’s output and estimate the cavity’s finesse to .
The present letter gives an alternative method to the finesse measurement for a suspended cavity. The simplicity in the velocity reconstruction algorithm may be useful for a future control system capable of guiding the cavity into lock.
References
- [1] C. Bradaschia et al, Nucl. Intrum. Meth. Phys. Res. A 289, 518 (1990).
- [2] A. Abramovici et al, Science 256, 325 (1992).
- [3] K. Danzmann et al, Internal Report MPQ 190 (1994).
- [4] N.Kanda et al, Proceedings of second Workshop of Gravitational Wave Data Analysis, Orsay 1997
- [5] M.Barsuglia et al., submitted to Rev.Sci.In
- [6] J.Pérôme et al., J.Opt.Soc.Am.B, 14 2811 (1997)
- [7] S. T’Jampens, Rapport de Stage de Licence au LAL (1996)
Figure Captions
Fig.1: The observed ringing effect on
the transmitted DC power of the MC30 prototype. The transmitted
power is shown as a function of time as the cavity length sweeps
the optical resonance at an unknown rate.
Fig.2: The model used for the study of the MC30 ringing effect.
Fig.3: The calculated Fabry-Perot transmitted power, with , as a function of cavity length as the
resonance is swept at (static approximation), , and . In the figure,
corresponds to resonance.
Fig.4: The calculated stored power as
a function of time, with a fixed expansion rate set to , for different finesse values: ,
, and . Top graph: the stored
power. Bottom graph: the stored power time derivative.
Fig.5: The simulated stored power of a Fabry-Perot,
expanding at a constant rate , with . Top graph: the stored power as a function of time. Bottom
graph: the index , corresponding to the -th derivative zero,
as a function of time. The curve is fit to the expression
. Notice that
.
Fig.6: Fit results for the mirror relative velocity
reconstruction.On the left: The measured DC transmitted power. On
the right: the plot of as a function of index
. The error bars correspond to half of the oscilloscope’s
sampling time. The reconstructed speed is
.
Fig.7: The observed ringing effect for the MC30 prototype:
measurements and fits.
The finesse and velocity values are shown for each graph.
in arbitrary units.