3-D extent of the main ionospheric trough
—a case study
Zusammenfassung
The EISCAT radar system has been used for the first time in a four-beam meridional mode. The FAST satellite and ALIS imaging system is used in conjunction to support the radar data, which was used to identify a main ionospheric trough. With this large latitude coverage the trough was passed in 2½ hours period. Its 3-dimensional structure is investigated and discussed. It is found that the shape is curved along the auroral oval, and that the trough is wider closer to the midnight sector. The position of the trough coincide rather well with various statistical models and this trough is found to be a typical one.
, , , , , , , , , , , , 1Swedish Institute of Space Physics, Box 812, S-981 28 Kiruna, Sweden.
2EISCAT Scientific Association, Box 812, S-981 28 Kiruna, Sweden.
3EISCAT Scientific Association, Postboks 432, N-9170 Longyearbyen, Norway.
4National Institute of Polar Research, 1-9-10 Kaga, Itabashi-ku, Tokyo 173, Japan.
5School of Phys. and Astr., Univ. of Minnesota, MN 55455, USA.
6Space Sciences Laboratory, Univ. of California, Berkeley, CA 94720, USA.
7Lockheed-Martin Palo Alto Research Labs, CA 94304, USA.
1 Introduction
The main ionospheric trough is a typical feature of the sub-auroral ionospheric F-region, where it is manifest as a substantial depletion in electron concentration. It is frequently observed in the nighttime sector, just equatorward of the auroral zone. This trough is often referred to as the “main ionospheric trough” or “mid-latitude trough” to distinguish from troughs in other locations. The polar edge of the trough is co-located with the auroral zone. The equatorward boundary is less distinct, consisting of a gradually increasing amount of electrons, towards the plamasphere, which could be called the normal ionosphere. Inside the trough, there are electric fields present, giving rise to westward ion convection. Extensive reviews of modelling and observations of the main ionospheric trough are given by Moffett and Quegan (1983) and Rodger et al. (1992).
The present study was performed as a part of International Auroral Study (IAS). The goal for IAS was to provide simultaneous observations from ground and space of auroral processes. An important part of IAS was the FAST (Carlson et al., 1998) satellite. FAST was planned with significant ground-base support, i.e., control station and supporting scientific instrument, in Alaska, but as all polar orbiting satellites also passes over northern Scandinavia, it is well suited for coordination with ground-based instrument there as well. The most important instrument, besides the EISCAT radars, is ALIS (Brändström and Steen, 1994), the camera network in northern Sweden for auroral imaging.
2 The 4-beam EISCAT radar configuration
Previous radar experiments have used different scanning patterns to determine the topography of the trough; Collis and Häggström (1988) used a wide latitude scan (EISCAT common program experiment CP-3), Collis and Häggström (1989) used a small 4-position scan (CP-2), and Jones et al. (1997) used a combination of a wide scan to find the trough, and a narrow scan to observe the structure. Also a single position tri-static radar mode (CP-1) has been used by Häggström and Collis (1990). These methods all give a trade-off between time and space resolution—the more scan points the longer the time before subsequent observations of the same position, and for small and fast scans the range in space is often insufficient
Here we use for the first time all the EISCAT radars in a four-beam configuration close to the meridian plane to get a wide area of observation without losing time resolution. The EISCAT Svalbard Radar (ESR) (Wannberg et al., 1997) is field aligned (elevation 81.5°) at invariant latitude (ILAT) 75.2°N. The mainland tri-static UHF system (Folkestad et al., 1983) is also field aligned (elevation 77.4°) at ILAT 66.3°N. Between these, the Tromsø VHF radar is used in a “split-beam mode”, with the eastern antenna panels pointing north (70° elevation) and the western panels pointing vertical. The data is split into two sets, VHF-N (north) and VHF-V (vertical).
The combined “meta-radar” has a huge fan-like observation area around 70°N–80°N in geographic latitude.
3 Characteristics of the observed trough
The radar observations of the trough in question are shown in figure 1. The trough is seen as the clear decrease in electron density, and we determine the time in UT for the radars passing under the trough to be 1710–1720, 1820–1900, 1845–1925 and 1900–1940 respectively. The more prominent density increase for the Tromsø sites after 2000 UT is not the edge of the trough, rather typical F-region blobs, poleward of the trough.
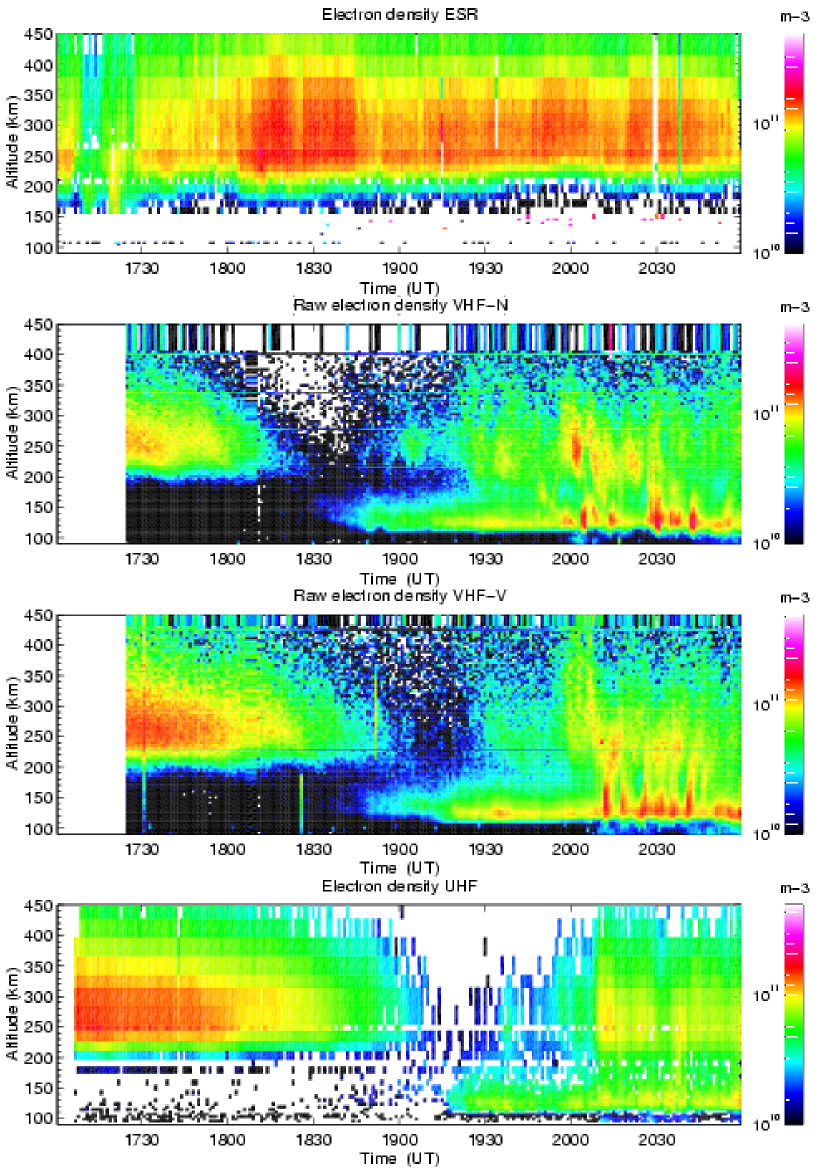
In figure 1 we see that the trough extends through all of the F-region, but not in the E-region. Note that white color is both highest density and no usable data, but generally no data is due to low density and this is seen to be the case here in the trough. In the northern part of the trough (later time in the data), we can actually see some typical weak ionization in the E-region, interpreted as diffuse aurora.
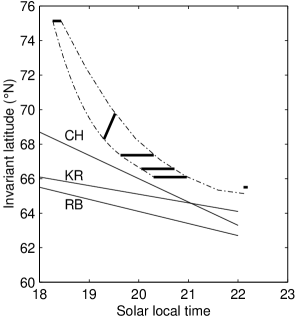
We compare the actual location of the trough minimum with predicted positions from models by Collis and Häggström (1988); Köhnlein and Raitt (1977); Rycroft and Burnell (1970) respectively111with Rycroft and Burnell (1970) changed to invariant latitude as suggested by Köhnlein and Raitt (1977)—all linear in SLT (solar local time) and . For the present day, values are before and 1o after 1800 UT. In figure 2, these model values are shown together with the actual position of the whole trough as determined from ESR, FAST, VHF-N, VHF-V and UHF respectively (from high to low latitude). We see that the deviations from the model predictions are substantial, and conclude that the linear models are not adequate for use over a wide range in latitude and time. This is not surprising because the fits used to construct the equations all had a big spread, even though the correlations were quite good.
A more recent study based on satellite data is made by Karpachev et al. (1996), where they use both latitude and longitude to make a statistical model not restricted to linear relations. In this model, the time used is magnetic local time (MLT), which is reasonable because the trough structure is governed by the earth magnetic field. They use both linear and non-linear time dependency, and find that for midnight hours, the difference is rather small, compared to the large spread in the data, but favours the non-linear time dependency.
From the start time of when each radar beam enters the trough, as seen in figure 1, we can estimate the trough apparent southward speed to be around 12 km/min from Longyearbyen to Tromsø, and around 4 km/min between the Tromsø beams. Assuming that the trough appears to pass over ESR and between the mainland radars with the respective speed, we can make a crude estimate of the vertical shape of the trough and the width: From the plot in figure 1, we estimate that the southward (early) wall, taken as the border of blue and green color, has an inclination of 35° for the VHF-N beam and 21° for VHF-V. This should be compared with the direction of the magnetic field at Tromsø, zenith angle 13° southwards. If we assume the trough wall to be field aligned, the anticipated inclination is 33° (20+13) for VHF-N and 13° for VHF-V, in good agreement with the rough estimate. In the plot of the field aligned beams, ESR and UHF, the trough wall appears vertical, which means it is field-aligned. The passing time for Longyearbyen is 10 minutes, which, using the above speeds, gives a width of 120 km, and for the Tromsø beams the time is 40 minutes, which gives a width of 160 km, both in north-south direction. This assumes the trough to consist of two straight parts, one extending from over Longyearbyen and Tromsø, the other over the Tromsø beams, instead of the actual arc-like shape as seen in figure 2, but it will anyway give an indication of the size. The east-west size can be estimated by using the earth rotation, this gives a velocity of 6.1 km/min, and a size of 61 km for Longyearbyen and around 10 km/min with size 400 km over Tromsø. The actual width, measured perpendicular over the trough extent is then 54 km for the part passing over Longyearbyen and 149 km for the part passing over Tromsø. That is, the trough radial width is actually broader equatorwards, closer to magnetic midnight. This is shown in figure 2.
The FAST satellite does not carry sounding instruments, so trough signatures are not as obvious to detect. The signature used is the precipitation north of the trough and the electric field associated with the ion () drift (absent south of the trough). It is known from earlier studies (Collis and Häggström, 1988) that there is a westward ion convection in the trough, which is absent outside. The satellite passes over the trough 1742–1743 UT as shown in figure 2.
During the night, the auroral imaging system ALIS was not operating continuously because there was no significant aurora and it was partly cloudy. However, some pictures were taken at relevant times, and they show faint diffuse aurora around the time when ALIS passes under the trough poleward boundary. If we plot the position of diffuse aurora from ALIS, it located just in the northern part of the trough region as extrapolated from the other more direct measurements in figure 2.
If we compare the observed trough with the relevant typical features of the mid-latitude trough as described in Moffett and Quegan (1983), we can say that the present trough is quite typical.
4 Conclusions
The EISCAT facility has been used in a new four-beam meridional mode. The ESR and UHF system are field-aligned, and the VHF system is split in two beams in between. This gives a very wide latitude range for observation, well suited to study ionospheric structures moving over large range in short time. With this configuration, no time resolution is lost.
In this case, the main ionospheric trough has been observed as high as 75°N ILAT down to 66°N ILAT. The observed trough is a quite typical one–it has all the common features known from earlier studies. The present observation is made when the index was low and stable, and so the trough was also quite non-dramatic, but this means that the trough is rather stationary over the big area of observation. This rules out significant time variations of the trough position, as would have been the case in a more active environment, enabling investigation over a relatively long period as the earth moves under it.
If we calculate the apparent southward motion of the trough, the speed is over 10 km/min between Longyearbyen and Tromsø, but about 4 km/min between the Tromsø sites. This is consistent if the trough is really an oval shape, so that Longyearbyen passes under it close to perpendicular, but for Tromsø latitudes the direction of passage is much more oblique, thereby the apparent southward motion is much slower. The trough is also seen to be wider towards magnetic midnight. The earlier proposed linear equations for trough motions are shown not to be valid over the latitude range in question.
Coordinated studies poses substantial difficulties, most of which are not scientific but rather administrative or probabilistic by nature. Nevertheless, if one measurement (EISCAT in this case) is good, the others can often be used to extract some extra information in support.
We gratefully acknowledge assistance of the EISCAT staff. The EISCAT Scientific Association is supported by France (CNRS), Germany (MPG), United Kingdom (PPARC), Norway (NFR),Sweden (NFR), Finland (SA) and Japan(NIPR).
Literatur
- Brändström and Steen (1994) Brändström, U. and Steen, Å., ALIS - a new ground-based facility for auroral imaging in northern scandinavia, in Proceedings of ESA Symposium on European Rocke and Balloon Programmes, ESA SP-355, ESA, 1994.
- Carlson et al. (1998) Carlson, C. W., Pfaff, R. F., and Watzin, J. G., The fast auroral snapshot mission, Geophys. Res. Lett., 25, 2013–2016, 1998.
- Collis and Häggström (1988) Collis, P. N. and Häggström, I., Plasma convection and auroral precipitation processes associated with the main ionospheric trough at high latitudes, J. Atmos. Terr. Phys., 50, 389–404, 1988.
- Collis and Häggström (1989) Collis, P. N. and Häggström, I., High resolution measurements of the main ionospheric trough using EISCAT, Adv. Space Res., 9, 545–548, 1989.
- Folkestad et al. (1983) Folkestad, K., Hagfors, T., and Westerlund, S., EISCAT: An updated description of technical characteristics and operational capabilities, Radio Sci., 18, 867–879, 1983.
- Häggström and Collis (1990) Häggström, I. and Collis, P., Ion composition changes during F-region density depletions in the presence of electric fields at auroral latitudes, J. Atmos. Terr. Phys., 52, 519–529, 1990.
- Jones et al. (1997) Jones, D. G., Walker, I. K., and Kersley, L., Structure of the polward wall of the trough and the inclination of the geomagnetic field above the EISCAT radar, Ann. Geophys., 15, 740–746, 1997.
- Karpachev et al. (1996) Karpachev, A. T., Deminov, M. G., and Afonin, V. V., Model of the mid-latitude ionospheric trough on the base of cosmos-900 and intercosmos-19 satellites data, Adv. Space Res., 18, 6221–6230, 1996.
- Köhnlein and Raitt (1977) Köhnlein, W. and Raitt, W. J., Position of the mid-latitude trough in the topside ionosphere as deduced from ESRO 4 observations, Planet. Space Sci., 25, 600–602, 1977.
- Moffett and Quegan (1983) Moffett, R. J. and Quegan, S., The mid-latitude trough in the electron concentration of the ionospheric F-layer: a review of observations and modeling, J. Atmos. Terr. Phys., 45, 315–343, 1983.
- Rodger et al. (1992) Rodger, A. S., Moffett, R. J., and Quegan, S., The role of ion drift in the formation of ionisation troughs in the mid- and high-latitude ionosphere—a review, J. Atmos. Terr. Phys., 54, 1–30, 1992.
- Rycroft and Burnell (1970) Rycroft, M. J. and Burnell, S. J., Statistical analysis of movement of the ionospheric trough and the plasmapause, J. Geophys. Res., 75, 5600–5604, 1970.
- Wannberg et al. (1997) Wannberg, G., Wolf, I., Vanhainen, L.-G., Koskenniemi, K., Röttger, J., Postila, M., Markkanen, J., Jacobsen, R., Stenberg, A., Larsen, R., Eliassen, S., Heck, S., and Huuskonen, A., The EISCAT Svalbard radar: A case study in modern incoherent scatter radar system design, Radio Sci., 32, 2283–2307, 1997.