[
The preliminary results of fast neutron flux measurements
in the DULB laboratory at Baksan
Abstract
One of the main sources of a background in underground physics experiments (such as the investigation of solar neutrino flux, neutrino oscillations, neutrinoless double beta decay, and the search for annual and daily Cold Dark Matter particle flux modulation) are fast neutrons originating from the surrounding rocks. The measurements of fast neutron flux in the new DULB Laboratory situated at a depth of 4900 m w.e. in the Baksan Neutrino Observatory have been performed. The relative neutron shielding properties of several commonly available natural materials were investigated too. The preliminary results obtained with a high-sensitive fast neutron spectrometer at the level of sensitivity of about are presented and discussed.
pacs:
PACS numbers: 06.90.+v, 29.30.Hs]
Introduction
It is well known that one of the main sources of a background in underground physics experiments (such as the investigation of solar neutrino flux, neutrino oscillations, neutrinoless double beta decay, and the search for annual and daily Cold Dark Matter particle flux modulation) are fast neutrons originating from the surrounding rocks. The sources of the fast neutrons are () reactions on the light elements contained in the rock (C, O, F, Na, Mg, Al, Si). Neutrons from spontaneous fission of 238U take an additional contribution in a total fast neutron flux of about 15-20%. Several research groups have investigated the neutron background at different underground laboratories [1, 2, 3]. Some of them used -dopped liquid scintillator technique [3], and others used in addition a Pulse Shape Discrimination technique [1].
The measurements of fast neutron flux in the Deep Underground Low Background Laboratory of Baksan Neutrino Observatory (DULB BNO) have been performed with using of a special, high-sensitive fast neutron spectrometer [4]. This laboratory is located under Mt. Andyrchy (Northen Caucasus Mountains, Russia) in a tunnel that penetrates 4.5 km into the mountain, at a depth of 4900 meters of water equivalent.
The results of such measurements lead to a conclusion that a neutron background places a severe limitation on the sensitivity of current and planned experiments. Owing this fact, the development of new cost-effective, high-strength radiation shielding against neutrons becomes a very important task for modern non-accelerator physics experiments. For such purposes the relative neutron shielding properties of several commonly available natural materials were investigated too. Specially, these materials are planned for use in the construction of large-volume underground facilities which will be covered with suitable shielding materials and are situated in the DULB Laboratory at Baksan.
Neutron detector
The spectrometer was constructed to measure low background neutron fluxes at the level up to in the presence of intensive gamma-ray background.
The detector consists of 30 l liquid organic scintillator viewed by photomultipliers with 19 neutron counters ( proportional counters) uniformly distributed through the scintillator volume (see [4] for detail). The spectrometer schematic view and the principle of operation are shown in Fig. 1.
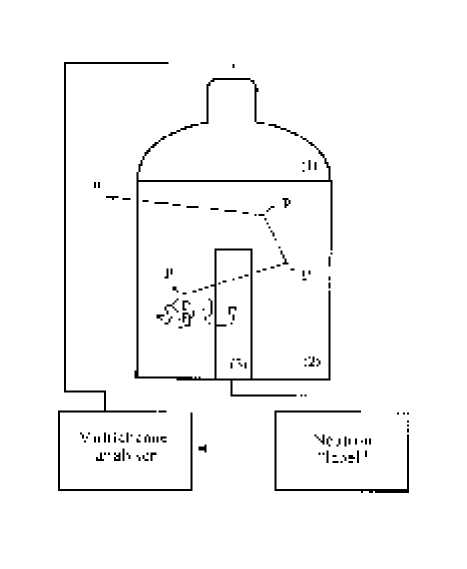
Fast neutrons with 1 MeV entering the liquid scintillator (LS) are moderated down to thermal energy, producing a LS signal. Then they diffuse through the detector volume to be captured in counters or on protons in the scintillator. The LS signal starts the recording system. After triggering the system waits a signal from any of the helium counters for a specific time. This time window corresponds to the delay time between correlated events in the scintillator and in the helium counters. This is one of specific features of the detector. The signal from the LS is ’marked’ as a coincident with a neutron capture in the counters only in the case if a single counter is triggered during the waiting period. An amplitude of the ’marked’ LS signal corresponds to an initial neutron energy. This method allows us to suppress the natural -ray background considerably.
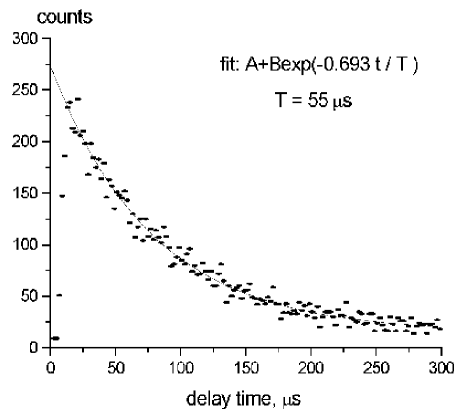
The described event discriminating procedure allows us to measure extremely low neutron fluxes at the level up to reliably even if the LS counting rate is as large as several hundred per second. The dead time of the detector is equal to the delay time (variable value, but generally about ) plus about , which is needed to analyze a LS event whether it corresponds to neutron or not. The detection efficiency depends in a complicated manner on the response function of the detector. As a rough estimation, we use the value of the efficiency, which is equal to in the energy range from 1 to 15 MeV. This is based on preliminary measurements performed with a Pu-Be source. Owing this fact, an absolute values of the neutron fluxes can be estimated with an uncertainty of 50% on the basis of available calibration data. The delay time is a specific feature of the detector and depends on the detector design. The acquisition system allows us to measure the delay time for the neutron events directly. Such measurements were carried out using a source with a time window selected to be equal to . A typical delay time distribution is shown in Fig. 2 A fitting procedure leads to a time constant of . According to this result it is sufficient to select the time window to be equal for an actual measurement.
Measurements
A The geometry
It has been mentioned that we have no yet precise information about the detection efficiency, that is why one can calculate absolute value of neutron fluxes with only certainty. However, it is possible to measure the relative neutron absorption abilities of various shields with high precision. This information will be very useful for development of new low background experiments and searching for cost-effective neutron absoption shields. Such measurements were carried out in the DULB BNO with using the described neutron spectrometer. This new laboratory, consisted of 8 separate counting facilities, is located under Mt. Andyrchy in a tunnel, which penetrates 4.3 into the mountain, at a depth of 4900
Quartzite and serpentine were selected as materials to be tested because of comparatively low concentrations of uranium- and thorium-bearing compounds contained in these rocks. For instant, the measured concentrations of uranium and thorium for rock serpentine are about g/g in comparison with g/g for the surrounding rock. As for potassium () contained in serpentine, it has been found less than g/g in comparison with g/g for the surrounding rock. Measurements of gamma-activity of different rock samples have been performed with using a well-type NaI gamma spectrometer with level of sensitivity of about g/g, operated in one of the underground low counting facilities at BNO [5]. The measured Th, U, and K concentrations in different rock samples are given in Table I.
| Sample | |||
|---|---|---|---|
| Quartzite | ) | ) | () |
| Serpentine | () | ) | |
| Surrounding | () | ) | ) |
| mine rock |
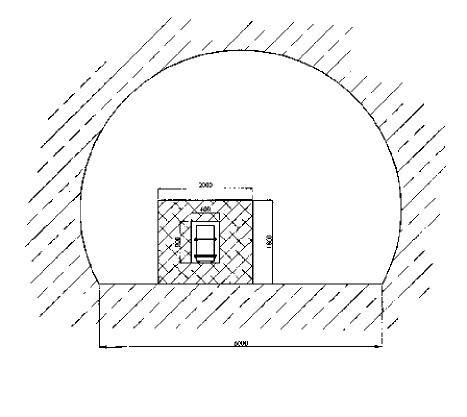
Four series of measurements were performed with the neutron spectrometer surrounded by different radiation shields. In the first series the spectrometer was surrounded with a lead shield 4 thickness (to reduce the natural gamma-ray counting rate), and measurements of the natural neutron background radition field existing in the open experimental site were performed. In the second and third series the spectrometer was surrounded with shields of quartzite and serpentine, respectively. The rock shields consisted of broken pieces of various sizes, ranging from 1 to 15 , with an effective shield thickness of 35 in all directions. The mean relaxation length of fast neutrons in these shields is about 15 (25 for quartzite and 21 for serpentine). In the fourth series we measured the internal background of the detector using a neutron-absorbing shield consisted of 40-cm thick section of polyethylene containing an admixture of boron and water about 30 thick. Schematic view of one of the investigated neutron shield and cross-section of the DULB experimental site are shown in Fig.3.
B Calibration
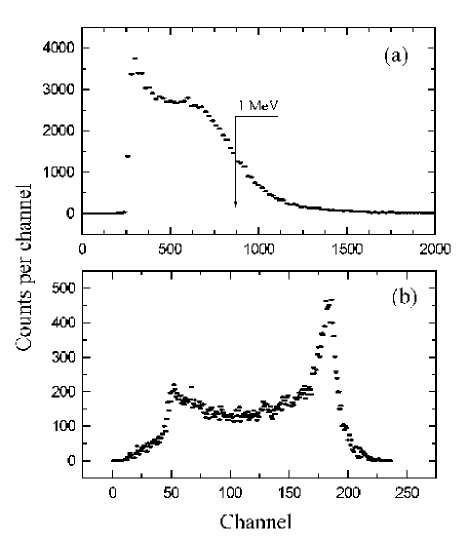
A -source has been used to calibrate the LS-channel. The energy of the middle of the Compton edge was assumed to be equal to 1 in the electron energy scale, which corresponds to in the neutron energy scale (see Fig.4a). A Pu-Be source was used to calibrate the NC-channel of counters. The spectrum produced by the Pu-Be source in the counters has a specific shape due to a wall effect which distorts the counter event spectrum (see Fig. 4b). In spite of this distortion, the range of energies observed for true neutron events is less narrow compared to the broad background spectrum produced by internal alphas. Using of the only events from the neutron window coincident with LS signals makes it possible to suppress the internal background of the detector.
C Conditions of measurements
Main conditions for all series of measurements, such as measuring times, LS- and NC-counting rates are given in the Table II.
| Value | No shield | Quartzite | Serpentine | Water+ |
|---|---|---|---|---|
| (5 cm lead) | Polyethylene | |||
| The measuring time, h | 400 | 290 | 950 | 605 |
| Dead Time, % | 12 | 4.3 | 2.7 | 1.5 |
| Total LS-rate, | 202 | 83 | 62 | 21 |
| Total NC-rate, | 123 0.6 | 103 0.6 | 92 0.3 | 95 0.4 |
| NC-rate in neutron window, | 58 0.4 | 37 0.4 | 27 0.2 | 27 0.2 |
| Random coincidences rate, | 1.410.005 | 0.380.002 | 0.190.001 | 0.070.001 |
| neutron counting rate, | 29.6 0.5 | 9.6 0.5 | -0.2 0.3 | — |
The typical exposure time for each series was a few weeks. The -ray background in the open experimental site is high enough that leads to -counting rate in the LS-channel of about . Due to this fact, following values of dead time were determined for different series: of the total exposure time for measurements with the lead shield, for quartzite series, for serpentine series, and for measurements with the polyethylene/water shield. To calculate the true neutron counting rates a proper dead time correction has been performed.
Data treatment and results
Contamination of gas inside the experimental site can make a considerable contribution (up to ) to the background -counting rate, which can influence results of the performed measurements because activity can vary significantly for a period of a measurement.
To suppress the count rate variation effect we used a special procedure for treatment of experimental data. It consists of the following steps.
Two types of data files are stored as a result of a measurement. One of them contains the information about neutron energy losses ( LS-signal amplitudes), counters signal amplitudes, and delay time for each ’neutron’ candidate event. Data accumulation was stopped every half-hour and overall numbers of NC-counts, LS-counts, LS-counts above 1 , and elapsed time were saved in a file. Total background - spectra for every half-hour run were measured simultaneously and saved in a second file to make it possible to take into account a time variation of the background -counting rate.
We consider three contributions into the experimentally measured counting rate : the random coincidence rate , the internal detector background counting rate , and the ’neutron’ counting rate , so that
| (1) |
We have made obvious assumption that the total background -spectrum and the random coincidence spectrum have the same shapes. To obtain random coincidence spectrum for further subtraction procedure the total background -spectrum has been normalized with a factor corresponding to the calculated random coincidence rate. The maximal evaluation for the random coincidence rate, if the LS- and NC- events are absolutely independent, can be calculated by the following way:
| (2) |
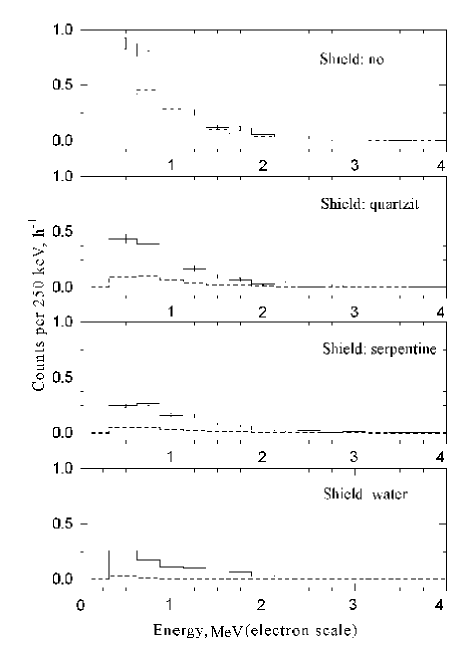
where is the -rate, is the -counters counting rate in the determined neutron energy window, is the time window. In the case of the performed measurements , this evaluation is very close to the real counting rate of random coincidences. Due to a variation in time of the activity, the current value of depends on time too. Owing to this fact, we applied the described subtraction procedure to each half-hour run with corresponding current value of , and then summarized resulting neutron spectra in a total serial spectrum. The accumulated LS-spectra of all coincidented events () and the recalculated spectra of random coincidence () for the no-shield, quartzite, and serpentine series are presented in Fig. 5.
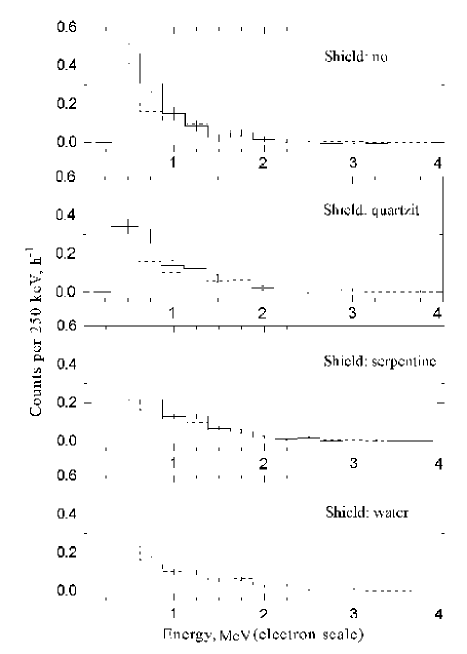
An internal detector background spectrum has been accumulated inside the neutron-absorbing shield consisting of polyethylene and water. Obtained counting rate of the internal background correlated (neutron-type, but non-neutron) events was measured as 27 counts per hour, which in terms of a neutron flux corresponds to () . The residual LS-spectra () in comparison with the internal background LS-spectrum () are presented in Fig. 6.
Performing the total subtraction procedure in according with the equation (1) we obtain values of the neutron counting rate for the no-shield, quartzite, and serpentine series. Taking into account the detection efficiency uncertainty () the obtained values of fast neutron fluxes (above 700 of neutron energy) are presented here in a following way:
for the no-shield measurement,
for quartzite shield,
for serpentine shield,
were a = ( + )/.
One can see that the resulting neutron flux measured when the serpentine shield was in place were found to be at about the minimum level of sensitivity of the spectrometer. It means that a neutron background inside the serpentine shield is consisted with a neuron flux less than . It indicates that serpentine is indeed clear from uranium and thorium, and is, therefore, the most likely candidate for use as a cost-effective neutron shield component material for large-scale low background experiments.
A delay time distribution analysis was performed to understand the origin of a high level of the internal detector background.
Delay time distributions
Decays of Bi and Po radioactive isotopes, such as
| (3) |
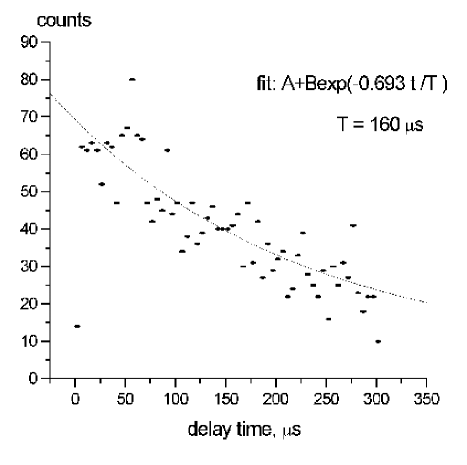
which can take place in the helium counter walls, have been considered as main possible sources of the significant internal background. To imitate an actual neutron event beta decay of can fire the liquid scintillator, followed by a delayed capture - signal from Po decay in helium counters. The delay time distribution of the neutron-type coincidented events obtained for the series in the water shield is shown in Fig. 7. Fitting procedure leads to the time constant .
It means that, as it was supposed, the origin of the internal background of our detector is mostly due to contamination of in the -counter walls. The delay time distributions for other series of measurements are shown in Fig. 8.
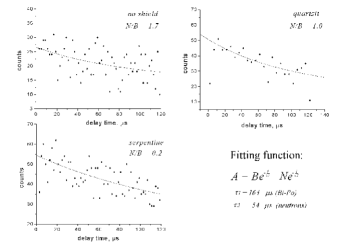
The following fitting function was used to analize these distributions ( is expressed in s):
| (4) |
where A is a constant, N is an amplitude corresponding to neutrons and B corresponds to internal background. The ratio N/B, which was obtained in this manner, decreases from measurements in the lead shield to the measurements in the serpentine shield.
Conclusions
The main results of the measurements can be summarized as follows.
(I). The preliminary results obtained from the fast neutron spectrum accumulated in the open experimental site of the DULB Laboratory at Baksan is consisted with a neutron flux (for neutrons with energy above 700 keV) estimated as values from to depending on the present uncertainty in determination of the detection efficiency.
(II). The neutron spectrometer sensitivity in a shielded experimental site is estimated as for a measuring time of about 1000 h.
(III). It is shown that the main source of the detection sensitivity limitation, rather then random coincidences, is the internal background of the spectrometer, which is mostly due to the presence of -particle emitters ( decays) in the -counters walls.
(IV). The achieved neutron background inside the serpentine shield is consisted with a neutron flux less than . It indicates that serpentine is one of the more likely candidate for use as a cost-effective neutron shield component material for large-scale low background experiments.
We have obtained the presented results using the simple event discrimination procedure and did not use pulse shape discrimination yet. Nevertheless, it takes us a possibility to measure extremely low neutron fluxes up to even when external -counting rate is more than .
Acknowledgements.
We are grateful to I.I.Pyanzin for the management in proving of reserves and quarrying of the domestic ultra basic rock samples. We thank P.S.Wildenhain for careful reading of this article and his critical remarks. We acknowledge the support of the Russian Foundation of Basic Research. This research was made possible in part by the grants of RFBR No. 98–02 16962 and No. 98-02-17973.REFERENCES
- [1] V. Chazal, B. Chambon, M. De Jesus . Astroparticle Physics, v.9, n.2 (1998) pp. 163-172
- [2] F. Arneodo, F. Cavanna, S. Parlatti . INFN/AE-97/52 (1997)
- [3] R.Alexan . NIM A274 203(1989).
- [4] J.N. Abdurashitov, V.N. Gavrin, G.D. Efimov, A.V. Kalikhov, A.A. Shikhin and V.E. Yants, “Instrum. and Exp. Tech.” , Vol. 40, No 6, 1997, pp. 741–752.
- [5] A.A.Klimenko, A.A.Pomansky, A.A.Smolnikov, NIM B17 445(1986).