Crossover from a square to a hexagonal pattern
in Faraday surface waves
Abstract
We report on surface wave pattern formation in a Faraday experiment operated at a very shallow filling level, where modes with a subharmonic and harmonic time dependence interact. Associated with this distinct temporal behavior are different pattern selection mechanisms, favoring squares or hexagons, respectively. In a series of bifurcations running through a pair of superlattices the surface wave pattern transforms between the two incompatible symmetries. The close analogy to 2D and 3D crystallography is pointed out.
pacs:
PACS: 47.54.+r 47.20.Ma 47.20.LzWhen a fluid layer is vibrated vertically patterns of standing waves occur at the liquid-air interface. This experiment, first studied by Faraday [1] in 1831, has become a paradigm for the investigation of spontaneous pattern formation [2]. From an experimental point of view, the Faraday setup is particularly attractive since the characteristic length and time scales are under external control and relaxation times are pretty short. If the vibration signal is sinusoidal and weakly supercritical one generically observes well ordered standing wave patterns in the form of squares or lines, oscillating with half the frequency of the excitation (subharmonic response). By carefully tuning the drive frequency within the crossover regime between gravity and capillary surface waves, more complicated (quasi-periodic) patterns with an 8 or even 10-fold point symmetry have been predicted and observed [3]. Edwards and Fauve [4] introduced the idea of a two-frequency excitation signal. The resulting interplay between the competing modes gave rise to unexpected new phenomena like hexagonal, triangular, quasi-periodic, spatially localized structures and even superlattice type patterns [5, 6]. However, the large number of control parameters of a multi-frequency drive signal renders such an experiment problematic as far as a systematic exploration of parameter space is concerned and it lacks an intuitive understanding of the fundamental principles. By use of a viscoelastic liquid, it has been shown [7] that the familiar subharmonic Faraday resonance can be preempted by a synchronous (harmonic) response, leading to a bicriticality as well. However, such fluids are more complicated than Newtonian liquids and the characterization of their nonlinear rheology is incomplete. For Newtonian fluids the parameter region in which the response switches from subharmonic to harmonic is difficult to access [8, 9, 10, 11] since it requires a very shallow filling depth, large shaking elevations and thus a powerful vibrator. This article describes a systematic investigation of a Newtonian liquid under a single-frequency drive operated close to the bicritical crossover. The interesting new feature is a ”phase transition” from a quadratic pattern to a structure of hexagonal symmetry. The symmetry change proceeds via a sequence of superlattices with 2-fold and 6-fold point symmetry.
Our new shaker system has a force of 4800 N and a maximum peak-peak elevation of 5.4 cm. It is operated at a rather low drive frequency of . The combination of these parameters with a filling depth of , only, is necessary to access the harmonic-subharmonic bicriticality. The container with an inner diameter of (equivalent to about times the wavelengths) is sealed by a glass plate and temperature controlled at C. At this temperature the sample fluid (low viscosity Silicon oil, Dow Corning 200) is specified by a kinematic viscosity , a surface tension of and a density . The actual acceleration experienced by the container is recorded by a piezoelectric device. A feedback loop control limits disturbing anharmonicities to a level of less than 0.2%. Our visualization method for the evaluation of pattern symmetries has been described elsewhere [7]. Although this simple light reflection technique provides high contrast pictures, the relation between the recorded intensity and the surface profile is not trivial. Nevertheless for simple structures like squares, we were able to reconstruct the profile by the following procedure: Starting from an estimated surface profile composed of a small number of spatial Fourier modes, we computed the light distribution of the expected video image by means of a ray tracing algorithm. Then we adapted the mode amplitudes and their relative phases to optimize the agreement between the calculated and recorded video pictures.
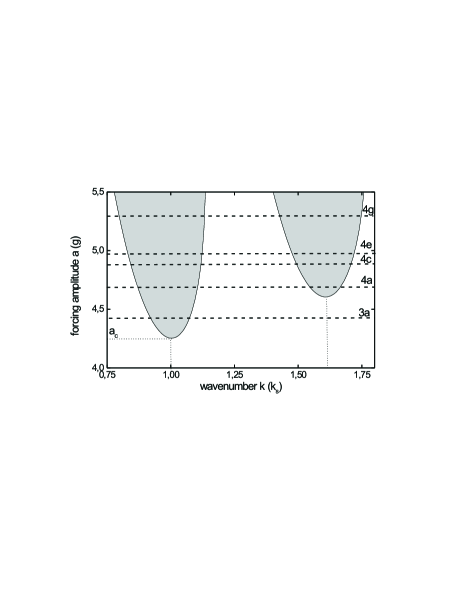
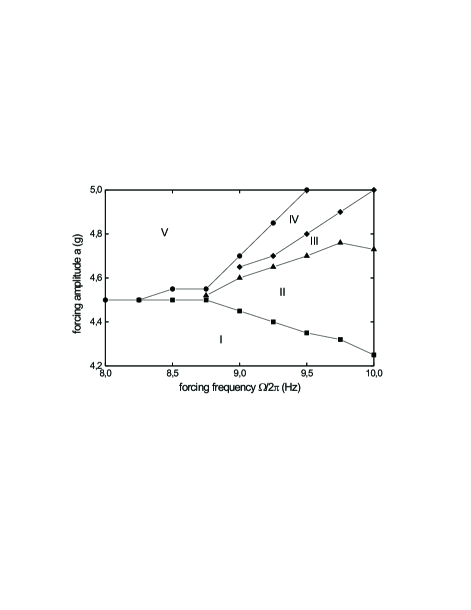
The linear stability theory [12] evaluated for our fluid predicts that the bicritical threshold, at which the system changes from the harmonic instability at lower to the subharmonic instability at higher frequencies, occurs at a drive frequency of . This is in good agreement with the present results. Fig. 1 depicts a calculated neutral stability diagram (acceleration amplitude vs. wavenumber ) for an excitation frequency slightly above . The minimum of the left (right) resonance tongue defines the wavenumber () of the subharmonic S (harmonic H) instability. The absolute minimum corresponds to the onset of Faraday waves. Fig. 2 presents a phase diagram classifying the surface patterns as observed during a quasistatic amplitude ramp at fixed drive frequencies. Starting from a subcritical drive the amplitude is increased by steps of . After each increment the scan is suspended for 240 sec and a surface picture is taken thereafter. Having reached the ramp is reversed. There is no noticeable hysteresis for the primary onset between upward and downward scans.
Within the drive frequency region of the harmonic Faraday instability () the bifurcation scenario is rather conventional: Entering subregion from below (see Fig. 2), we find a perfect hexagonal surface tiling which persists up to the maximum drive amplitude.
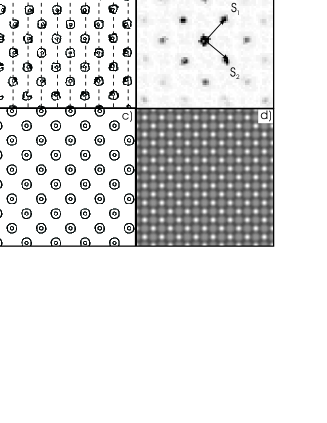
The focus of the present paper is on the subharmonic region , where the onset pattern (region ) is quadratic, while hexagons (region ) occur at rather elevated shaking amplitudes as a higher bifurcation. Our aim is to describe the bifurcation sequence, which results from an amplitude scan at the fixed drive frequency of (gravity wave regime). The primary Faraday pattern (region in Fig. 2) has a subharmonic time dependence and exhibits a perfect quadratic symmetry as shown in Fig. 3a. The associated spatial power spectrum (Fig. 3b) indicates the fundamental wave vectors and but also pronounced contributions from higher harmonics, in particular . The appearance of square patterns in low viscosity gravity waves agrees with a small amplitude theory expanded around the subharmonic instability threshold [3]. At those small values of the competing harmonic Faraday modes do not noticeably affect the pattern selection process. The shallow filling level used in our setup makes the surface elevation profile very anharmonic with high, narrow tips but broad, shallow hollows. We have re-constructed the surface profile belonging to Fig. 3a by our ray tracing algorithm. The spatial dependence of the interface deformation is decomposed according to
| (1) |
where and . A density plot with the gray level proportional to the local surface elevation is given in Fig. 3d together with the related video image (c) as computed by ray tracing the reflected light.
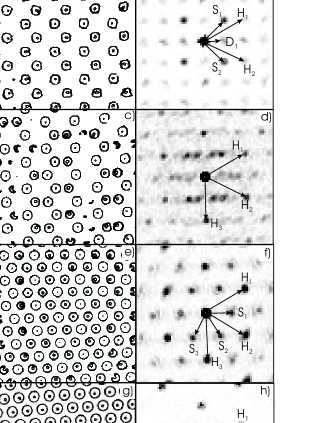
With increasing drive amplitude the harmonic Faraday instability gradually gains influence upon the pattern selection dynamics. When entering region we observe a continuous transition to a superlattice (see Fig. 4a,b), characterized by a new subharmonic mode with wave vector . Even though the associated Fourier spectrum also shows a second mode orthogonal to the first one, the amplitude ratio indicates that is strongly prevailing. Therefore the original quadratic invariance of the pattern is broken and replaced by the simpler rectangular symmetry. The surface profile as derived by ray tracing suggests that the mode enters Eq. 1 in the form . Assuming (by a proper choice of the origin) the cubic nonlinearity enters the amplitude equation for and thus restricts the relative phase to or , depending on the sign of the related coupling coefficient. The former (latter) value is associated with a modulative (displacive) mode. Details will be published elsewhere. For our system the second case applies, which becomes evident by comparing the video images Figs. 3a and 4a: With increasing order parameter the rows of elevation maxima (connected by dashed lines in Fig. 3a) are displaced in opposite directions as indicated by the arrows. The displacive mode is excited by a pair of wavevector triads according to the geometrical relations and . The modes , oscillate synchronously with the drive. Their contribution to the triad-couplings becomes energetically efficient since coincides almost exactly with the wavenumber associated with the harmonic Faraday instability (Fig.1).
The transition from region to is accompanied by a very slow rearrangement of the pattern and the occurrence of defects. A snapshot taken during this crossover process is shown in Fig. 4c. As is increased, the displacive mode gradually dies out and thus and enter into a new triad together with the nonlinear harmonic mode . Even though does not exactly match the unstable wavenumber band around (see Fig. 1) the drive amplitude is apparently high enough to allow this detuning. The six-armed star of wavevectors shown in Fig. 4d already suggests a 6-fold rotational invariance, but the true symmetry of this ”quasi-hexagonal” transient state is still 2-fold: The angles between and and between and are and , respectively, rather than . ¿From the horizontal streaks of the Fourier spectrum of Fig. 4d it can be seen that the translational coherence in -direction is in a process of disintegration, while the spatial periodicity in -direction and the 2-fold point symmetry are still preserved. Nevertheless the mutual resonance among the is the precursor of the hexagonal symmetry, which will follow.
The transient re-orientation process comes to a halt when the pattern has accomplished the ideal hexagonal symmetry (region IV and Figs. 4e,f). At this stage the harmonic Faraday modes govern the pattern selection process. The structure depicted in Figs. 4e,f can be understood as a superlattice of the hexagonal lattice of the final state (region ). Apparently, the subharmonic contributions to the Fourier spectrum are dynamically slaved, since the 6-fold symmetry dictated by the -modes is recovered in number as well as in orientation by the new subharmonic set . Note that the subharmonic time dependence does not allow a mutual resonance among the . The relative -orientation between the S-star and the H-star results from the triad cross-coupling between harmonic and subharmonic modes. The appropriate geometrical resonance conditions , etc., also enforce the length of the subharmonic wavevectors to reduce from unity to . It can be shown that the fundamental modes contributing to the superlattice enter Eq. 1 with equal spatial phases . The equality follows from the mutual resonance among the -modes, while the cross-coupling between - and -modes enforces . The remaining condition is more subtle and established only at quintic order in the associated amplitude equation. With the reasoning outlined in Ref.[13] one obtains either or . Since the former (latter) case is associated with a 6-fold (3-fold) symmetry, we conclude from Fig.4e that applies in our system.
If the drive amplitude is rised into phase region the long wavelength modulation of the superlattice disappears and the pure hexagonal state as depicted in Fig. 4g survives. Simultaneously the -component in the temporal power spectrum of the surface oscillation dies out.
To summarize: The present letter reports a Faraday experiment in a very thin fluid layer. Drive frequency and filling depth are adjusted such that waves with subharmonic and harmonic time dependence become simultaneously unstable. The different time dependencies imply distinct wavelengths, but they are also responsible for different nonlinear pattern selection mechanisms, which favor either squares or hexagons. In a series of bifurcations the transition from one symmetry to the other takes place in a surprisingly coherent manner running through a displacive and a superlattice.
A comparison to crystallographic phase transitions is in order. Hexagonal structures on one side and square (in ) or cubic (in 3D) structures on the other side are incompatible since there is no group-subgroup relation connecting the different space groups. Hence such transitions involve a reconstruction of the lattice via the formation of lattice defects. The hcp-fcc transition, occuring e.g. in solid 4He, is a prominent 3D example. Here the relevant defects are stacking faults. The same principles hold of course for the present patterns. At the same stage along the phase sequence from to there has to be a reconstructive transition involving defects. In fact the pattern of Fig. 4c taken just at the - boundary shows such as line defect (running in the vertical direction in the right half of the picture). In contrast to the hcp-fcc transition, the transition between the two incompatible symmetries of our system does not occur in a single step, but involves two intermediate phases. Transition of the type and are also known in crystallography. The transition from a simple hexagonal lattice to a superstructure has been observed for instance in monolayers of adsorbed on graphite [14]. The displacive transition is analogous to the reconstruction of the (100) surface of Wolfram crystals Ref. [15]. Here the surface atoms are displaced in exactly the same way as the elevation maxima of the surface profile in the present study. In terms of 2D space groups the transition is from to implying a doubling of the unit cell. The rectangular symmetry calls for a rectangular metric, that is for different lattice parameters along two orthogonal directions but this has not observed in our experiment, presumably because of the insufficient resolution.
Acknowledgements — We thank J. Albers for his support. This work is supported by the Deutsche Forschungsgemeinschaft.
REFERENCES
- [1] M. Faraday, Philos. Trans. R. Soc. London 52, 319 (1831).
- [2] for a review see: J. W. Miles and D. Henderson, Ann. Rev. Fluid Mech. 22, 143 (1990); H. W. Müller, R. Friedrich, and D. Papathanassiou, Theoretical and experimental studies of the Faraday instability, in: Lecture notes in Physics, ed. by F. Busse and S. C. Müller, Springer (1998).
- [3] W. Zhang and J. Vinals, Phys. Rev. E 56, R4283 (1996); P. Chen and J. Vinals, Phys. Rev. Lett. 79, 2670 (1997); D. Binks and W. van de Water, Phys. Rev. Lett. 78, 4043 (1997).
- [4] W. S. Edwards and S. Fauve, J. Fluid Mech., 278, 123 (1994).
- [5] A. Kudrolli, B. Pier, J. P. Gollub, Physica D 123, 99 (1998).
- [6] H. Arbell and J. Fineberg, Phys. Rev. Lett. 81, 4384 (1998).
- [7] H. W. Müller, W. Zimmermann, Europhys. Lett. 45, 169 (1999); C. Wagner, H. W. Müller, K. Knorr, Phys. Rev. Lett. 83, 308 (1999).
- [8] T. B. Benjamin and F. Ursell, Proc. R. Soc. London A 255, 505 (1954)
- [9] K. Kumar, Proc. Roy. Soc. of London, Series A 452, 1113 (1996).
- [10] E. Cerda and E. Tirapegui, Phys. Rev. Lett. 78, 859 (1997); J. Fluid Mech. 368, 195 (1998).
- [11] H. W. Müller, H. Wittmer, C. Wagner, J. Albers, and K. Knorr, Phys. Rev. Lett. 78, 2357 (1997).
- [12] K. Kumar and L. S. Tuckerman, J. Fluid Mech. 279, 49 (1994).
- [13] H. W. Müller, Phys. Rev. Lett. 71, 3287 (1993).
- [14] St. Fassbender, C. Steimer, D. Arndt, and K. Knorr, Phys. Rev. Lett. 75, 2526 (1995).
- [15] G. Schmidt, H. Zagel, H. Landskorn, K. Heinz, K. Müller and J. B. Pendry, Surface Science 271, 416 (1992).